
|
|||||
|
 | |
| |
| |
| |
| |
| |
|
Gene: JAG2 |
Gene summary for JAG2 |
| Gene information | Species | Human | Gene symbol | JAG2 | Gene ID | 3714 |
| Gene name | jagged canonical Notch ligand 2 | |
| Gene Alias | HJ2 | |
| Cytomap | 14q32.33 | |
| Gene Type | protein-coding | GO ID | GO:0000003 | UniProtAcc | Q9Y219 |
Top |
Malignant transformation analysis |
| Identification of the aberrant gene expression in precancerous and cancerous lesions by comparing the gene expression of stem-like cells in diseased tissues with normal stem cells |
| Entrez ID | Symbol | Replicates | Species | Organ | Tissue | Adj P-value | Log2FC | Malignancy |
| 3714 | JAG2 | LZE24T | Human | Esophagus | ESCC | 1.33e-02 | 1.14e-01 | 0.0596 |
| 3714 | JAG2 | P2T-E | Human | Esophagus | ESCC | 8.15e-06 | -1.89e-02 | 0.1177 |
| 3714 | JAG2 | P4T-E | Human | Esophagus | ESCC | 9.90e-10 | 1.41e-01 | 0.1323 |
| 3714 | JAG2 | P5T-E | Human | Esophagus | ESCC | 6.21e-11 | 1.82e-01 | 0.1327 |
| 3714 | JAG2 | P8T-E | Human | Esophagus | ESCC | 2.67e-13 | 2.60e-01 | 0.0889 |
| 3714 | JAG2 | P10T-E | Human | Esophagus | ESCC | 8.96e-60 | 1.26e+00 | 0.116 |
| 3714 | JAG2 | P12T-E | Human | Esophagus | ESCC | 9.06e-24 | 4.92e-01 | 0.1122 |
| 3714 | JAG2 | P15T-E | Human | Esophagus | ESCC | 4.50e-26 | 7.99e-01 | 0.1149 |
| 3714 | JAG2 | P16T-E | Human | Esophagus | ESCC | 6.78e-05 | 1.11e-01 | 0.1153 |
| 3714 | JAG2 | P21T-E | Human | Esophagus | ESCC | 2.00e-14 | 4.30e-01 | 0.1617 |
| 3714 | JAG2 | P22T-E | Human | Esophagus | ESCC | 2.90e-10 | 7.80e-02 | 0.1236 |
| 3714 | JAG2 | P24T-E | Human | Esophagus | ESCC | 1.72e-03 | 1.43e-02 | 0.1287 |
| 3714 | JAG2 | P26T-E | Human | Esophagus | ESCC | 1.17e-14 | 1.43e-01 | 0.1276 |
| 3714 | JAG2 | P27T-E | Human | Esophagus | ESCC | 3.83e-24 | 4.08e-01 | 0.1055 |
| 3714 | JAG2 | P28T-E | Human | Esophagus | ESCC | 2.48e-23 | 3.33e-01 | 0.1149 |
| 3714 | JAG2 | P30T-E | Human | Esophagus | ESCC | 2.13e-13 | 5.29e-01 | 0.137 |
| 3714 | JAG2 | P31T-E | Human | Esophagus | ESCC | 5.41e-32 | 5.16e-01 | 0.1251 |
| 3714 | JAG2 | P32T-E | Human | Esophagus | ESCC | 2.08e-02 | 1.72e-01 | 0.1666 |
| 3714 | JAG2 | P37T-E | Human | Esophagus | ESCC | 1.36e-15 | 4.70e-01 | 0.1371 |
| 3714 | JAG2 | P40T-E | Human | Esophagus | ESCC | 5.18e-06 | 1.58e-01 | 0.109 |
| Page: 1 2 3 4 |
| Tissue | Expression Dynamics | Abbreviation |
| Esophagus | 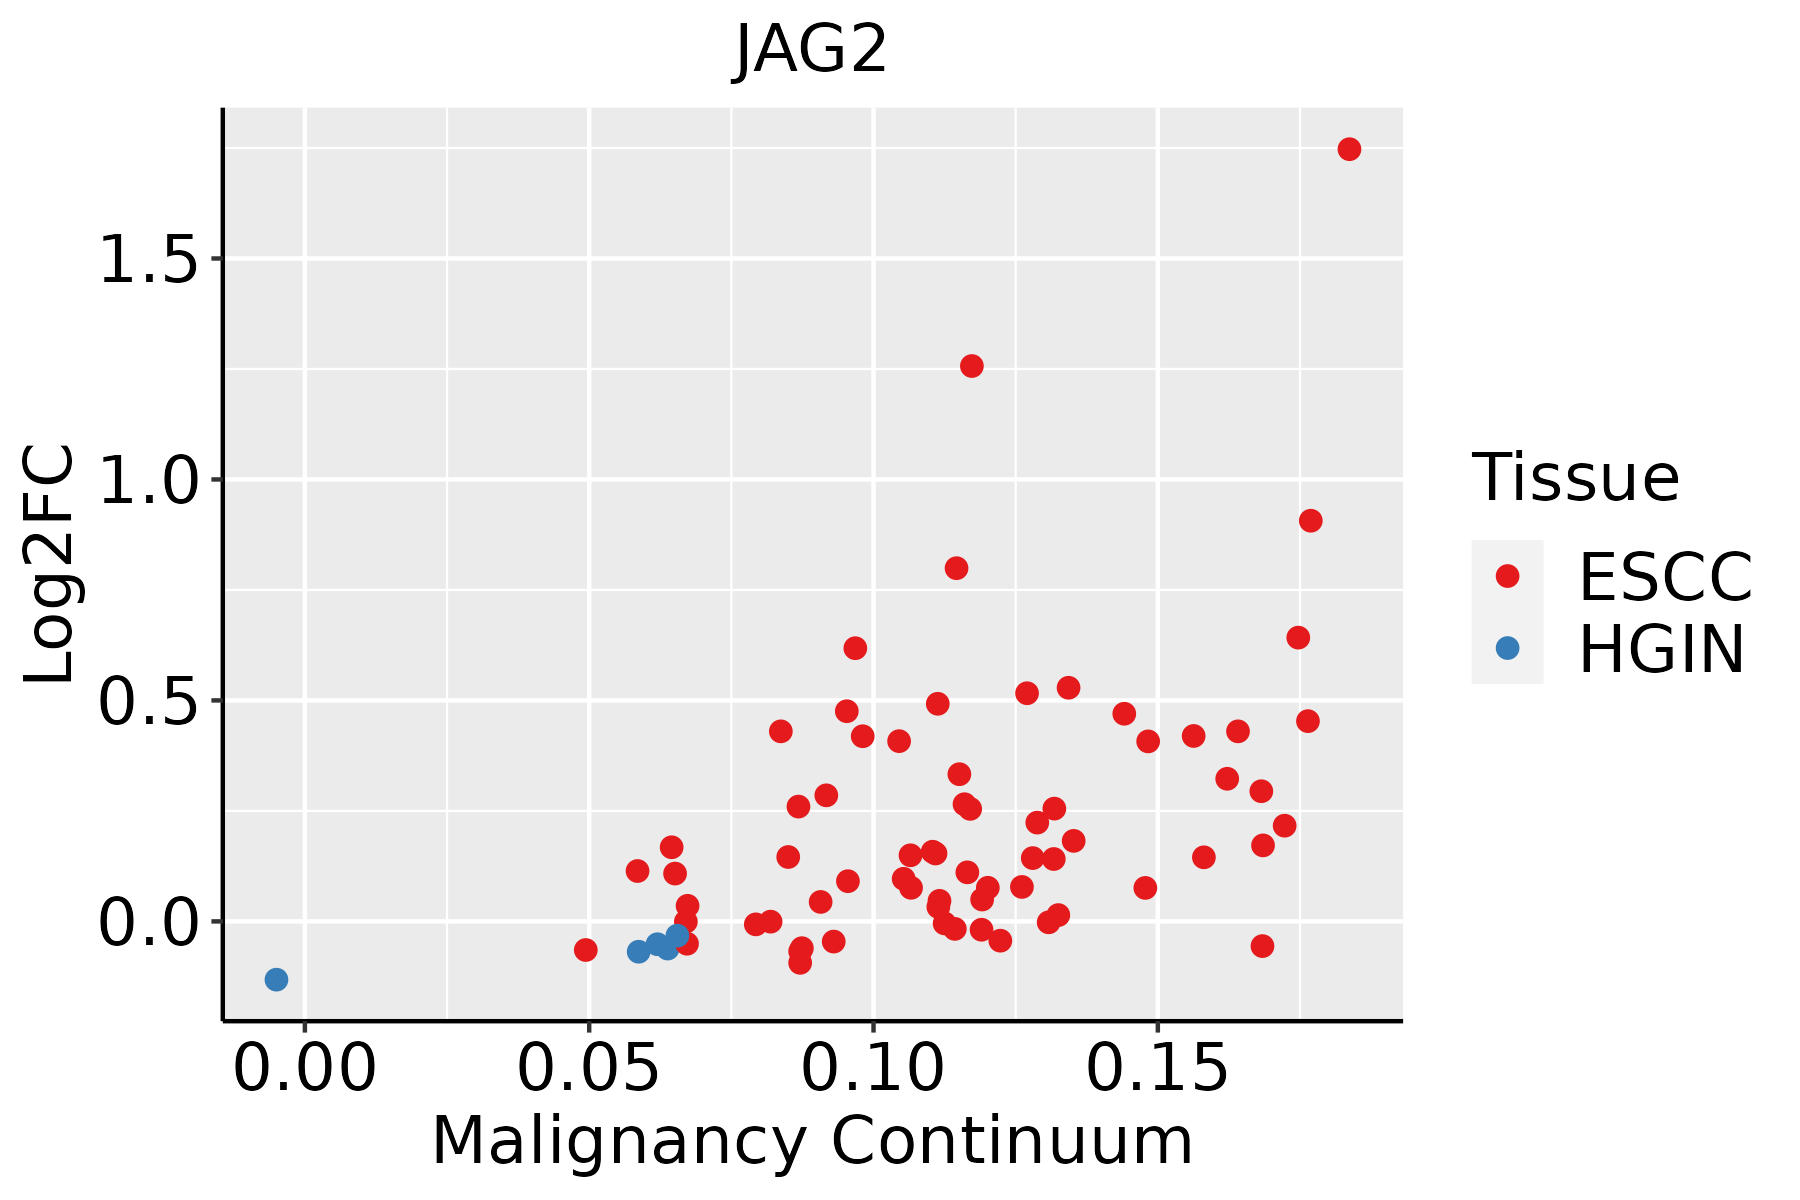 | ESCC: Esophageal squamous cell carcinoma |
| HGIN: High-grade intraepithelial neoplasias | ||
| LGIN: Low-grade intraepithelial neoplasias | ||
| Oral Cavity |  | EOLP: Erosive Oral lichen planus |
| LP: leukoplakia | ||
| NEOLP: Non-erosive oral lichen planus | ||
| OSCC: Oral squamous cell carcinoma | ||
| Prostate |  | BPH: Benign Prostatic Hyperplasia |
| Skin | 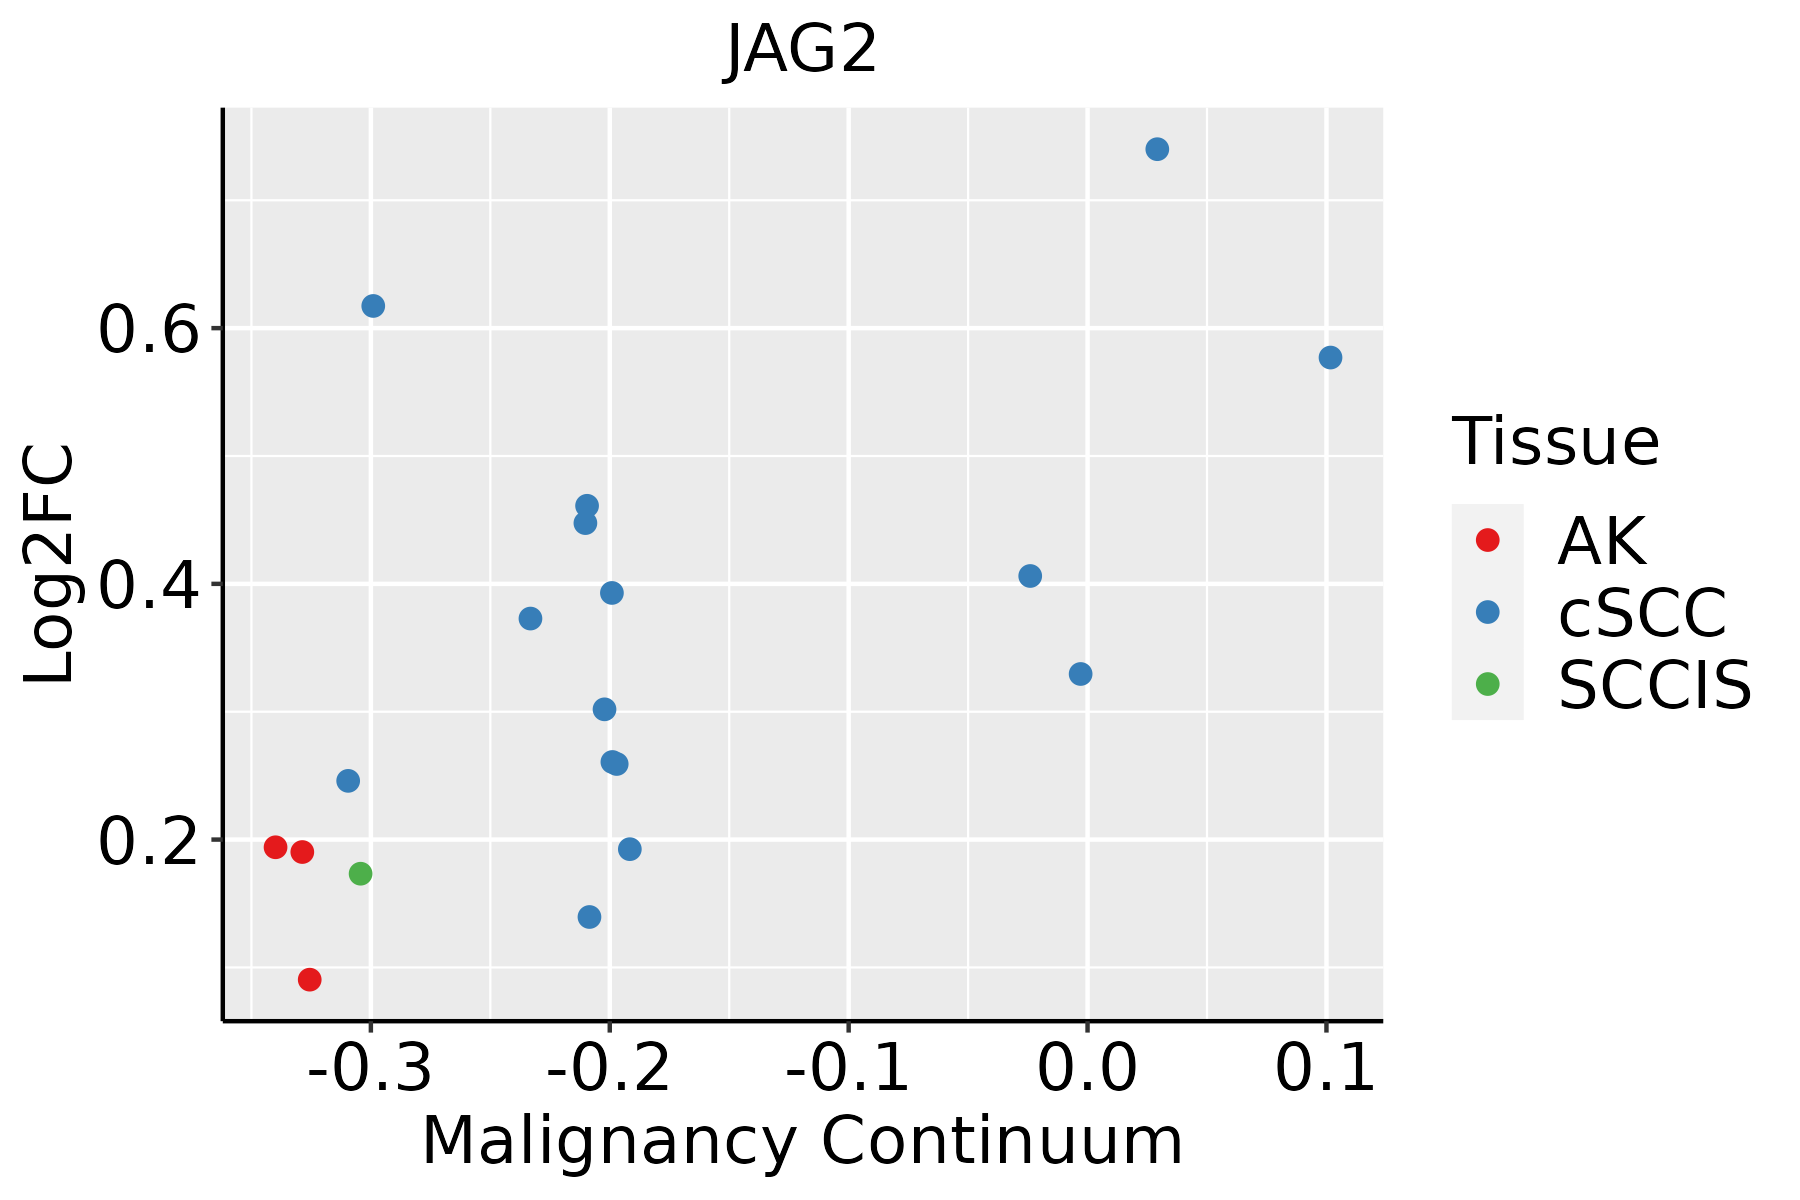 | AK: Actinic keratosis |
| cSCC: Cutaneous squamous cell carcinoma | ||
| SCCIS:squamous cell carcinoma in situ |
| ∗log2FC in expression of this searched gene in stem-like cells from each diseased tissue sample relative to stem-like cells in normal samples in each tissue plotted against the malignancy continuum. Samples are colored based on if they are from different disease stage. |
Top |
Malignant transformation related pathway analysis |
| Find out the enriched GO biological processes and KEGG pathways involved in transition from healthy to precancer to cancer |
| Tissue | Disease Stage | Enriched GO biological Processes |
| Colorectum | AD |  |
| Colorectum | SER |  |
| Colorectum | MSS |  |
| Colorectum | MSI-H |  |
| Colorectum | FAP |  |
| ∗Top 15 enriched GO BP terms are showed in the bar plot of each disease state in each tissue. Each row represents a significant GO biological process which is colored according to the -log10(p.adjust). |
| Page: 1 2 3 4 5 6 7 8 9 |
| GO ID | Tissue | Disease Stage | Description | Gene Ratio | Bg Ratio | pvalue | p.adjust | Count |
| GO:000170119 | Esophagus | ESCC | in utero embryonic development | 243/8552 | 367/18723 | 1.00e-15 | 6.86e-14 | 243 |
| GO:00163316 | Esophagus | ESCC | morphogenesis of embryonic epithelium | 98/8552 | 147/18723 | 2.12e-07 | 3.27e-06 | 98 |
| GO:000854410 | Esophagus | ESCC | epidermis development | 193/8552 | 324/18723 | 2.87e-07 | 4.19e-06 | 193 |
| GO:000991310 | Esophagus | ESCC | epidermal cell differentiation | 122/8552 | 202/18723 | 1.69e-05 | 1.51e-04 | 122 |
| GO:00072197 | Esophagus | ESCC | Notch signaling pathway | 106/8552 | 172/18723 | 1.74e-05 | 1.55e-04 | 106 |
| GO:00085935 | Esophagus | ESCC | regulation of Notch signaling pathway | 59/8552 | 95/18723 | 9.12e-04 | 4.65e-03 | 59 |
| GO:004211018 | Esophagus | ESCC | T cell activation | 256/8552 | 487/18723 | 1.18e-03 | 5.87e-03 | 256 |
| GO:19031317 | Esophagus | ESCC | mononuclear cell differentiation | 226/8552 | 426/18723 | 1.20e-03 | 5.88e-03 | 226 |
| GO:00302176 | Esophagus | ESCC | T cell differentiation | 137/8552 | 257/18723 | 8.09e-03 | 2.87e-02 | 137 |
| GO:0060021 | Esophagus | ESCC | roof of mouth development | 50/8552 | 85/18723 | 1.00e-02 | 3.42e-02 | 50 |
| GO:19040197 | Esophagus | ESCC | epithelial cell apoptotic process | 68/8552 | 121/18723 | 1.27e-02 | 4.21e-02 | 68 |
| GO:00300984 | Esophagus | ESCC | lymphocyte differentiation | 192/8552 | 374/18723 | 1.52e-02 | 4.93e-02 | 192 |
| GO:000170116 | Oral cavity | OSCC | in utero embryonic development | 207/7305 | 367/18723 | 7.92e-12 | 2.95e-10 | 207 |
| GO:004211016 | Oral cavity | OSCC | T cell activation | 245/7305 | 487/18723 | 2.00e-07 | 3.22e-06 | 245 |
| GO:00085449 | Oral cavity | OSCC | epidermis development | 171/7305 | 324/18723 | 2.89e-07 | 4.43e-06 | 171 |
| GO:19031316 | Oral cavity | OSCC | mononuclear cell differentiation | 210/7305 | 426/18723 | 8.44e-06 | 9.02e-05 | 210 |
| GO:00099139 | Oral cavity | OSCC | epidermal cell differentiation | 109/7305 | 202/18723 | 1.08e-05 | 1.14e-04 | 109 |
| GO:00072196 | Oral cavity | OSCC | Notch signaling pathway | 92/7305 | 172/18723 | 7.84e-05 | 6.08e-04 | 92 |
| GO:00300983 | Oral cavity | OSCC | lymphocyte differentiation | 179/7305 | 374/18723 | 2.74e-04 | 1.74e-03 | 179 |
| GO:00302175 | Oral cavity | OSCC | T cell differentiation | 126/7305 | 257/18723 | 6.51e-04 | 3.66e-03 | 126 |
| Page: 1 2 3 |
| Pathway ID | Tissue | Disease Stage | Description | Gene Ratio | Bg Ratio | pvalue | p.adjust | qvalue | Count |
| hsa015227 | Esophagus | ESCC | Endocrine resistance | 63/4205 | 98/8465 | 2.38e-03 | 6.58e-03 | 3.37e-03 | 63 |
| hsa043306 | Esophagus | ESCC | Notch signaling pathway | 42/4205 | 62/8465 | 2.97e-03 | 7.97e-03 | 4.08e-03 | 42 |
| hsa046585 | Esophagus | ESCC | Th1 and Th2 cell differentiation | 58/4205 | 92/8465 | 6.49e-03 | 1.60e-02 | 8.19e-03 | 58 |
| hsa0152215 | Esophagus | ESCC | Endocrine resistance | 63/4205 | 98/8465 | 2.38e-03 | 6.58e-03 | 3.37e-03 | 63 |
| hsa0433013 | Esophagus | ESCC | Notch signaling pathway | 42/4205 | 62/8465 | 2.97e-03 | 7.97e-03 | 4.08e-03 | 42 |
| hsa0465812 | Esophagus | ESCC | Th1 and Th2 cell differentiation | 58/4205 | 92/8465 | 6.49e-03 | 1.60e-02 | 8.19e-03 | 58 |
| hsa043305 | Oral cavity | OSCC | Notch signaling pathway | 44/3704 | 62/8465 | 1.26e-05 | 5.55e-05 | 2.83e-05 | 44 |
| hsa015226 | Oral cavity | OSCC | Endocrine resistance | 63/3704 | 98/8465 | 3.09e-05 | 1.31e-04 | 6.67e-05 | 63 |
| hsa046584 | Oral cavity | OSCC | Th1 and Th2 cell differentiation | 53/3704 | 92/8465 | 5.00e-03 | 1.20e-02 | 6.13e-03 | 53 |
| hsa0433012 | Oral cavity | OSCC | Notch signaling pathway | 44/3704 | 62/8465 | 1.26e-05 | 5.55e-05 | 2.83e-05 | 44 |
| hsa0152214 | Oral cavity | OSCC | Endocrine resistance | 63/3704 | 98/8465 | 3.09e-05 | 1.31e-04 | 6.67e-05 | 63 |
| hsa0465811 | Oral cavity | OSCC | Th1 and Th2 cell differentiation | 53/3704 | 92/8465 | 5.00e-03 | 1.20e-02 | 6.13e-03 | 53 |
| hsa0152221 | Prostate | Tumor | Endocrine resistance | 37/1791 | 98/8465 | 1.17e-04 | 7.42e-04 | 4.60e-04 | 37 |
| hsa043302 | Prostate | Tumor | Notch signaling pathway | 22/1791 | 62/8465 | 6.45e-03 | 2.16e-02 | 1.34e-02 | 22 |
| hsa0152231 | Prostate | Tumor | Endocrine resistance | 37/1791 | 98/8465 | 1.17e-04 | 7.42e-04 | 4.60e-04 | 37 |
| hsa043303 | Prostate | Tumor | Notch signaling pathway | 22/1791 | 62/8465 | 6.45e-03 | 2.16e-02 | 1.34e-02 | 22 |
| Page: 1 |
Top |
Cell-cell communication analysis |
| Identification of potential cell-cell interactions between two cell types and their ligand-receptor pairs for different disease states |
| Ligand | Receptor | LRpair | Pathway | Tissue | Disease Stage |
| JAG2 | NOTCH1 | JAG2_NOTCH1 | NOTCH | Cervix | CC |
| JAG2 | NOTCH2 | JAG2_NOTCH2 | NOTCH | Cervix | CC |
| JAG2 | NOTCH3 | JAG2_NOTCH3 | NOTCH | Cervix | CC |
| JAG2 | NOTCH4 | JAG2_NOTCH4 | NOTCH | Cervix | CC |
| JAG2 | NOTCH1 | JAG2_NOTCH1 | NOTCH | CRC | AD |
| JAG2 | NOTCH4 | JAG2_NOTCH4 | NOTCH | CRC | AD |
| JAG2 | NOTCH1 | JAG2_NOTCH1 | NOTCH | CRC | MSI-H |
| JAG2 | NOTCH2 | JAG2_NOTCH2 | NOTCH | CRC | MSI-H |
| JAG2 | NOTCH3 | JAG2_NOTCH3 | NOTCH | CRC | MSI-H |
| JAG2 | NOTCH4 | JAG2_NOTCH4 | NOTCH | CRC | MSI-H |
| JAG2 | NOTCH1 | JAG2_NOTCH1 | NOTCH | Endometrium | EEC |
| JAG2 | NOTCH2 | JAG2_NOTCH2 | NOTCH | Endometrium | EEC |
| JAG2 | NOTCH3 | JAG2_NOTCH3 | NOTCH | Endometrium | EEC |
| JAG2 | NOTCH4 | JAG2_NOTCH4 | NOTCH | Endometrium | EEC |
| JAG2 | NOTCH3 | JAG2_NOTCH3 | NOTCH | Endometrium | Healthy |
| JAG2 | NOTCH4 | JAG2_NOTCH4 | NOTCH | Endometrium | Healthy |
| JAG2 | NOTCH1 | JAG2_NOTCH1 | NOTCH | Esophagus | ESCC |
| JAG2 | NOTCH2 | JAG2_NOTCH2 | NOTCH | Esophagus | ESCC |
| JAG2 | NOTCH3 | JAG2_NOTCH3 | NOTCH | Esophagus | ESCC |
| JAG2 | NOTCH4 | JAG2_NOTCH4 | NOTCH | Esophagus | ESCC |
| Page: 1 2 3 4 |
Top |
Single-cell gene regulatory network inference analysis |
| Find out the significant the regulons (TFs) and the target genes of each regulon across cell types for different disease states |
| TF | Cell Type | Tissue | Disease Stage | Target Gene | RSS | Regulon Activity |
| ∗The dot plots of a searched regulon are shown for all cell subpopulations in each disease state of each tissue based on the regulon specific score inferred using pySCENIC and by calculating the average expression. |
| Page: 1 |
Top |
Somatic mutation of malignant transformation related genes |
| Annotation of somatic variants for genes involved in malignant transformation |
| Hugo Symbol | Variant Class | Variant Classification | dbSNP RS | HGVSc | HGVSp | HGVSp Short | SWISSPROT | BIOTYPE | SIFT | PolyPhen | Tumor Sample Barcode | Tissue | Histology | Sex | Age | Stage | Therapy Types | Drugs | Outcome |
| JAG2 | SNV | Missense_Mutation | rs200420004 | c.1124C>T | p.Ser375Leu | p.S375L | Q9Y219 | protein_coding | deleterious(0.03) | benign(0.045) | TCGA-A2-A0YE-01 | Breast | breast invasive carcinoma | Female | <65 | I/II | Unspecific | Taxotere | SD |
| JAG2 | SNV | Missense_Mutation | rs748620925 | c.2885N>A | p.Arg962His | p.R962H | Q9Y219 | protein_coding | tolerated(0.08) | benign(0) | TCGA-2W-A8YY-01 | Cervix | cervical & endocervical cancer | Female | <65 | I/II | Chemotherapy | cisplatin | CR |
| JAG2 | SNV | Missense_Mutation | c.1690G>A | p.Asp564Asn | p.D564N | Q9Y219 | protein_coding | tolerated(0.05) | possibly_damaging(0.628) | TCGA-DS-A1OC-01 | Cervix | cervical & endocervical cancer | Female | <65 | I/II | Chemotherapy | gemcitabine | SD | |
| JAG2 | SNV | Missense_Mutation | rs745934867 | c.3017N>A | p.Arg1006Gln | p.R1006Q | Q9Y219 | protein_coding | tolerated(0.42) | benign(0.005) | TCGA-Q1-A5R2-01 | Cervix | cervical & endocervical cancer | Female | <65 | I/II | Chemotherapy | cisplatin | PR |
| JAG2 | SNV | Missense_Mutation | novel | c.2290N>A | p.Gly764Ser | p.G764S | Q9Y219 | protein_coding | deleterious(0) | probably_damaging(0.989) | TCGA-VS-A94X-01 | Cervix | cervical & endocervical cancer | Female | <65 | I/II | Chemotherapy | cisplatin | PD |
| JAG2 | deletion | Frame_Shift_Del | novel | c.3127delC | p.Gln1043ArgfsTer327 | p.Q1043Rfs*327 | Q9Y219 | protein_coding | TCGA-VS-A8QC-01 | Cervix | cervical & endocervical cancer | Female | <65 | I/II | Chemotherapy | paclitaxel | PD | ||
| JAG2 | SNV | Missense_Mutation | rs778791847 | c.646G>A | p.Asp216Asn | p.D216N | Q9Y219 | protein_coding | deleterious(0) | probably_damaging(1) | TCGA-AA-3492-01 | Colorectum | colon adenocarcinoma | Female | >=65 | I/II | Unknown | Unknown | SD |
| JAG2 | SNV | Missense_Mutation | novel | c.1652G>A | p.Cys551Tyr | p.C551Y | Q9Y219 | protein_coding | deleterious(0) | probably_damaging(0.94) | TCGA-AA-3947-01 | Colorectum | colon adenocarcinoma | Female | <65 | I/II | Unknown | Unknown | SD |
| JAG2 | SNV | Missense_Mutation | novel | c.109N>A | p.Leu37Met | p.L37M | Q9Y219 | protein_coding | tolerated(0.66) | possibly_damaging(0.771) | TCGA-AA-A010-01 | Colorectum | colon adenocarcinoma | Female | <65 | I/II | Chemotherapy | folinic | CR |
| JAG2 | SNV | Missense_Mutation | c.462T>A | p.Asp154Glu | p.D154E | Q9Y219 | protein_coding | tolerated(0.28) | benign(0.003) | TCGA-AD-6895-01 | Colorectum | colon adenocarcinoma | Male | >=65 | III/IV | Unknown | Unknown | SD |
| Page: 1 2 3 4 5 6 7 8 9 10 |
Top |
Related drugs of malignant transformation related genes |
| Identification of chemicals and drugs interact with genes involved in malignant transfromation |
| (DGIdb 4.0) |
| Entrez ID | Symbol | Category | Interaction Types | Drug Claim Name | Drug Name | PMIDs |
| Page: 1 |

Copyright 2023-Present -The University of Texas Health Science Center at Houston |