
|
|||||
|
 | |
| |
| |
| |
| |
| |
|
Gene: JAG1 |
Gene summary for JAG1 |
| Gene information | Species | Human | Gene symbol | JAG1 | Gene ID | 182 |
| Gene name | jagged canonical Notch ligand 1 | |
| Gene Alias | AGS | |
| Cytomap | 20p12.2 | |
| Gene Type | protein-coding | GO ID | GO:0001503 | UniProtAcc | P78504 |
Top |
Malignant transformation analysis |
| Identification of the aberrant gene expression in precancerous and cancerous lesions by comparing the gene expression of stem-like cells in diseased tissues with normal stem cells |
| Entrez ID | Symbol | Replicates | Species | Organ | Tissue | Adj P-value | Log2FC | Malignancy |
| 182 | JAG1 | CA_HPV_3 | Human | Cervix | CC | 3.21e-04 | 1.67e-01 | 0.0414 |
| 182 | JAG1 | CCI_1 | Human | Cervix | CC | 6.26e-07 | 8.49e-01 | 0.528 |
| 182 | JAG1 | CCI_2 | Human | Cervix | CC | 1.46e-04 | 8.76e-01 | 0.5249 |
| 182 | JAG1 | CCI_3 | Human | Cervix | CC | 2.10e-07 | 7.77e-01 | 0.516 |
| 182 | JAG1 | Tumor | Human | Cervix | CC | 1.75e-11 | 4.58e-01 | 0.1241 |
| 182 | JAG1 | sample3 | Human | Cervix | CC | 8.78e-21 | 4.76e-01 | 0.1387 |
| 182 | JAG1 | T3 | Human | Cervix | CC | 8.88e-20 | 4.70e-01 | 0.1389 |
| 182 | JAG1 | LZE4T | Human | Esophagus | ESCC | 8.81e-17 | 4.85e-01 | 0.0811 |
| 182 | JAG1 | LZE7T | Human | Esophagus | ESCC | 9.77e-04 | -3.60e-02 | 0.0667 |
| 182 | JAG1 | LZE20T | Human | Esophagus | ESCC | 2.62e-03 | -1.74e-01 | 0.0662 |
| 182 | JAG1 | LZE22D1 | Human | Esophagus | HGIN | 1.94e-06 | -3.73e-01 | 0.0595 |
| 182 | JAG1 | LZE22T | Human | Esophagus | ESCC | 8.18e-03 | -3.03e-02 | 0.068 |
| 182 | JAG1 | LZE24T | Human | Esophagus | ESCC | 2.60e-07 | -6.88e-02 | 0.0596 |
| 182 | JAG1 | LZE21T | Human | Esophagus | ESCC | 7.70e-03 | 4.75e-01 | 0.0655 |
| 182 | JAG1 | P1T-E | Human | Esophagus | ESCC | 8.51e-04 | 5.95e-01 | 0.0875 |
| 182 | JAG1 | P2T-E | Human | Esophagus | ESCC | 9.57e-03 | 5.08e-02 | 0.1177 |
| 182 | JAG1 | P4T-E | Human | Esophagus | ESCC | 4.96e-14 | 5.88e-01 | 0.1323 |
| 182 | JAG1 | P5T-E | Human | Esophagus | ESCC | 5.46e-11 | 6.80e-01 | 0.1327 |
| 182 | JAG1 | P8T-E | Human | Esophagus | ESCC | 2.46e-13 | 2.63e-01 | 0.0889 |
| 182 | JAG1 | P9T-E | Human | Esophagus | ESCC | 2.68e-18 | 7.00e-01 | 0.1131 |
| Page: 1 2 3 4 5 6 7 |
| Tissue | Expression Dynamics | Abbreviation |
| Cervix | 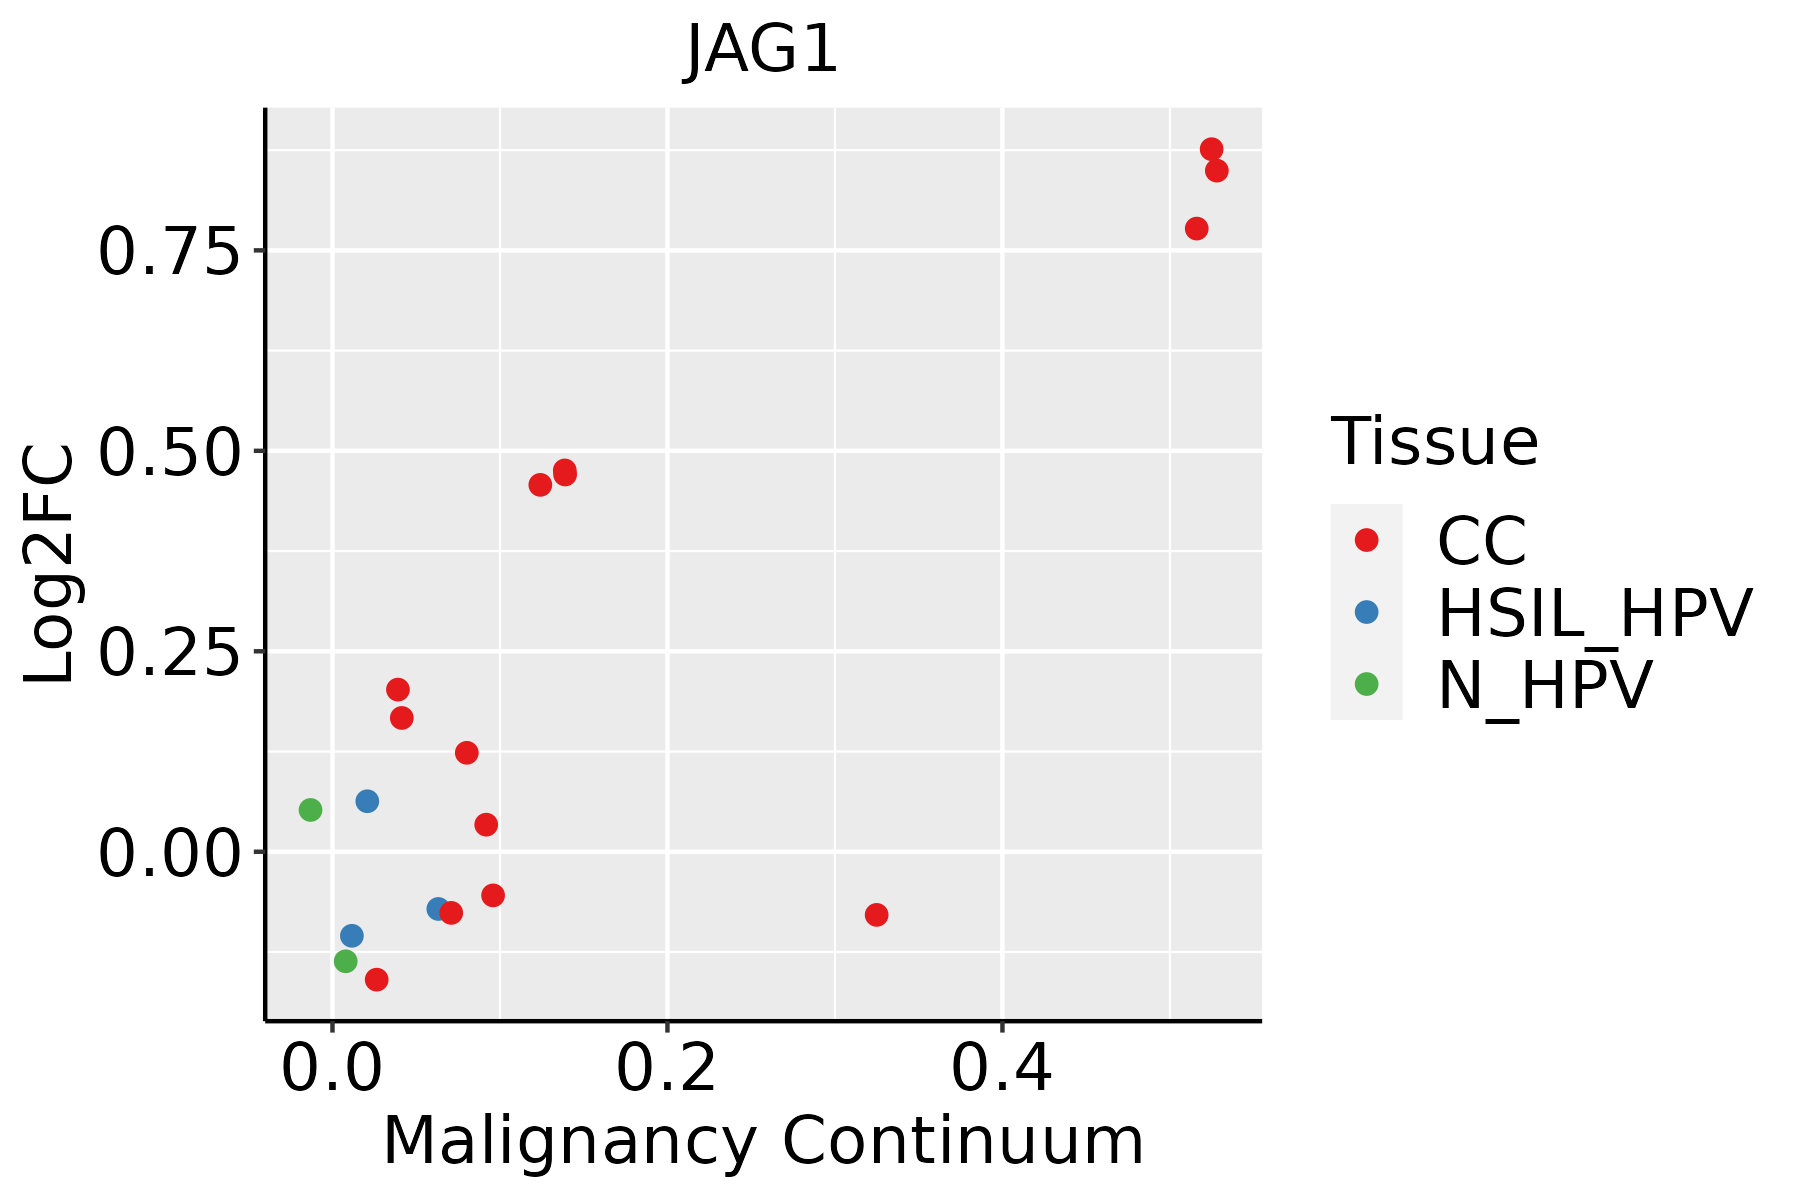 | CC: Cervix cancer |
| HSIL_HPV: HPV-infected high-grade squamous intraepithelial lesions | ||
| N_HPV: HPV-infected normal cervix | ||
| Esophagus |  | ESCC: Esophageal squamous cell carcinoma |
| HGIN: High-grade intraepithelial neoplasias | ||
| LGIN: Low-grade intraepithelial neoplasias | ||
| Liver | 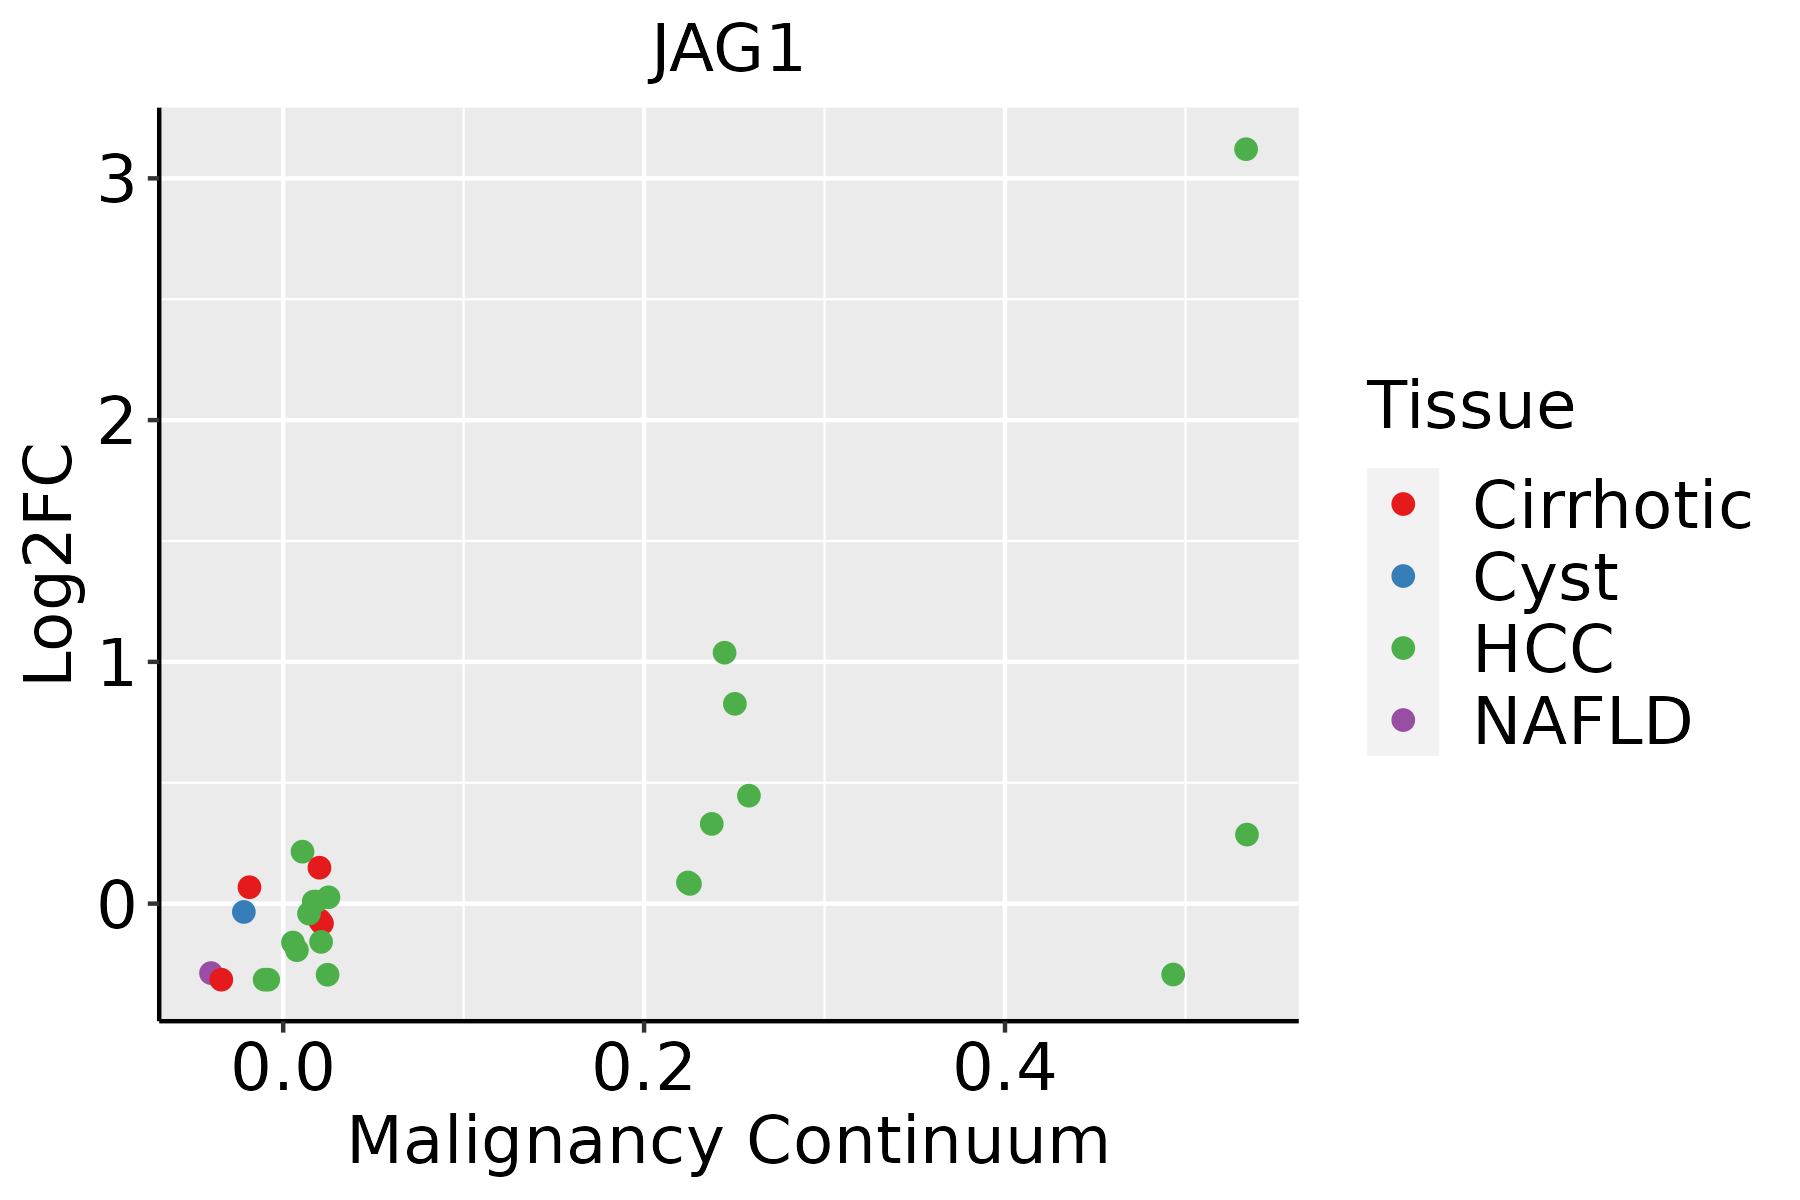 | HCC: Hepatocellular carcinoma |
| NAFLD: Non-alcoholic fatty liver disease | ||
| Oral Cavity | 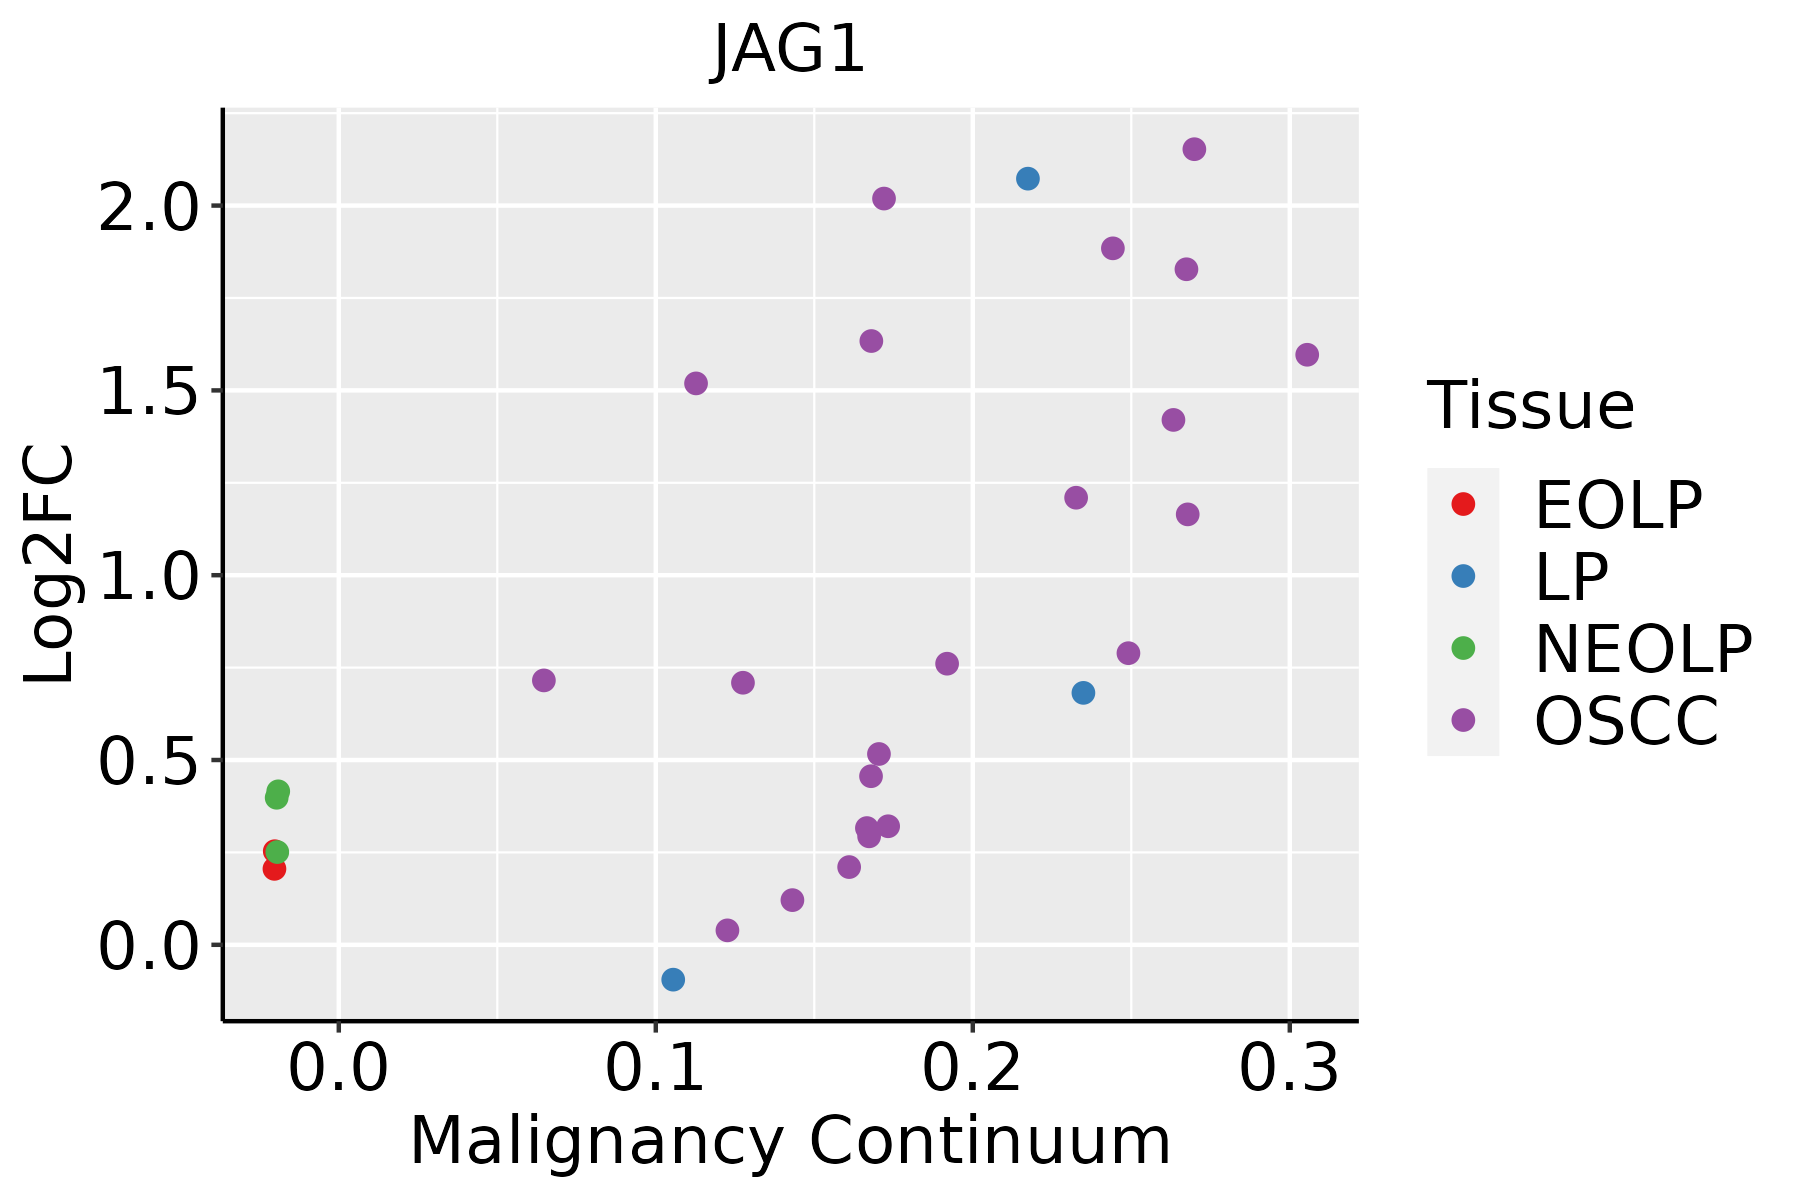 | EOLP: Erosive Oral lichen planus |
| LP: leukoplakia | ||
| NEOLP: Non-erosive oral lichen planus | ||
| OSCC: Oral squamous cell carcinoma | ||
| Prostate | 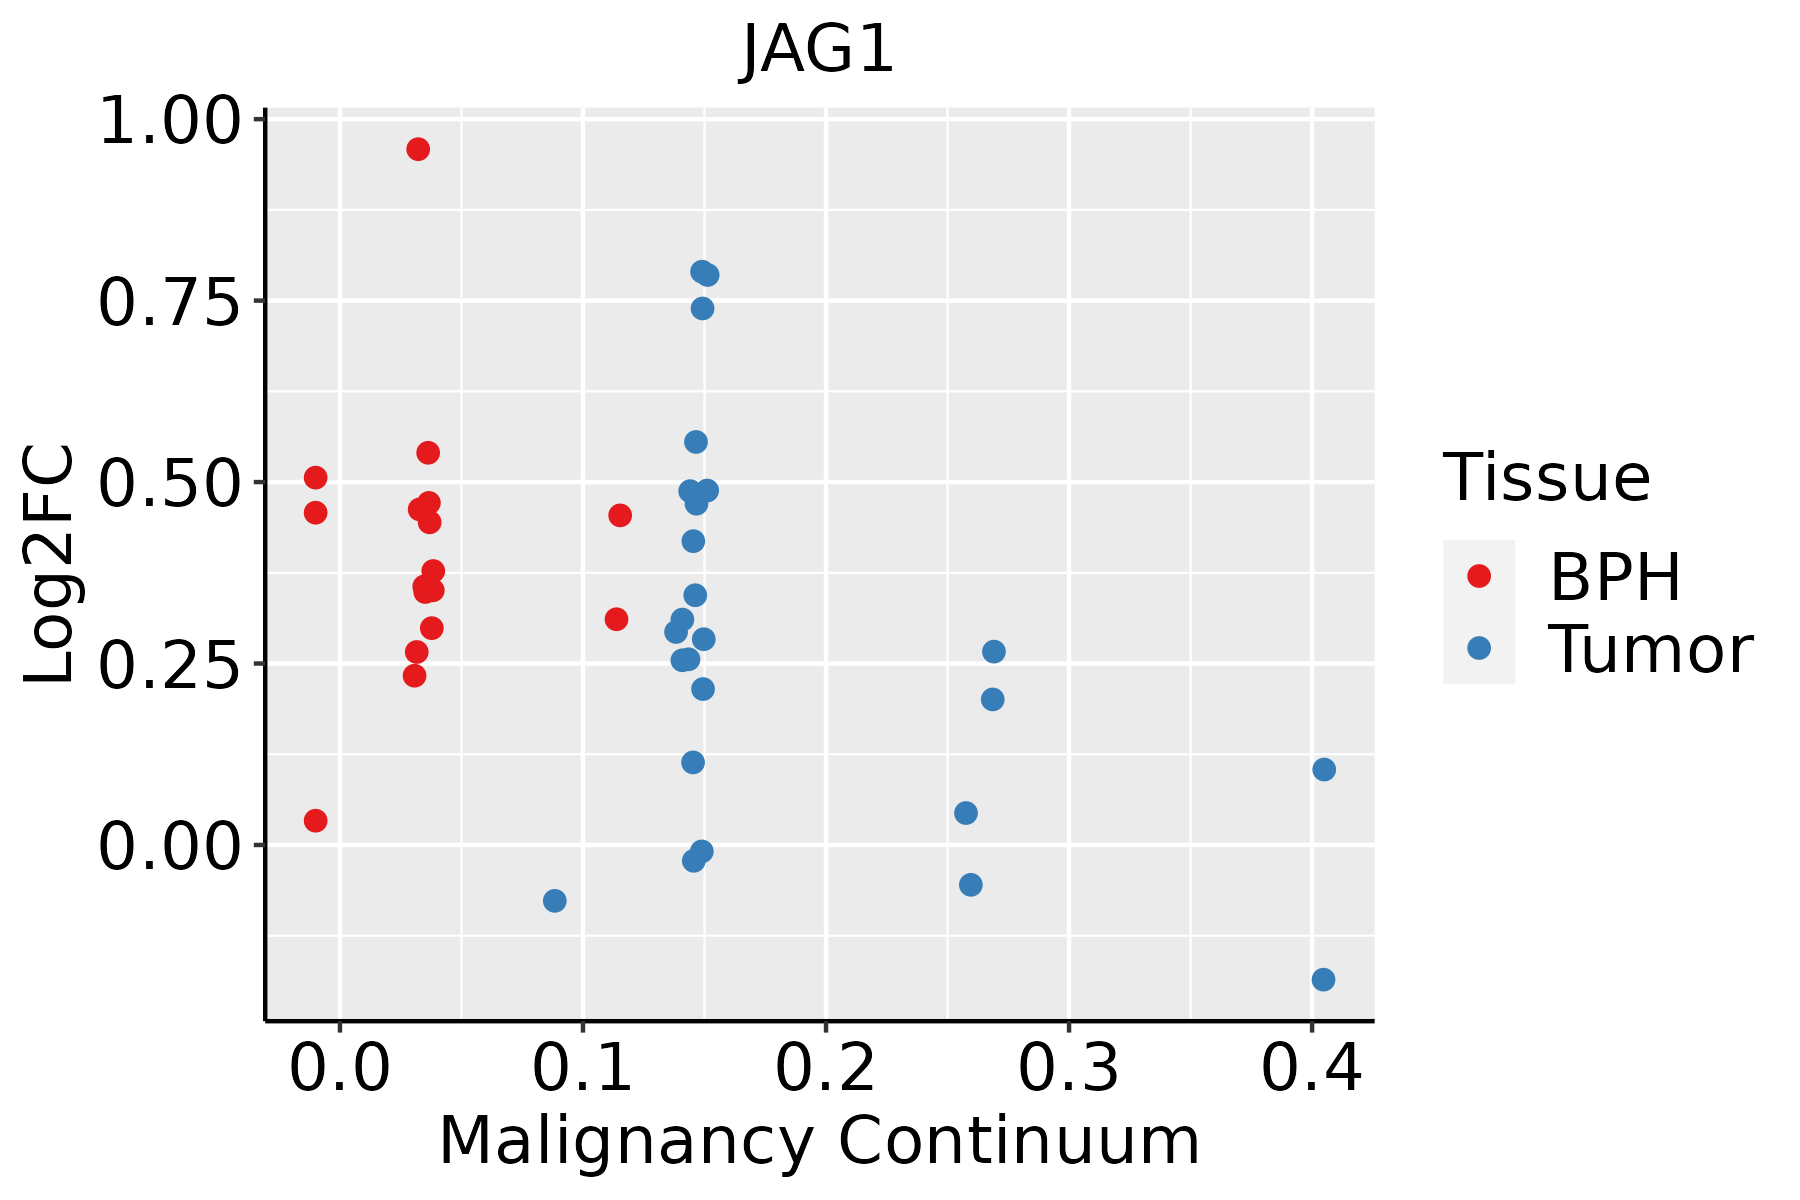 | BPH: Benign Prostatic Hyperplasia |
| Skin | 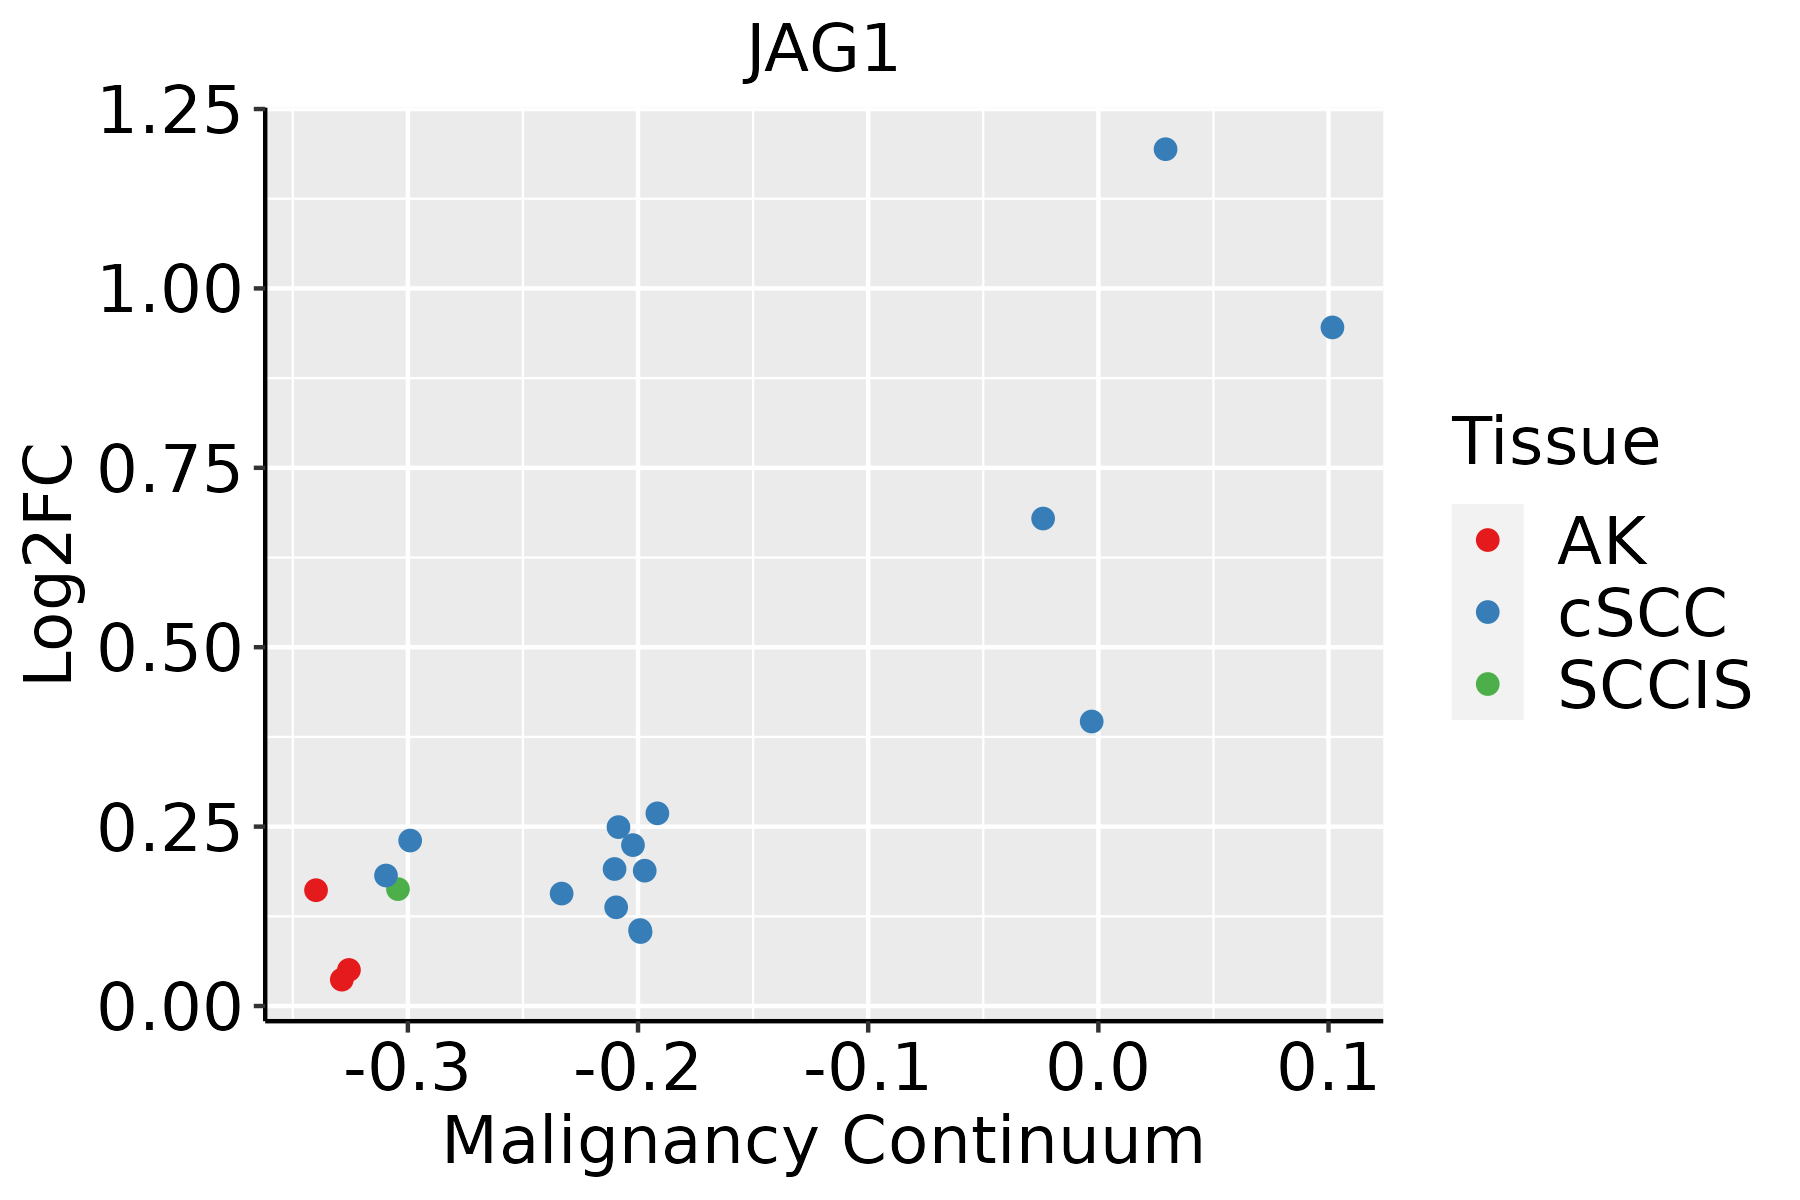 | AK: Actinic keratosis |
| cSCC: Cutaneous squamous cell carcinoma | ||
| SCCIS:squamous cell carcinoma in situ | ||
| Thyroid | 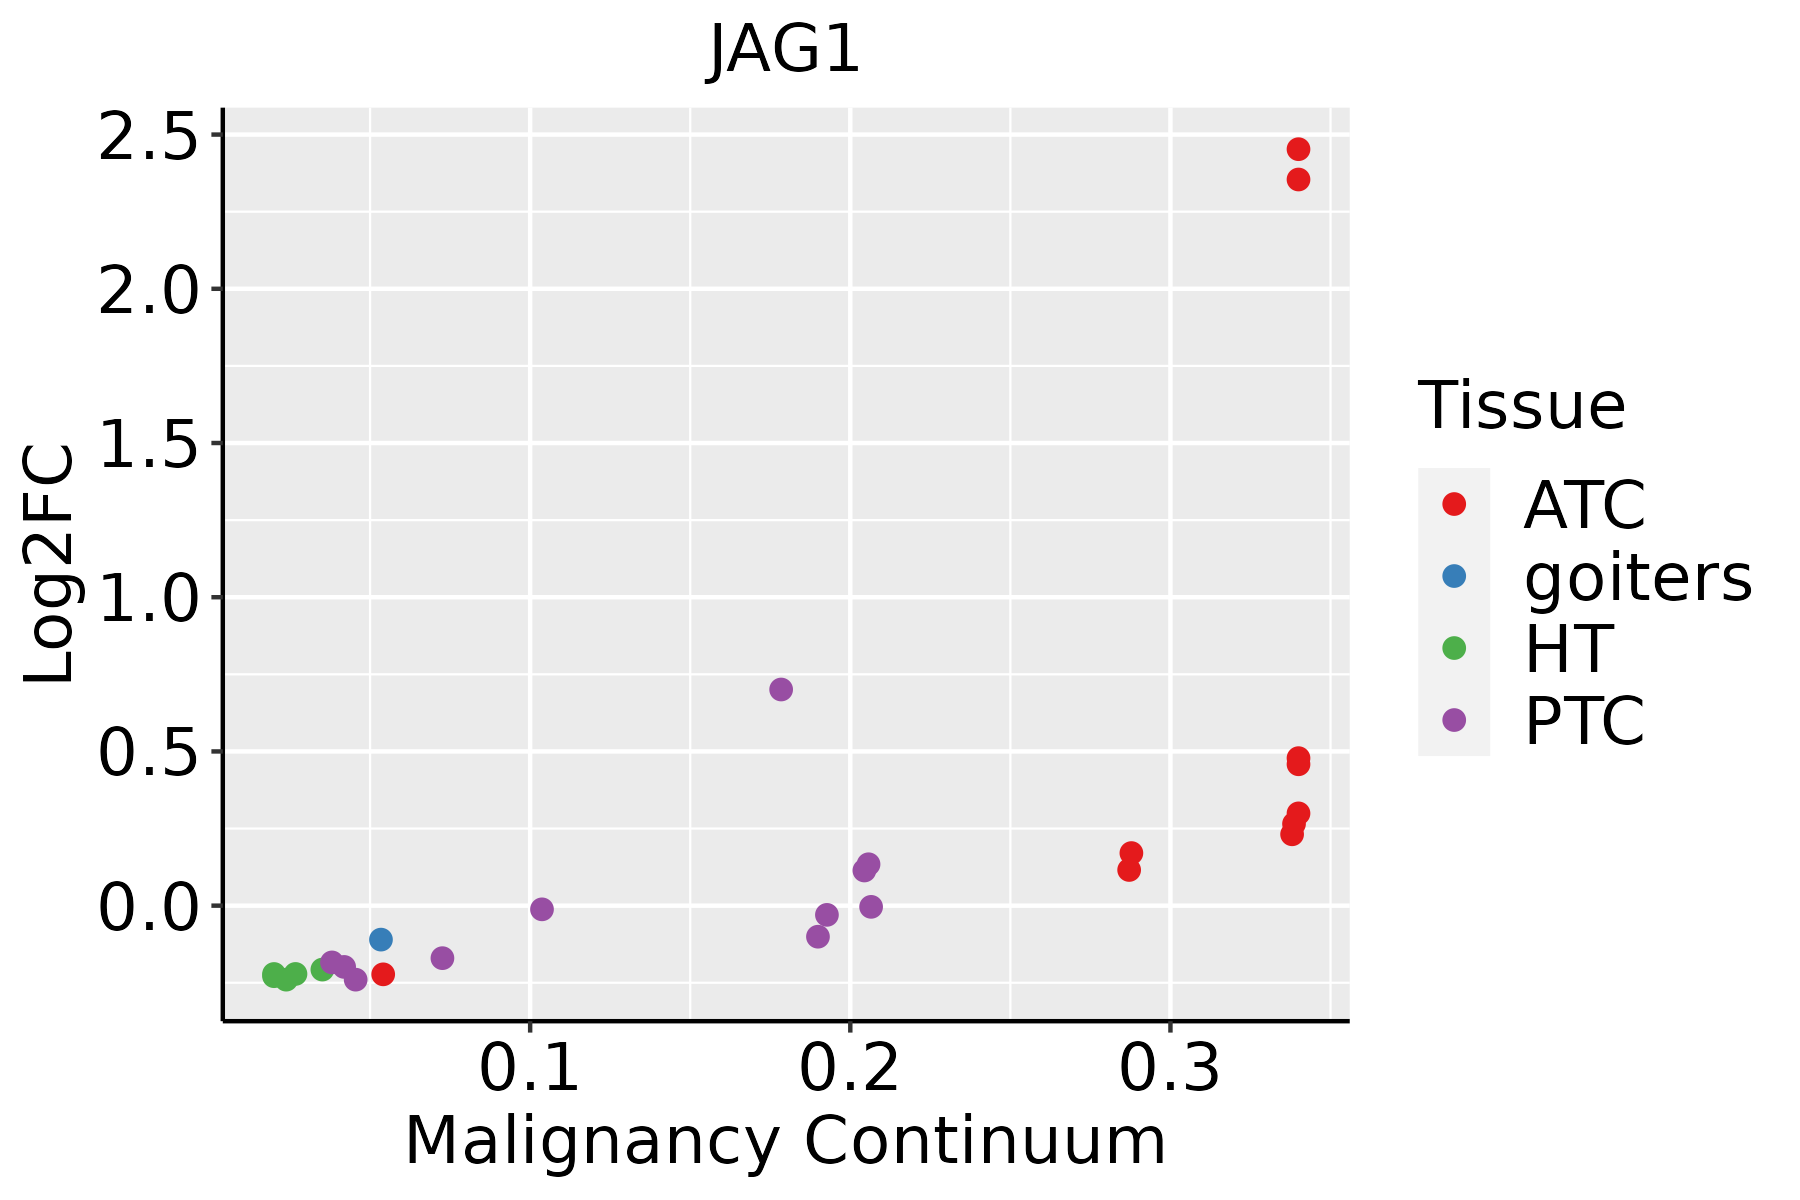 | ATC: Anaplastic thyroid cancer |
| HT: Hashimoto's thyroiditis | ||
| PTC: Papillary thyroid cancer |
| ∗log2FC in expression of this searched gene in stem-like cells from each diseased tissue sample relative to stem-like cells in normal samples in each tissue plotted against the malignancy continuum. Samples are colored based on if they are from different disease stage. |
Top |
Malignant transformation related pathway analysis |
| Find out the enriched GO biological processes and KEGG pathways involved in transition from healthy to precancer to cancer |
| Tissue | Disease Stage | Enriched GO biological Processes |
| Colorectum | AD |  |
| Colorectum | SER |  |
| Colorectum | MSS |  |
| Colorectum | MSI-H |  |
| Colorectum | FAP |  |
| ∗Top 15 enriched GO BP terms are showed in the bar plot of each disease state in each tissue. Each row represents a significant GO biological process which is colored according to the -log10(p.adjust). |
| Page: 1 2 3 4 5 6 7 8 9 |
| GO ID | Tissue | Disease Stage | Description | Gene Ratio | Bg Ratio | pvalue | p.adjust | Count |
| GO:001081010 | Cervix | CC | regulation of cell-substrate adhesion | 69/2311 | 221/18723 | 8.57e-14 | 5.69e-11 | 69 |
| GO:00315898 | Cervix | CC | cell-substrate adhesion | 96/2311 | 363/18723 | 1.48e-13 | 8.85e-11 | 96 |
| GO:00085446 | Cervix | CC | epidermis development | 83/2311 | 324/18723 | 3.91e-11 | 8.54e-09 | 83 |
| GO:00435884 | Cervix | CC | skin development | 71/2311 | 263/18723 | 8.04e-11 | 1.46e-08 | 71 |
| GO:002240710 | Cervix | CC | regulation of cell-cell adhesion | 103/2311 | 448/18723 | 1.78e-10 | 2.87e-08 | 103 |
| GO:00019528 | Cervix | CC | regulation of cell-matrix adhesion | 40/2311 | 128/18723 | 1.32e-08 | 1.04e-06 | 40 |
| GO:00071608 | Cervix | CC | cell-matrix adhesion | 60/2311 | 233/18723 | 1.58e-08 | 1.23e-06 | 60 |
| GO:00302164 | Cervix | CC | keratinocyte differentiation | 42/2311 | 139/18723 | 1.74e-08 | 1.28e-06 | 42 |
| GO:00071626 | Cervix | CC | negative regulation of cell adhesion | 72/2311 | 303/18723 | 2.36e-08 | 1.70e-06 | 72 |
| GO:00099137 | Cervix | CC | epidermal cell differentiation | 53/2311 | 202/18723 | 5.48e-08 | 3.25e-06 | 53 |
| GO:003009910 | Cervix | CC | myeloid cell differentiation | 83/2311 | 381/18723 | 1.31e-07 | 6.42e-06 | 83 |
| GO:190370610 | Cervix | CC | regulation of hemopoiesis | 80/2311 | 367/18723 | 2.14e-07 | 9.55e-06 | 80 |
| GO:00020111 | Cervix | CC | morphogenesis of an epithelial sheet | 21/2311 | 57/18723 | 1.91e-06 | 5.97e-05 | 21 |
| GO:00224084 | Cervix | CC | negative regulation of cell-cell adhesion | 48/2311 | 196/18723 | 1.99e-06 | 6.18e-05 | 48 |
| GO:00454445 | Cervix | CC | fat cell differentiation | 53/2311 | 229/18723 | 3.72e-06 | 9.75e-05 | 53 |
| GO:004563710 | Cervix | CC | regulation of myeloid cell differentiation | 48/2311 | 210/18723 | 1.49e-05 | 2.93e-04 | 48 |
| GO:00512713 | Cervix | CC | negative regulation of cellular component movement | 73/2311 | 367/18723 | 2.22e-05 | 3.95e-04 | 73 |
| GO:00400133 | Cervix | CC | negative regulation of locomotion | 76/2311 | 391/18723 | 3.47e-05 | 5.60e-04 | 76 |
| GO:20001463 | Cervix | CC | negative regulation of cell motility | 71/2311 | 359/18723 | 3.47e-05 | 5.60e-04 | 71 |
| GO:00456397 | Cervix | CC | positive regulation of myeloid cell differentiation | 28/2311 | 103/18723 | 3.56e-05 | 5.70e-04 | 28 |
| Page: 1 2 3 4 5 6 7 8 9 10 11 12 13 14 15 16 17 18 19 20 21 22 23 24 25 26 27 28 |
| Pathway ID | Tissue | Disease Stage | Description | Gene Ratio | Bg Ratio | pvalue | p.adjust | qvalue | Count |
| hsa051657 | Cervix | CC | Human papillomavirus infection | 74/1267 | 331/8465 | 1.70e-04 | 1.02e-03 | 6.03e-04 | 74 |
| hsa015223 | Cervix | CC | Endocrine resistance | 28/1267 | 98/8465 | 3.82e-04 | 1.87e-03 | 1.11e-03 | 28 |
| hsa04658 | Cervix | CC | Th1 and Th2 cell differentiation | 24/1267 | 92/8465 | 3.71e-03 | 1.34e-02 | 7.91e-03 | 24 |
| hsa046686 | Cervix | CC | TNF signaling pathway | 28/1267 | 114/8465 | 4.60e-03 | 1.62e-02 | 9.59e-03 | 28 |
| hsa04330 | Cervix | CC | Notch signaling pathway | 17/1267 | 62/8465 | 7.99e-03 | 2.56e-02 | 1.51e-02 | 17 |
| hsa05224 | Cervix | CC | Breast cancer | 32/1267 | 147/8465 | 1.66e-02 | 4.88e-02 | 2.88e-02 | 32 |
| hsa0516512 | Cervix | CC | Human papillomavirus infection | 74/1267 | 331/8465 | 1.70e-04 | 1.02e-03 | 6.03e-04 | 74 |
| hsa0152212 | Cervix | CC | Endocrine resistance | 28/1267 | 98/8465 | 3.82e-04 | 1.87e-03 | 1.11e-03 | 28 |
| hsa046581 | Cervix | CC | Th1 and Th2 cell differentiation | 24/1267 | 92/8465 | 3.71e-03 | 1.34e-02 | 7.91e-03 | 24 |
| hsa0466813 | Cervix | CC | TNF signaling pathway | 28/1267 | 114/8465 | 4.60e-03 | 1.62e-02 | 9.59e-03 | 28 |
| hsa043301 | Cervix | CC | Notch signaling pathway | 17/1267 | 62/8465 | 7.99e-03 | 2.56e-02 | 1.51e-02 | 17 |
| hsa052241 | Cervix | CC | Breast cancer | 32/1267 | 147/8465 | 1.66e-02 | 4.88e-02 | 2.88e-02 | 32 |
| hsa0466810 | Esophagus | ESCC | TNF signaling pathway | 89/4205 | 114/8465 | 3.36e-10 | 4.01e-09 | 2.06e-09 | 89 |
| hsa0516510 | Esophagus | ESCC | Human papillomavirus infection | 215/4205 | 331/8465 | 7.86e-09 | 7.12e-08 | 3.65e-08 | 215 |
| hsa015227 | Esophagus | ESCC | Endocrine resistance | 63/4205 | 98/8465 | 2.38e-03 | 6.58e-03 | 3.37e-03 | 63 |
| hsa043306 | Esophagus | ESCC | Notch signaling pathway | 42/4205 | 62/8465 | 2.97e-03 | 7.97e-03 | 4.08e-03 | 42 |
| hsa046585 | Esophagus | ESCC | Th1 and Th2 cell differentiation | 58/4205 | 92/8465 | 6.49e-03 | 1.60e-02 | 8.19e-03 | 58 |
| hsa0466817 | Esophagus | ESCC | TNF signaling pathway | 89/4205 | 114/8465 | 3.36e-10 | 4.01e-09 | 2.06e-09 | 89 |
| hsa0516515 | Esophagus | ESCC | Human papillomavirus infection | 215/4205 | 331/8465 | 7.86e-09 | 7.12e-08 | 3.65e-08 | 215 |
| hsa0152215 | Esophagus | ESCC | Endocrine resistance | 63/4205 | 98/8465 | 2.38e-03 | 6.58e-03 | 3.37e-03 | 63 |
| Page: 1 2 3 4 |
Top |
Cell-cell communication analysis |
| Identification of potential cell-cell interactions between two cell types and their ligand-receptor pairs for different disease states |
| Ligand | Receptor | LRpair | Pathway | Tissue | Disease Stage |
| CD46 | JAG1 | CD46_JAG1 | CD46 | Breast | ADJ |
| JAG1 | NOTCH2 | JAG1_NOTCH2 | NOTCH | Breast | ADJ |
| CD46 | JAG1 | CD46_JAG1 | CD46 | Breast | DCIS |
| JAG1 | NOTCH1 | JAG1_NOTCH1 | NOTCH | Breast | DCIS |
| JAG1 | NOTCH2 | JAG1_NOTCH2 | NOTCH | Breast | DCIS |
| JAG1 | NOTCH3 | JAG1_NOTCH3 | NOTCH | Breast | DCIS |
| JAG1 | NOTCH4 | JAG1_NOTCH4 | NOTCH | Breast | DCIS |
| JAG1 | NOTCH2 | JAG1_NOTCH2 | NOTCH | Breast | Healthy |
| JAG1 | NOTCH3 | JAG1_NOTCH3 | NOTCH | Breast | Healthy |
| JAG1 | NOTCH4 | JAG1_NOTCH4 | NOTCH | Breast | Healthy |
| CD46 | JAG1 | CD46_JAG1 | CD46 | Breast | Healthy |
| JAG1 | NOTCH2 | JAG1_NOTCH2 | NOTCH | Breast | IDC |
| JAG1 | NOTCH3 | JAG1_NOTCH3 | NOTCH | Breast | IDC |
| JAG1 | NOTCH4 | JAG1_NOTCH4 | NOTCH | Breast | IDC |
| CD46 | JAG1 | CD46_JAG1 | CD46 | Breast | IDC |
| CD46 | JAG1 | CD46_JAG1 | CD46 | Breast | Precancer |
| CD46 | JAG1 | CD46_JAG1 | CD46 | Cervix | CC |
| JAG1 | NOTCH1 | JAG1_NOTCH1 | NOTCH | Cervix | CC |
| JAG1 | NOTCH2 | JAG1_NOTCH2 | NOTCH | Cervix | CC |
| JAG1 | NOTCH3 | JAG1_NOTCH3 | NOTCH | Cervix | CC |
| Page: 1 2 3 4 5 6 7 |
Top |
Single-cell gene regulatory network inference analysis |
| Find out the significant the regulons (TFs) and the target genes of each regulon across cell types for different disease states |
| TF | Cell Type | Tissue | Disease Stage | Target Gene | RSS | Regulon Activity |
| ∗The dot plots of a searched regulon are shown for all cell subpopulations in each disease state of each tissue based on the regulon specific score inferred using pySCENIC and by calculating the average expression. |
| Page: 1 |
Top |
Somatic mutation of malignant transformation related genes |
| Annotation of somatic variants for genes involved in malignant transformation |
| Hugo Symbol | Variant Class | Variant Classification | dbSNP RS | HGVSc | HGVSp | HGVSp Short | SWISSPROT | BIOTYPE | SIFT | PolyPhen | Tumor Sample Barcode | Tissue | Histology | Sex | Age | Stage | Therapy Types | Drugs | Outcome |
| JAG1 | SNV | Missense_Mutation | novel | c.2958N>C | p.Leu986Phe | p.L986F | P78504 | protein_coding | tolerated(0.06) | probably_damaging(0.931) | TCGA-A2-A3XT-01 | Breast | breast invasive carcinoma | Female | <65 | I/II | Chemotherapy | cyclophosphamide | PR |
| JAG1 | SNV | Missense_Mutation | novel | c.3242N>T | p.Trp1081Leu | p.W1081L | P78504 | protein_coding | tolerated(0.08) | benign(0.224) | TCGA-A8-A06R-01 | Breast | breast invasive carcinoma | Female | >=65 | I/II | Chemotherapy | 5-fluorouracil | CR |
| JAG1 | SNV | Missense_Mutation | c.2368N>A | p.Pro790Thr | p.P790T | P78504 | protein_coding | deleterious(0) | probably_damaging(0.998) | TCGA-A8-A097-01 | Breast | breast invasive carcinoma | Female | >=65 | I/II | Hormone Therapy | tamoxiphen | SD | |
| JAG1 | SNV | Missense_Mutation | c.1544N>T | p.Thr515Ile | p.T515I | P78504 | protein_coding | tolerated(0.16) | benign(0.066) | TCGA-AN-A03X-01 | Breast | breast invasive carcinoma | Female | >=65 | I/II | Unknown | Unknown | SD | |
| JAG1 | SNV | Missense_Mutation | novel | c.3242N>T | p.Trp1081Leu | p.W1081L | P78504 | protein_coding | tolerated(0.08) | benign(0.224) | TCGA-BH-A0BS-01 | Breast | breast invasive carcinoma | Female | <65 | III/IV | Chemotherapy | adriamycin | CR |
| JAG1 | SNV | Missense_Mutation | c.947G>A | p.Gly316Asp | p.G316D | P78504 | protein_coding | tolerated(0.36) | benign(0.423) | TCGA-D8-A1J8-01 | Breast | breast invasive carcinoma | Female | >=65 | I/II | Hormone Therapy | nolvadex | SD | |
| JAG1 | SNV | Missense_Mutation | rs750239030 | c.3050N>T | p.Ser1017Phe | p.S1017F | P78504 | protein_coding | deleterious(0) | possibly_damaging(0.635) | TCGA-D8-A27G-01 | Breast | breast invasive carcinoma | Female | >=65 | I/II | Unknown | Unknown | SD |
| JAG1 | SNV | Missense_Mutation | novel | c.3242G>T | p.Trp1081Leu | p.W1081L | P78504 | protein_coding | tolerated(0.08) | benign(0.224) | TCGA-E2-A14Q-01 | Breast | breast invasive carcinoma | Female | <65 | I/II | Hormone Therapy | tamoxiphen | SD |
| JAG1 | SNV | Missense_Mutation | novel | c.3242N>T | p.Trp1081Leu | p.W1081L | P78504 | protein_coding | tolerated(0.08) | benign(0.224) | TCGA-E2-A1B1-01 | Breast | breast invasive carcinoma | Female | <65 | I/II | Other, specify in notesbiphosphonate | zoledronic | SD |
| JAG1 | SNV | Missense_Mutation | novel | c.3242G>T | p.Trp1081Leu | p.W1081L | P78504 | protein_coding | tolerated(0.08) | benign(0.224) | TCGA-E9-A1R5-01 | Breast | breast invasive carcinoma | Female | <65 | I/II | Hormone Therapy | tamoxiphen | SD |
| Page: 1 2 3 4 5 6 7 8 9 10 11 12 13 14 |
Top |
Related drugs of malignant transformation related genes |
| Identification of chemicals and drugs interact with genes involved in malignant transfromation |
| (DGIdb 4.0) |
| Entrez ID | Symbol | Category | Interaction Types | Drug Claim Name | Drug Name | PMIDs |
| 182 | JAG1 | DRUGGABLE GENOME, G PROTEIN COUPLED RECEPTOR, GROWTH FACTOR | CORTISOL | HYDROCORTISONE | 11948681 |
| Page: 1 |

Copyright 2023-Present -The University of Texas Health Science Center at Houston |