
|
|||||
|
 | |
| |
| |
| |
| |
| |
|
Gene: IYD |
Gene summary for IYD |
| Gene information | Species | Human | Gene symbol | IYD | Gene ID | 389434 |
| Gene name | iodotyrosine deiodinase | |
| Gene Alias | C6orf71 | |
| Cytomap | 6q25.1 | |
| Gene Type | protein-coding | GO ID | GO:0006082 | UniProtAcc | Q6PHW0 |
Top |
Malignant transformation analysis |
| Identification of the aberrant gene expression in precancerous and cancerous lesions by comparing the gene expression of stem-like cells in diseased tissues with normal stem cells |
| Entrez ID | Symbol | Replicates | Species | Organ | Tissue | Adj P-value | Log2FC | Malignancy |
| 389434 | IYD | Adj_PTCwithHT_6 | Human | Thyroid | HT | 5.67e-56 | -1.44e+00 | 0.02 |
| 389434 | IYD | Adj_PTCwithHT_8 | Human | Thyroid | HT | 2.16e-12 | -7.67e-01 | 0.0267 |
| 389434 | IYD | PTCwithHT_1 | Human | Thyroid | HT | 3.66e-19 | -1.39e+00 | 0.0238 |
| 389434 | IYD | PTCwithHT_6 | Human | Thyroid | HT | 1.35e-42 | -1.39e+00 | 0.02 |
| 389434 | IYD | PTCwithHT_8 | Human | Thyroid | HT | 1.69e-52 | -1.40e+00 | 0.0351 |
| 389434 | IYD | PTCwithoutHT_2 | Human | Thyroid | PTC | 7.62e-39 | -1.26e+00 | 0.0419 |
| 389434 | IYD | PTCwithoutHT_4_2 | Human | Thyroid | PTC | 1.01e-03 | -9.18e-01 | 0.0455 |
| 389434 | IYD | PTCwithoutHT_7 | Human | Thyroid | PTC | 3.57e-19 | -1.40e+00 | 0.0381 |
| 389434 | IYD | male-WTA | Human | Thyroid | PTC | 3.71e-43 | -4.10e-01 | 0.1037 |
| 389434 | IYD | female-WTA | Human | Thyroid | PTC | 7.48e-03 | -6.61e-01 | 0.0726 |
| 389434 | IYD | PTC01 | Human | Thyroid | PTC | 8.82e-17 | -7.32e-01 | 0.1899 |
| 389434 | IYD | PTC04 | Human | Thyroid | PTC | 1.08e-27 | -1.06e+00 | 0.1927 |
| 389434 | IYD | PTC06 | Human | Thyroid | PTC | 8.72e-06 | -6.26e-01 | 0.2057 |
| 389434 | IYD | ATC08 | Human | Thyroid | ATC | 2.23e-17 | -1.09e+00 | 0.0541 |
| 389434 | IYD | ATC09 | Human | Thyroid | ATC | 1.23e-22 | -1.43e+00 | 0.2871 |
| 389434 | IYD | ATC11 | Human | Thyroid | ATC | 1.39e-06 | -1.44e+00 | 0.3386 |
| 389434 | IYD | ATC12 | Human | Thyroid | ATC | 1.89e-58 | -1.44e+00 | 0.34 |
| 389434 | IYD | ATC13 | Human | Thyroid | ATC | 1.18e-51 | -1.43e+00 | 0.34 |
| 389434 | IYD | ATC1 | Human | Thyroid | ATC | 2.71e-19 | -1.42e+00 | 0.2878 |
| 389434 | IYD | ATC2 | Human | Thyroid | ATC | 1.39e-06 | -1.44e+00 | 0.34 |
| Page: 1 2 |
| Tissue | Expression Dynamics | Abbreviation |
| Thyroid | 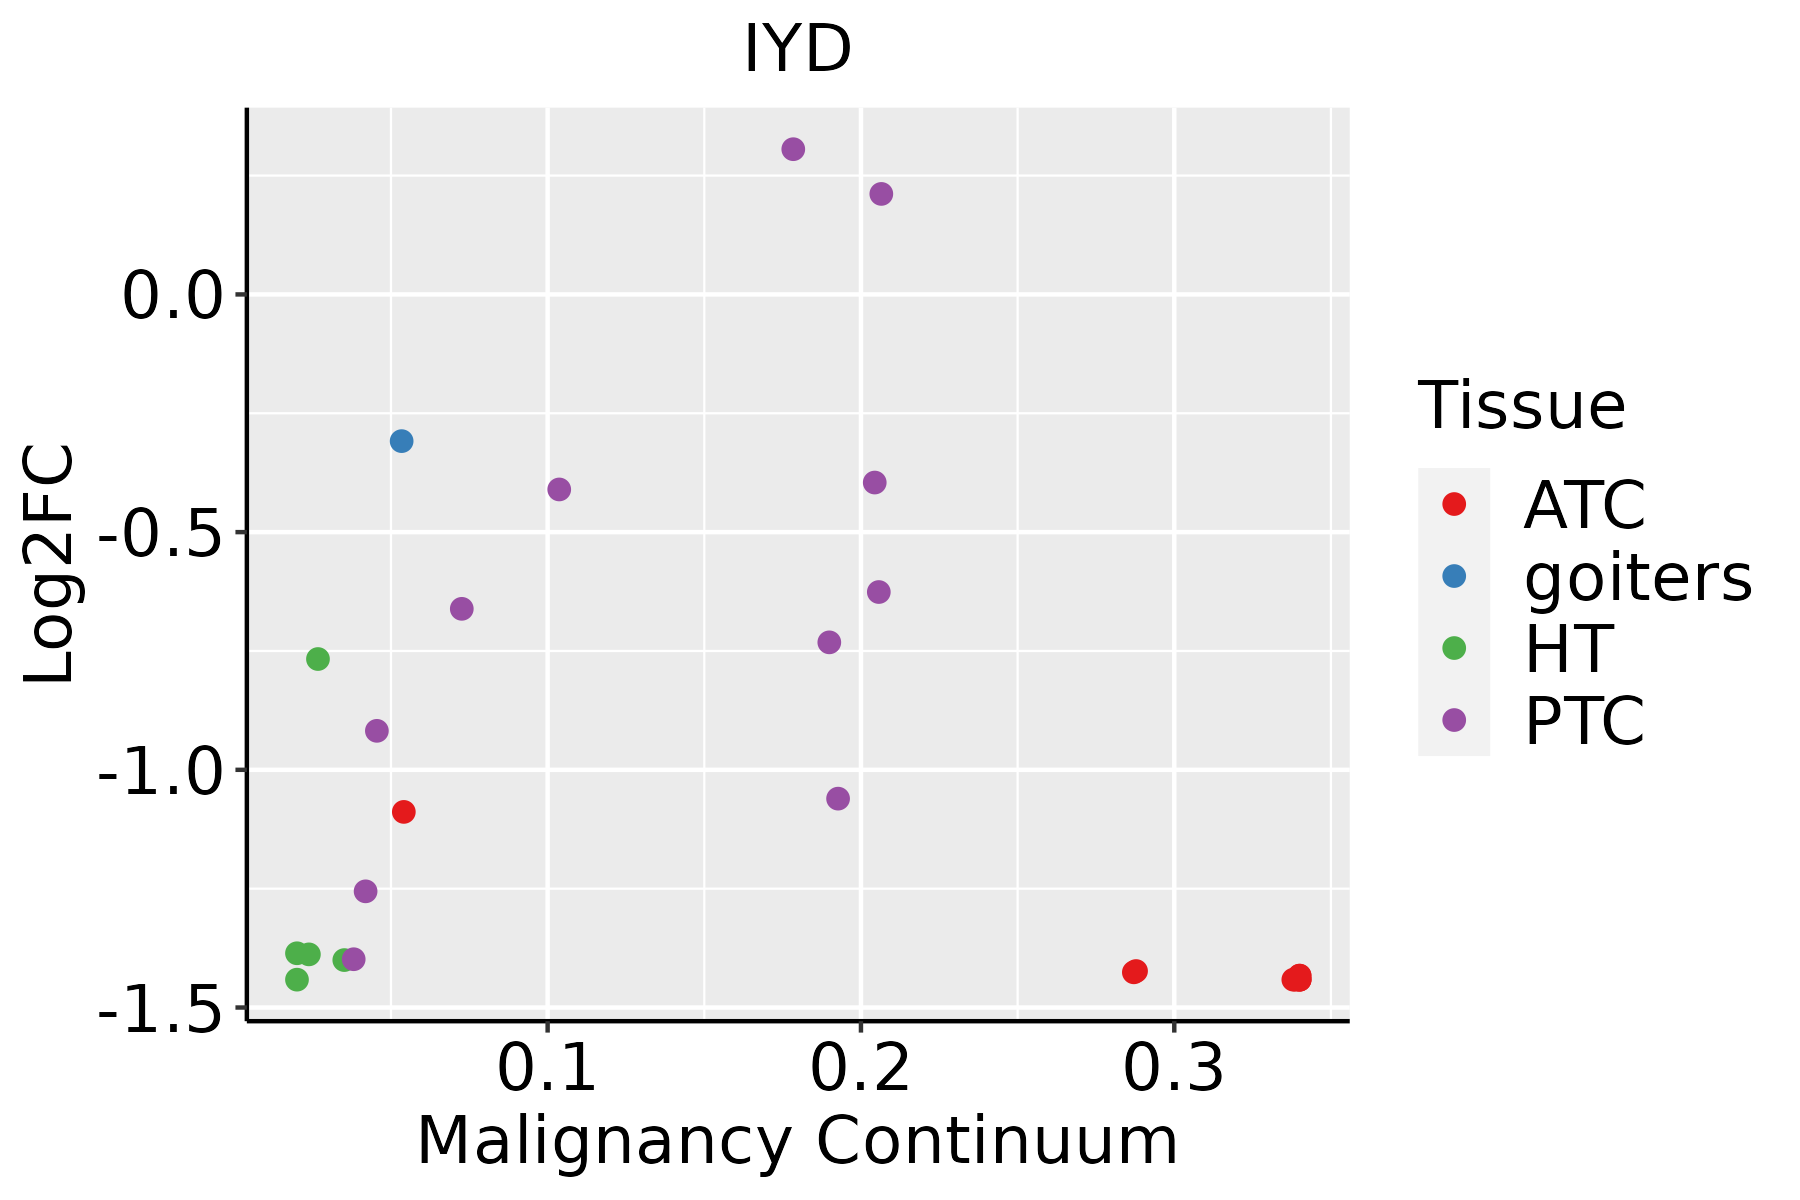 | ATC: Anaplastic thyroid cancer |
| HT: Hashimoto's thyroiditis | ||
| PTC: Papillary thyroid cancer |
| ∗log2FC in expression of this searched gene in stem-like cells from each diseased tissue sample relative to stem-like cells in normal samples in each tissue plotted against the malignancy continuum. Samples are colored based on if they are from different disease stage. |
Top |
Malignant transformation related pathway analysis |
| Find out the enriched GO biological processes and KEGG pathways involved in transition from healthy to precancer to cancer |
| Tissue | Disease Stage | Enriched GO biological Processes |
| Colorectum | AD |  |
| Colorectum | SER |  |
| Colorectum | MSS |  |
| Colorectum | MSI-H |  |
| Colorectum | FAP |  |
| ∗Top 15 enriched GO BP terms are showed in the bar plot of each disease state in each tissue. Each row represents a significant GO biological process which is colored according to the -log10(p.adjust). |
| Page: 1 2 3 4 5 6 7 8 9 |
| GO ID | Tissue | Disease Stage | Description | Gene Ratio | Bg Ratio | pvalue | p.adjust | Count |
| GO:00065759 | Thyroid | HT | cellular modified amino acid metabolic process | 28/1272 | 188/18723 | 7.21e-05 | 1.31e-03 | 28 |
| GO:0042403 | Thyroid | HT | thyroid hormone metabolic process | 8/1272 | 27/18723 | 3.07e-04 | 4.08e-03 | 8 |
| GO:000657513 | Thyroid | PTC | cellular modified amino acid metabolic process | 85/5968 | 188/18723 | 8.29e-05 | 7.01e-04 | 85 |
| GO:00424031 | Thyroid | PTC | thyroid hormone metabolic process | 15/5968 | 27/18723 | 9.19e-03 | 3.79e-02 | 15 |
| GO:000657522 | Thyroid | ATC | cellular modified amino acid metabolic process | 82/6293 | 188/18723 | 2.60e-03 | 1.20e-02 | 82 |
| Page: 1 |
| Pathway ID | Tissue | Disease Stage | Description | Gene Ratio | Bg Ratio | pvalue | p.adjust | qvalue | Count |
| Page: 1 |
Top |
Cell-cell communication analysis |
| Identification of potential cell-cell interactions between two cell types and their ligand-receptor pairs for different disease states |
| Ligand | Receptor | LRpair | Pathway | Tissue | Disease Stage |
| Page: 1 |
Top |
Single-cell gene regulatory network inference analysis |
| Find out the significant the regulons (TFs) and the target genes of each regulon across cell types for different disease states |
| TF | Cell Type | Tissue | Disease Stage | Target Gene | RSS | Regulon Activity |
| ∗The dot plots of a searched regulon are shown for all cell subpopulations in each disease state of each tissue based on the regulon specific score inferred using pySCENIC and by calculating the average expression. |
| Page: 1 |
Top |
Somatic mutation of malignant transformation related genes |
| Annotation of somatic variants for genes involved in malignant transformation |
| Hugo Symbol | Variant Class | Variant Classification | dbSNP RS | HGVSc | HGVSp | HGVSp Short | SWISSPROT | BIOTYPE | SIFT | PolyPhen | Tumor Sample Barcode | Tissue | Histology | Sex | Age | Stage | Therapy Types | Drugs | Outcome |
| IYD | SNV | Missense_Mutation | rs121918138 | c.301C>T | p.Arg101Trp | p.R101W | Q6PHW0 | protein_coding | deleterious(0) | probably_damaging(1) | TCGA-BH-A0C7-01 | Breast | breast invasive carcinoma | Female | <65 | I/II | Chemotherapy | adriamycin | CR |
| IYD | insertion | In_Frame_Ins | novel | c.448_449insACCCGGGCTGGA | p.Ile149_Arg150insHisProGlyTrp | p.I149_R150insHPGW | Q6PHW0 | protein_coding | TCGA-AN-A0FX-01 | Breast | breast invasive carcinoma | Female | <65 | I/II | Unknown | Unknown | SD | ||
| IYD | deletion | Frame_Shift_Del | novel | c.32delN | p.Leu12SerfsTer37 | p.L12Sfs*37 | Q6PHW0 | protein_coding | TCGA-D8-A27V-01 | Breast | breast invasive carcinoma | Female | <65 | I/II | Hormone Therapy | tamoxiphen | SD | ||
| IYD | insertion | Nonsense_Mutation | novel | c.716_717insTTTCAGCTGAGTTTTCAATTCAGGGACATTTG | p.Gln239HisfsTer4 | p.Q239Hfs*4 | Q6PHW0 | protein_coding | TCGA-E9-A1NC-01 | Breast | breast invasive carcinoma | Female | <65 | I/II | Chemotherapy | doxorubicin | CR | ||
| IYD | SNV | Missense_Mutation | c.82G>C | p.Glu28Gln | p.E28Q | Q6PHW0 | protein_coding | tolerated(0.23) | benign(0.107) | TCGA-IR-A3LK-01 | Cervix | cervical & endocervical cancer | Female | >=65 | I/II | Chemotherapy | cisplatin | PD | |
| IYD | SNV | Missense_Mutation | c.84N>T | p.Glu28Asp | p.E28D | Q6PHW0 | protein_coding | tolerated(0.22) | benign(0.001) | TCGA-AA-3510-01 | Colorectum | colon adenocarcinoma | Male | >=65 | I/II | Unknown | Unknown | SD | |
| IYD | SNV | Missense_Mutation | c.522G>T | p.Lys174Asn | p.K174N | Q6PHW0 | protein_coding | deleterious(0.01) | possibly_damaging(0.815) | TCGA-AA-3977-01 | Colorectum | colon adenocarcinoma | Male | >=65 | I/II | Unknown | Unknown | SD | |
| IYD | SNV | Missense_Mutation | novel | c.197N>C | p.Glu66Ala | p.E66A | Q6PHW0 | protein_coding | tolerated(0.48) | benign(0.077) | TCGA-AA-3984-01 | Colorectum | colon adenocarcinoma | Female | <65 | I/II | Unknown | Unknown | SD |
| IYD | SNV | Missense_Mutation | rs376472194 | c.115G>A | p.Glu39Lys | p.E39K | Q6PHW0 | protein_coding | tolerated(0.33) | benign(0.001) | TCGA-AA-A00N-01 | Colorectum | colon adenocarcinoma | Male | >=65 | I/II | Unknown | Unknown | PD |
| IYD | SNV | Missense_Mutation | rs370872496 | c.122G>A | p.Arg41His | p.R41H | Q6PHW0 | protein_coding | tolerated(0.13) | possibly_damaging(0.719) | TCGA-AA-A024-01 | Colorectum | colon adenocarcinoma | Male | >=65 | I/II | Unknown | Unknown | SD |
| Page: 1 2 3 4 |
Top |
Related drugs of malignant transformation related genes |
| Identification of chemicals and drugs interact with genes involved in malignant transfromation |
| (DGIdb 4.0) |
| Entrez ID | Symbol | Category | Interaction Types | Drug Claim Name | Drug Name | PMIDs |
| Page: 1 |

Copyright 2023-Present -The University of Texas Health Science Center at Houston |