Schematic overview of the cellular and molecular mechanisms involved in the cancer progression, including the proposed cellular and molecular mechanisms in cancer cells trajectory. AT1: alveolar type 1 cells; AT2: alveolar type 2 cells; AAH: atypical adenomatous hyperplasia; AIS: adenocarcinoma in situ; MIA: minimally invasive adenocarcinoma; IA: invasive adenocarcinoma; EMT: epithelial-mesenchymal transition

Home

Download

Statistics

Help

Contact

Center for Computational Systems Medicine
leaf

Gene summary

leaf

Malignant transformation analysis

leaf

Malignant transformation related pathway analysis

leaf

Cell-cell communication analysis

leaf

Single-cell gene regulatory network inference analysis

leaf

Somatic mutation of malignant transformation related genes

leaf

Related drugs of malignant transformation related genes

Gene: IVNS1ABP

Gene summary for IVNS1ABP

check button Gene summary.

Gene informationSpeciesHuman
Gene symbol

IVNS1ABP

Gene ID

10625

Gene nameinfluenza virus NS1A binding protein
Gene AliasARA3
Cytomap1q25.3
Gene Typeprotein-coding
GO ID

GO:0006139

UniProtAcc

Q9Y6Y0


Top

Malignant transformation analysis

check button Identification of the aberrant gene expression in precancerous and cancerous lesions by comparing the gene expression of stem-like cells in diseased tissues with normal stem cells
check button Malignant transformation involving gene list.
Entrez IDSymbolReplicatesSpeciesOrganTissueAdj P-valueLog2FCMalignancy
10625IVNS1ABPLZE4THumanEsophagusESCC2.73e-075.15e-010.0811
10625IVNS1ABPLZE5THumanEsophagusESCC4.37e-02-1.96e-010.0514
10625IVNS1ABPLZE7THumanEsophagusESCC7.73e-131.76e+000.0667
10625IVNS1ABPLZE8THumanEsophagusESCC3.95e-061.18e-010.067
10625IVNS1ABPLZE24THumanEsophagusESCC3.45e-076.14e-010.0596
10625IVNS1ABPP1T-EHumanEsophagusESCC3.86e-077.02e-010.0875
10625IVNS1ABPP2T-EHumanEsophagusESCC4.82e-143.87e-010.1177
10625IVNS1ABPP4T-EHumanEsophagusESCC7.71e-073.51e-010.1323
10625IVNS1ABPP5T-EHumanEsophagusESCC1.30e-052.92e-010.1327
10625IVNS1ABPP8T-EHumanEsophagusESCC3.99e-092.47e-010.0889
10625IVNS1ABPP9T-EHumanEsophagusESCC6.83e-146.51e-010.1131
10625IVNS1ABPP10T-EHumanEsophagusESCC3.67e-195.01e-010.116
10625IVNS1ABPP11T-EHumanEsophagusESCC2.02e-132.22e+000.1426
10625IVNS1ABPP12T-EHumanEsophagusESCC1.92e-218.00e-010.1122
10625IVNS1ABPP15T-EHumanEsophagusESCC3.69e-321.08e+000.1149
10625IVNS1ABPP16T-EHumanEsophagusESCC2.61e-227.56e-010.1153
10625IVNS1ABPP20T-EHumanEsophagusESCC1.49e-146.74e-010.1124
10625IVNS1ABPP21T-EHumanEsophagusESCC6.73e-217.39e-010.1617
10625IVNS1ABPP22T-EHumanEsophagusESCC5.59e-106.44e-020.1236
10625IVNS1ABPP23T-EHumanEsophagusESCC2.92e-206.34e-010.108
Page: 1 2 3 4 5 6 

check button Transcriptomic changes along malignancy continuum.
TissueExpression DynamicsAbbreviation
EsophagusThe image shows the transcriptomic changes along malignancy continuum.log2FC in expression of this searched gene in stem-like cells from each diseased tissue sample relative to stem-like cells in normal samples in each tissue plotted against the malignancy continuum. Samples are colored based on if they are from different disease stage.
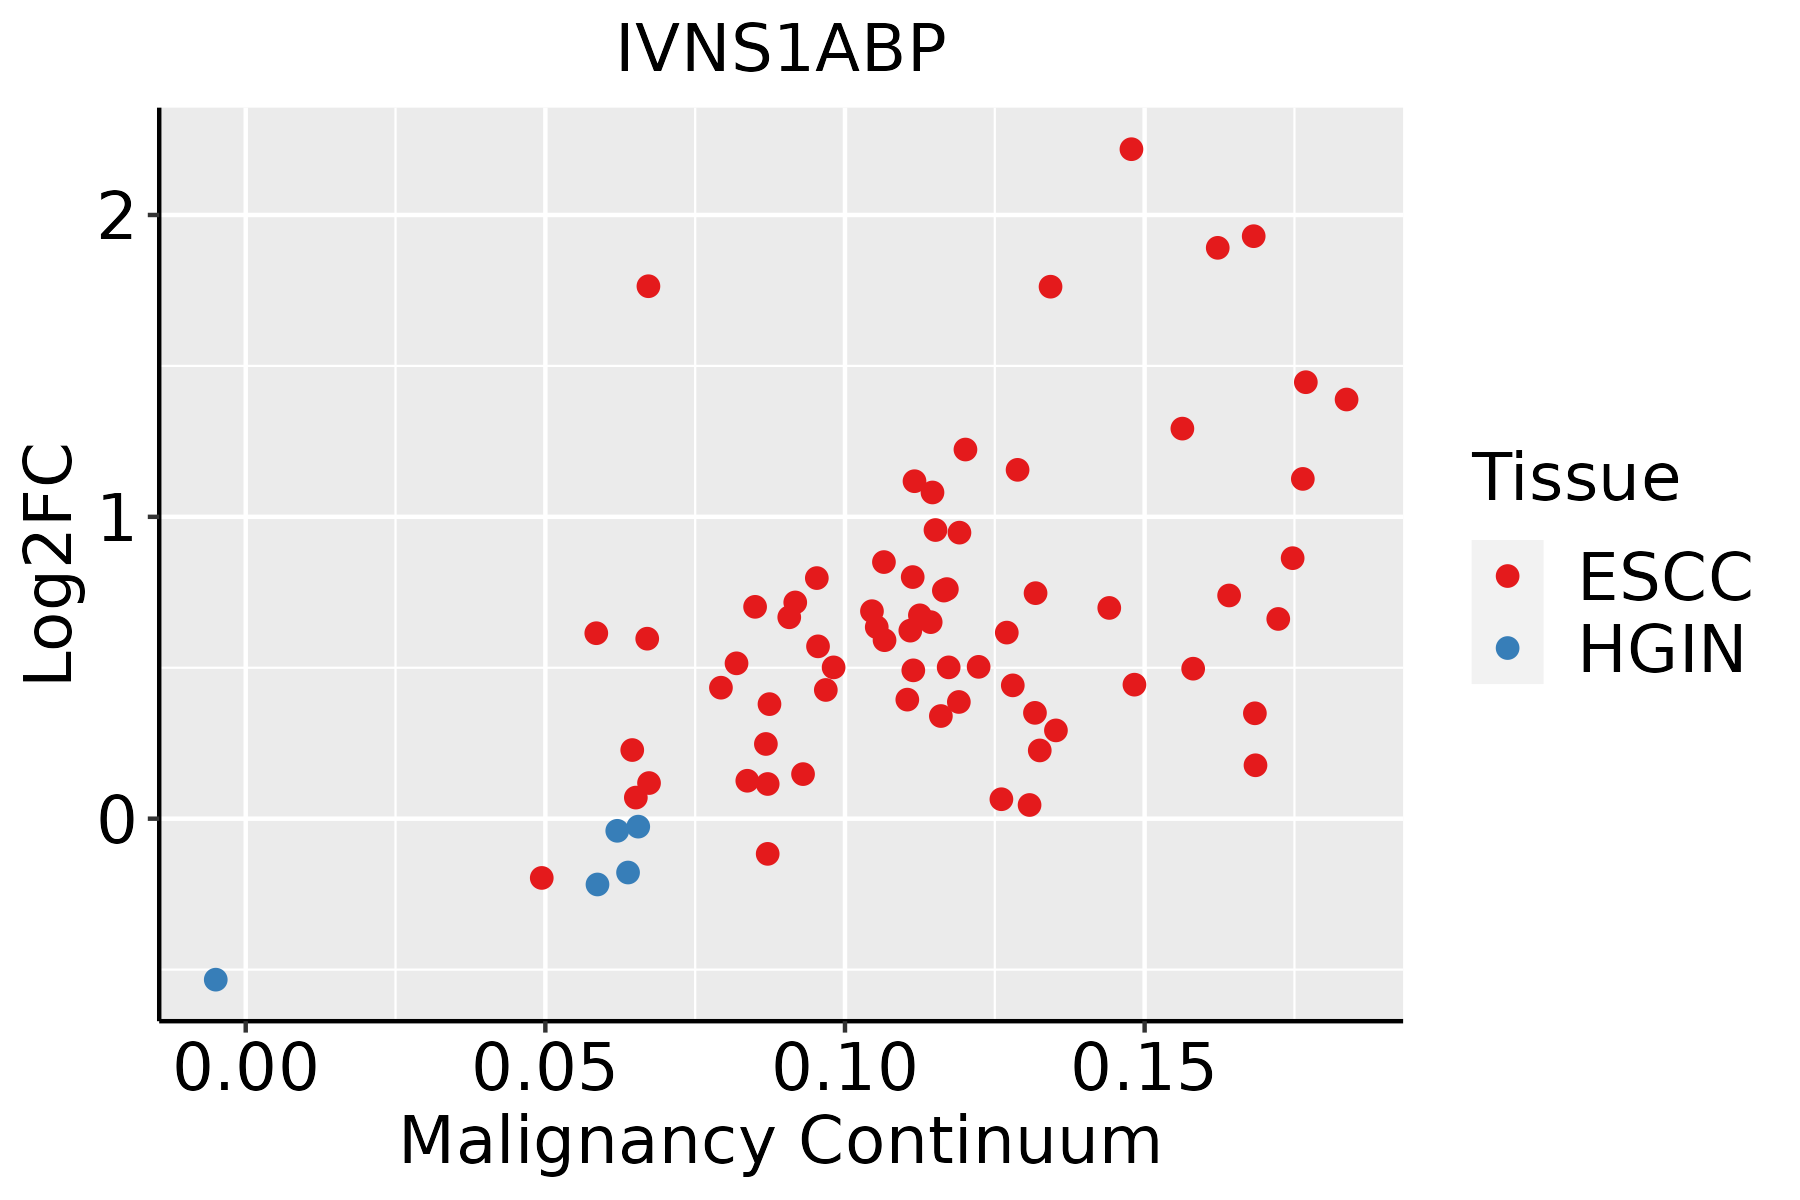
ESCC: Esophageal squamous cell carcinoma
HGIN: High-grade intraepithelial neoplasias
LGIN: Low-grade intraepithelial neoplasias
LiverThe image shows the transcriptomic changes along malignancy continuum.log2FC in expression of this searched gene in stem-like cells from each diseased tissue sample relative to stem-like cells in normal samples in each tissue plotted against the malignancy continuum. Samples are colored based on if they are from different disease stage.HCC: Hepatocellular carcinoma
NAFLD: Non-alcoholic fatty liver disease
LungThe image shows the transcriptomic changes along malignancy continuum.log2FC in expression of this searched gene in stem-like cells from each diseased tissue sample relative to stem-like cells in normal samples in each tissue plotted against the malignancy continuum. Samples are colored based on if they are from different disease stage.
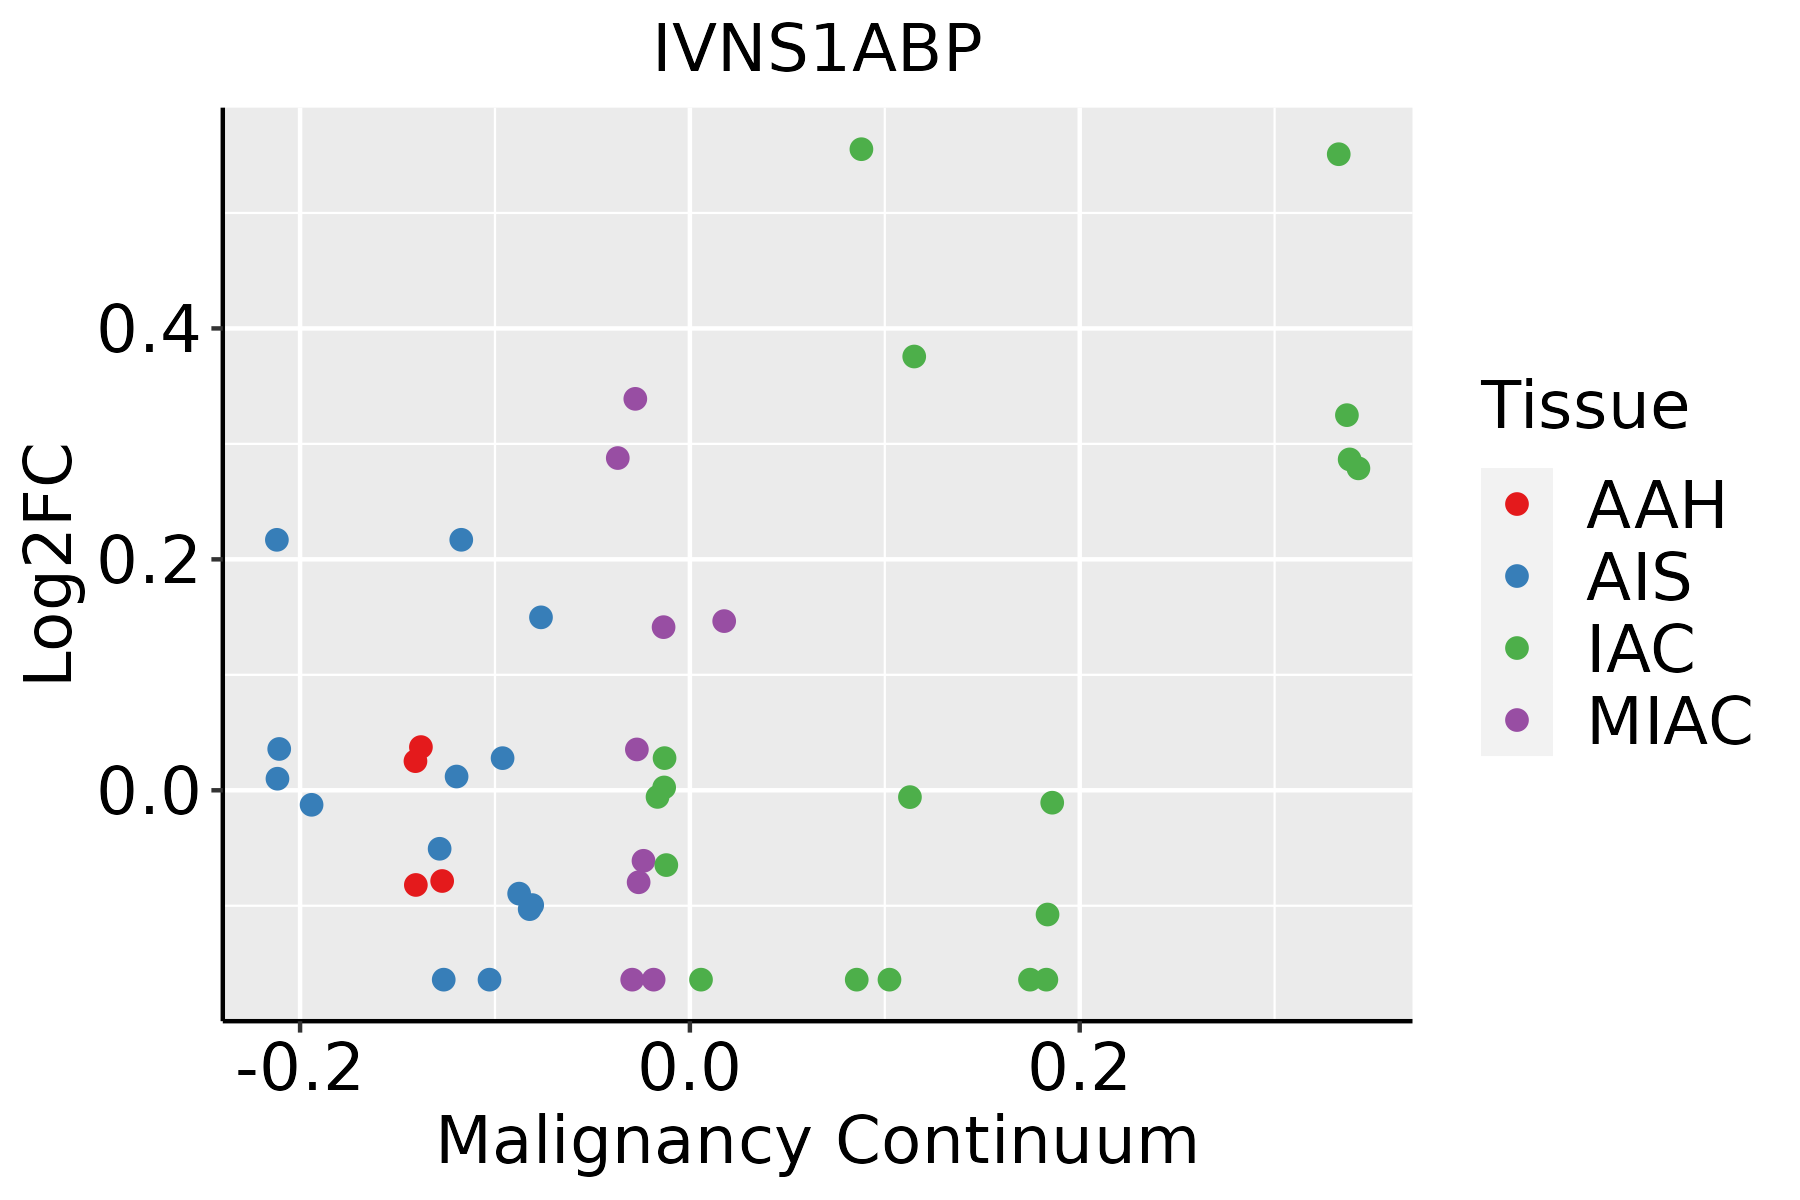
AAH: Atypical adenomatous hyperplasia
AIS: Adenocarcinoma in situ
IAC: Invasive lung adenocarcinoma
MIA: Minimally invasive adenocarcinoma
Oral CavityThe image shows the transcriptomic changes along malignancy continuum.log2FC in expression of this searched gene in stem-like cells from each diseased tissue sample relative to stem-like cells in normal samples in each tissue plotted against the malignancy continuum. Samples are colored based on if they are from different disease stage.
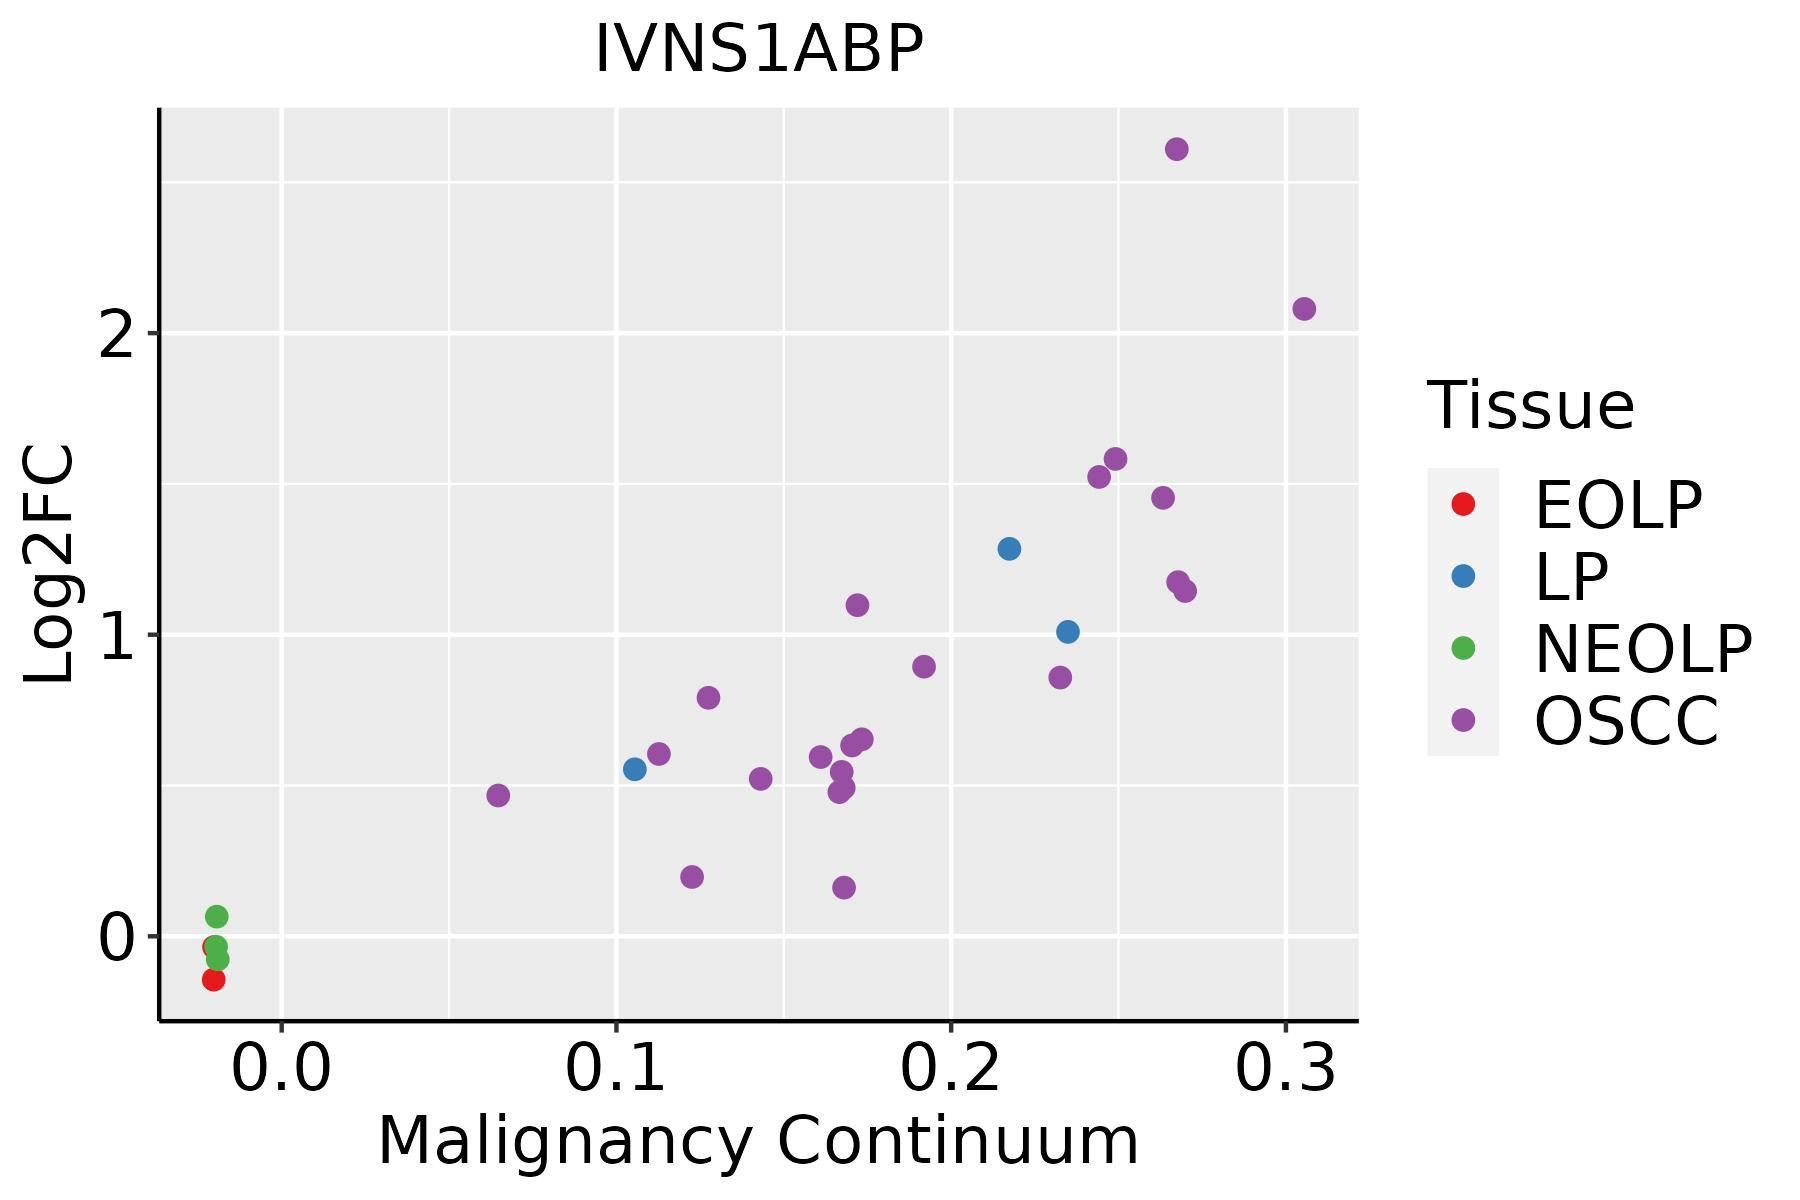
EOLP: Erosive Oral lichen planus
LP: leukoplakia
NEOLP: Non-erosive oral lichen planus
OSCC: Oral squamous cell carcinoma
ProstateThe image shows the transcriptomic changes along malignancy continuum.log2FC in expression of this searched gene in stem-like cells from each diseased tissue sample relative to stem-like cells in normal samples in each tissue plotted against the malignancy continuum. Samples are colored based on if they are from different disease stage.
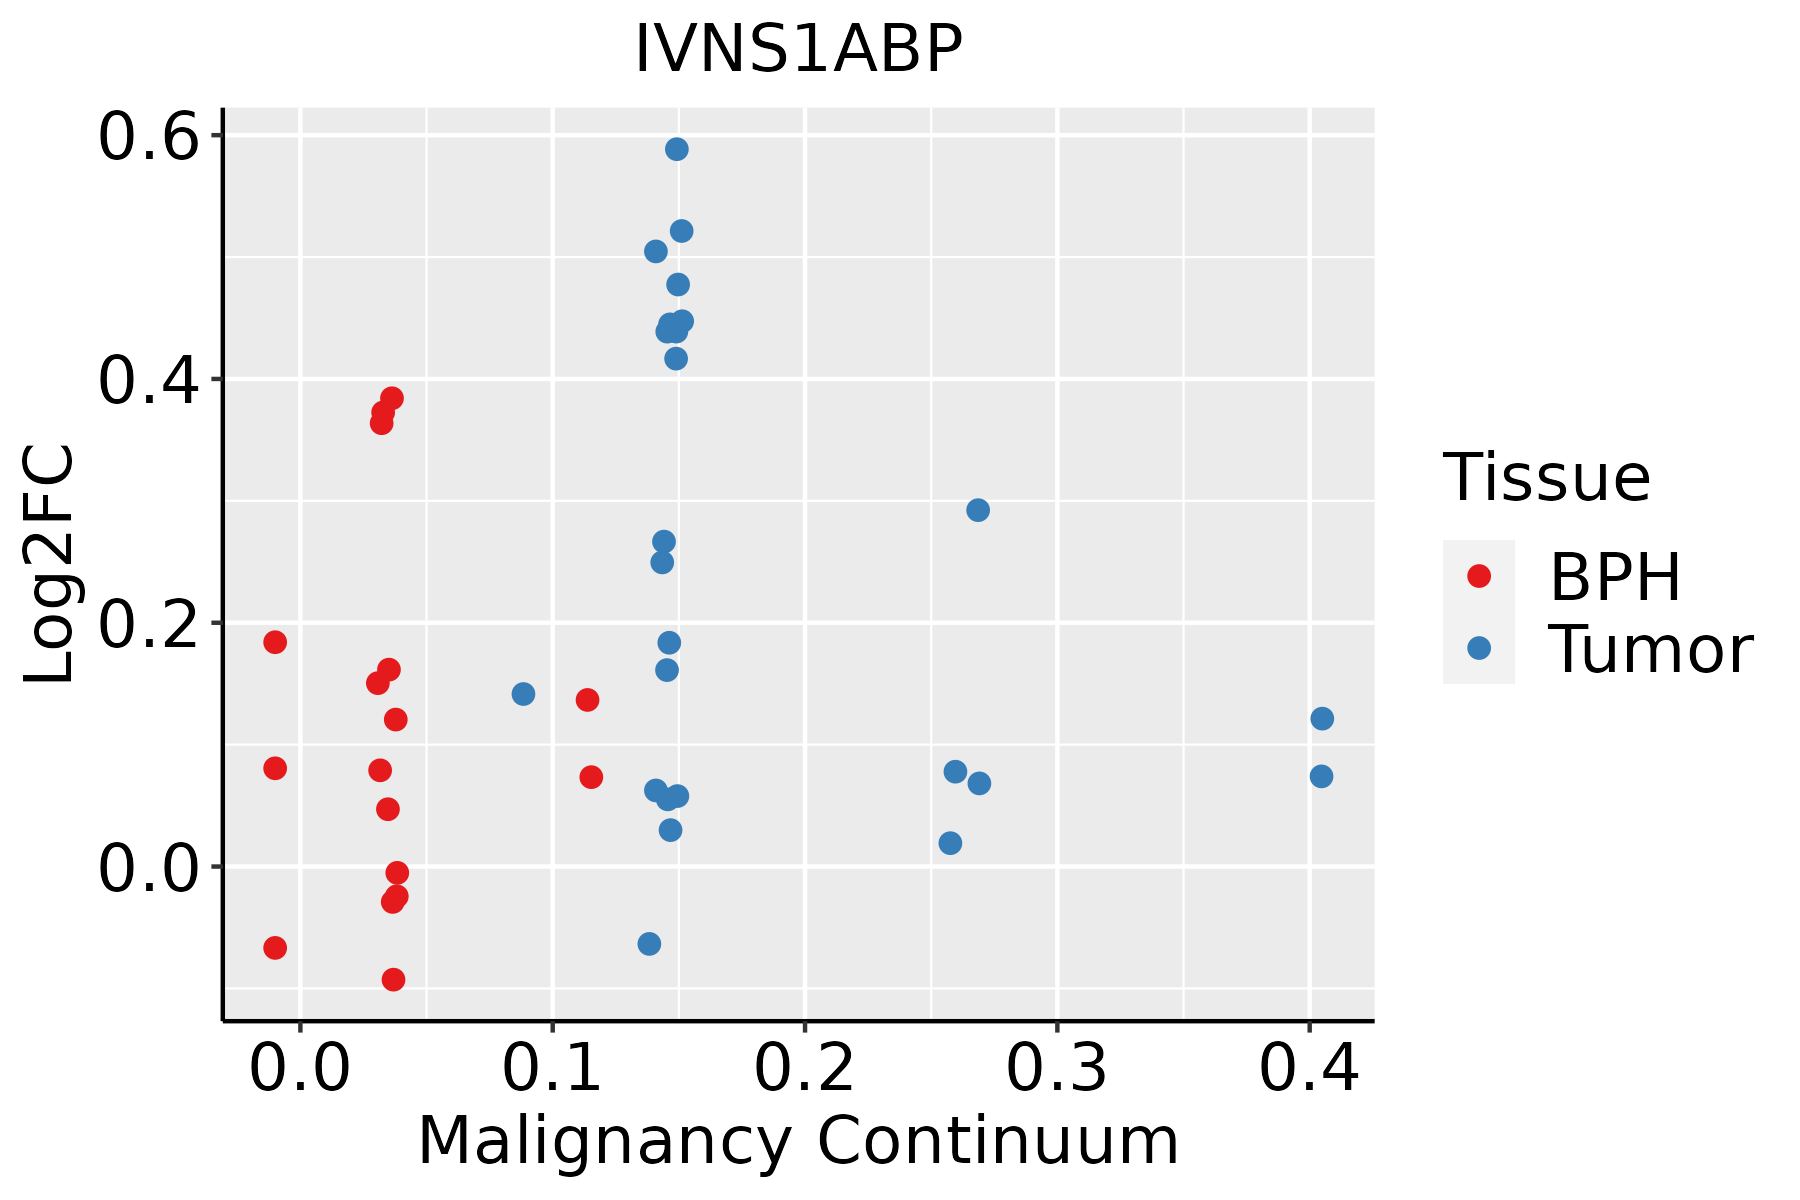
BPH: Benign Prostatic Hyperplasia
SkinThe image shows the transcriptomic changes along malignancy continuum.log2FC in expression of this searched gene in stem-like cells from each diseased tissue sample relative to stem-like cells in normal samples in each tissue plotted against the malignancy continuum. Samples are colored based on if they are from different disease stage.
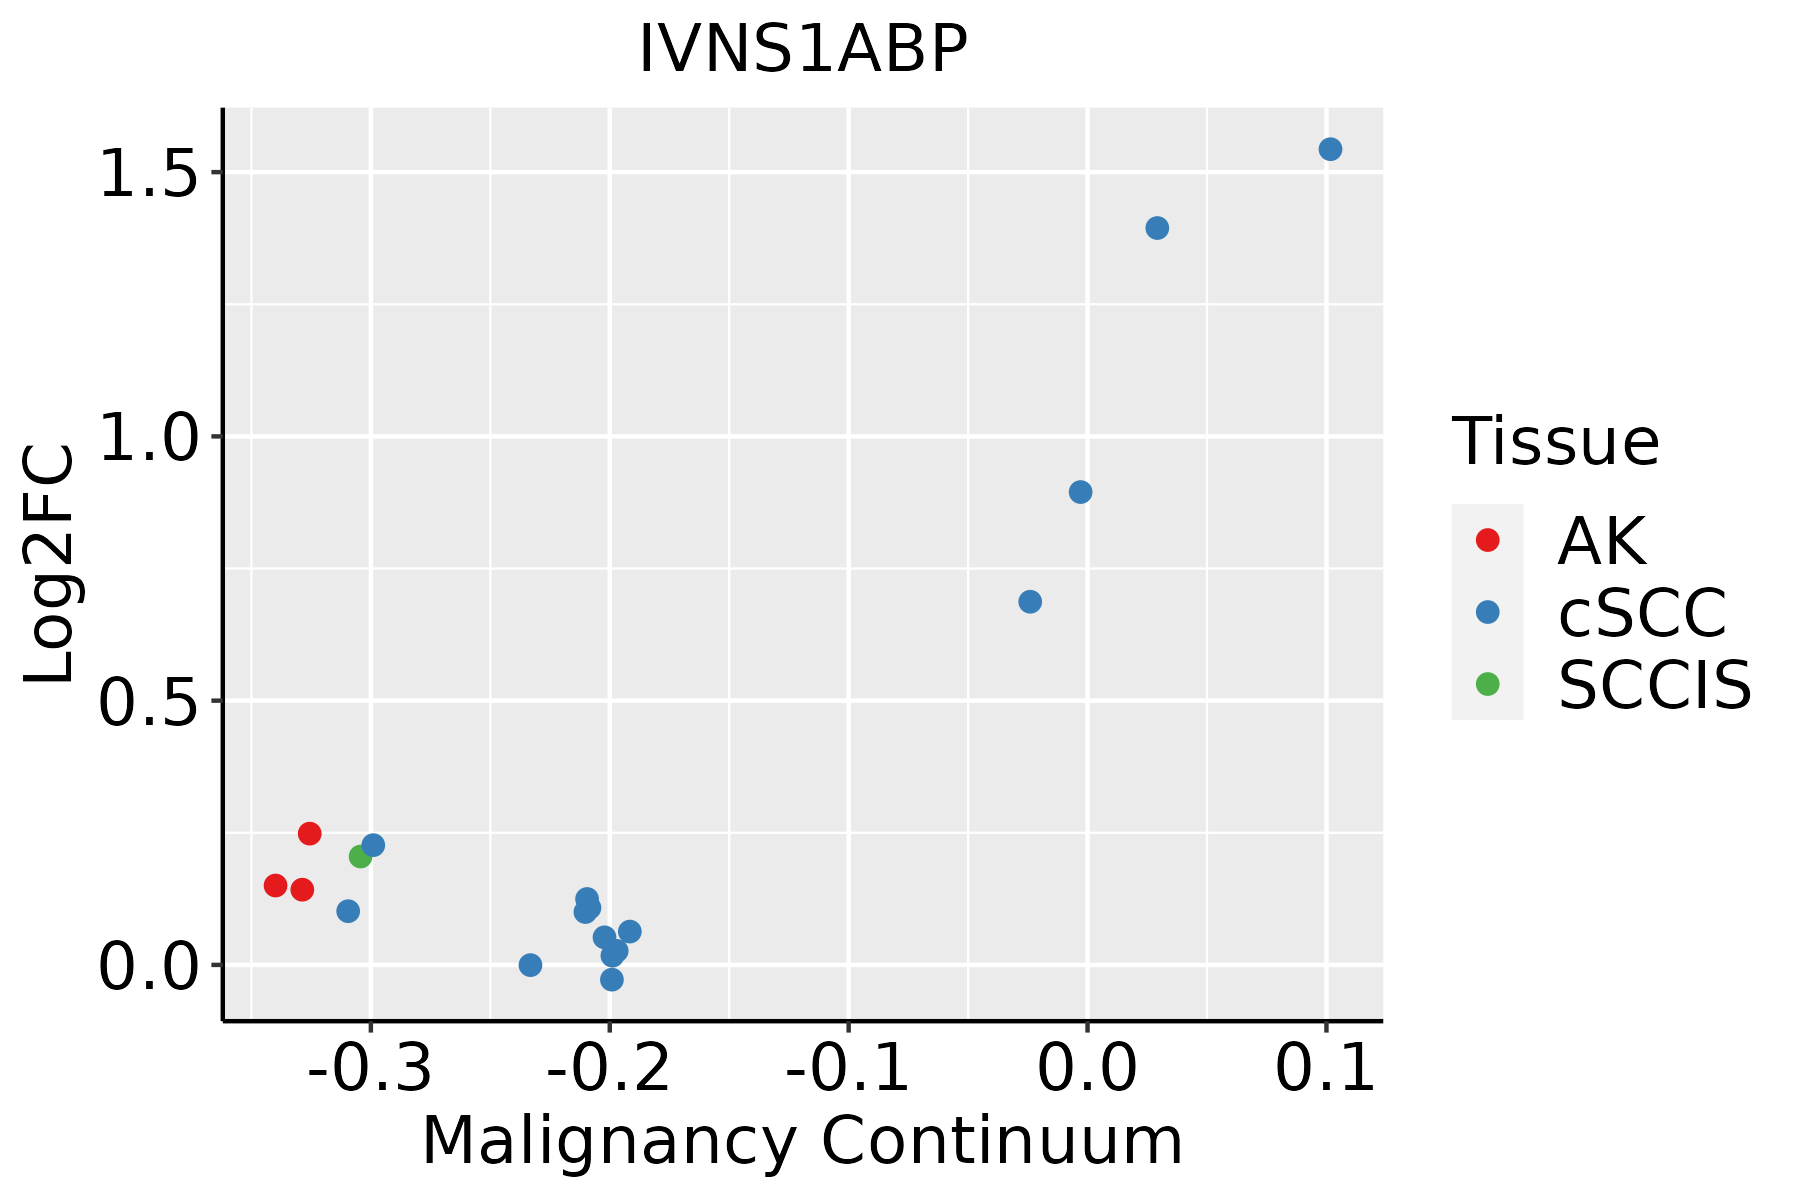
AK: Actinic keratosis
cSCC: Cutaneous squamous cell carcinoma
SCCIS:squamous cell carcinoma in situ
∗log2FC in expression of this searched gene in stem-like cells from each diseased tissue sample relative to stem-like cells in normal samples in each tissue plotted against the malignancy continuum. Samples are colored based on if they are from different disease stage.

Top

Malignant transformation related pathway analysis

check buttonFind out the enriched GO biological processes and KEGG pathways involved in transition from healthy to precancer to cancer
check button Figure of enriched GO biological processes.
TissueDisease StageEnriched GO biological Processes
ColorectumADGO analysis - Figure of enriched GO biological processes: Top 15 enriched GO BP terms are showed in the bar plot of each disease state in each tissue. Each row represents a significant GO biological process which is colored according to the -log10(p.adjust).
ColorectumSERGO analysis - Figure of enriched GO biological processes: Top 15 enriched GO BP terms are showed in the bar plot of each disease state in each tissue. Each row represents a significant GO biological process which is colored according to the -log10(p.adjust).
ColorectumMSSGO analysis - Figure of enriched GO biological processes: Top 15 enriched GO BP terms are showed in the bar plot of each disease state in each tissue. Each row represents a significant GO biological process which is colored according to the -log10(p.adjust).
ColorectumMSI-HGO analysis - Figure of enriched GO biological processes: Top 15 enriched GO BP terms are showed in the bar plot of each disease state in each tissue. Each row represents a significant GO biological process which is colored according to the -log10(p.adjust).
ColorectumFAPGO analysis - Figure of enriched GO biological processes: Top 15 enriched GO BP terms are showed in the bar plot of each disease state in each tissue. Each row represents a significant GO biological process which is colored according to the -log10(p.adjust).
∗Top 15 enriched GO BP terms are showed in the bar plot of each disease state in each tissue. Each row represents a significant GO biological process which is colored according to the -log10(p.adjust).
Page: 1 2 3 4 5 6 7 8 9 

check button Enriched GO biological processes.
GO IDTissueDisease StageDescriptionGene RatioBg Ratiopvaluep.adjustCount
GO:0008380111EsophagusESCCRNA splicing336/8552434/187231.74e-423.67e-39336
GO:0097193111EsophagusESCCintrinsic apoptotic signaling pathway222/8552288/187235.87e-282.02e-25222
GO:2001233111EsophagusESCCregulation of apoptotic signaling pathway256/8552356/187234.11e-241.04e-21256
GO:1903320111EsophagusESCCregulation of protein modification by small protein conjugation or removal181/8552242/187231.80e-202.60e-18181
GO:2001242111EsophagusESCCregulation of intrinsic apoptotic signaling pathway128/8552164/187231.75e-171.50e-15128
GO:0031396111EsophagusESCCregulation of protein ubiquitination154/8552210/187232.70e-162.04e-14154
GO:2001234111EsophagusESCCnegative regulation of apoptotic signaling pathway161/8552224/187231.24e-158.09e-14161
GO:000961518EsophagusESCCresponse to virus238/8552367/187236.65e-143.32e-12238
GO:2001243111EsophagusESCCnegative regulation of intrinsic apoptotic signaling pathway78/855298/187235.50e-122.10e-1078
GO:00063833EsophagusESCCtranscription by RNA polymerase III41/855246/187237.69e-101.90e-0841
GO:0031397111EsophagusESCCnegative regulation of protein ubiquitination63/855283/187231.87e-083.65e-0763
GO:1903321111EsophagusESCCnegative regulation of protein modification by small protein conjugation or removal69/855295/187238.54e-081.44e-0669
GO:000838012LiverCirrhoticRNA splicing229/4634434/187239.13e-372.86e-33229
GO:200123312LiverCirrhoticregulation of apoptotic signaling pathway163/4634356/187232.62e-184.43e-16163
GO:009719312LiverCirrhoticintrinsic apoptotic signaling pathway130/4634288/187232.69e-142.45e-12130
GO:20012427LiverCirrhoticregulation of intrinsic apoptotic signaling pathway82/4634164/187232.35e-121.71e-1082
GO:20012347LiverCirrhoticnegative regulation of apoptotic signaling pathway102/4634224/187238.40e-125.60e-10102
GO:190332012LiverCirrhoticregulation of protein modification by small protein conjugation or removal105/4634242/187231.43e-107.43e-09105
GO:003139612LiverCirrhoticregulation of protein ubiquitination89/4634210/187231.40e-085.30e-0789
GO:20012437LiverCirrhoticnegative regulation of intrinsic apoptotic signaling pathway47/463498/187235.26e-071.17e-0547
Page: 1 2 3 4 5 6 

check button Enriched KEGG pathways.
Pathway IDTissueDisease StageDescriptionGene RatioBg Ratiopvaluep.adjustqvalueCount
Page: 1 

Top

Cell-cell communication analysis

check buttonIdentification of potential cell-cell interactions between two cell types and their ligand-receptor pairs for different disease states
LigandReceptorLRpairPathwayTissueDisease Stage
Page: 1 

Top

Single-cell gene regulatory network inference analysis

check buttonFind out the significant the regulons (TFs) and the target genes of each regulon across cell types for different disease states
TFCell TypeTissueDisease StageTarget GeneRSSRegulon Activity
∗The dot plots of a searched regulon are shown for all cell subpopulations in each disease state of each tissue based on the regulon specific score inferred using pySCENIC and by calculating the average expression.
Page: 1 

Top

Somatic mutation of malignant transformation related genes

check buttonAnnotation of somatic variants for genes involved in malignant transformation
Hugo SymbolVariant ClassVariant ClassificationdbSNP RSHGVScHGVSpHGVSp ShortSWISSPROTBIOTYPESIFTPolyPhenTumor Sample BarcodeTissueHistologySexAgeStageTherapy TypesDrugsOutcome
IVNS1ABPSNVMissense_Mutationnovelc.1711C>Gp.His571Aspp.H571DQ9Y6Y0protein_codingtolerated(0.07)possibly_damaging(0.872)TCGA-AC-A3W6-01Breastbreast invasive carcinomaFemale>=65III/IVUnknownUnknownSD
IVNS1ABPSNVMissense_Mutationc.203N>Gp.His68Argp.H68RQ9Y6Y0protein_codingtolerated(0.43)benign(0.265)TCGA-AN-A0AK-01Breastbreast invasive carcinomaFemale>=65I/IIUnknownUnknownSD
IVNS1ABPSNVMissense_Mutationc.888G>Cp.Lys296Asnp.K296NQ9Y6Y0protein_codingtolerated(0.09)probably_damaging(0.915)TCGA-AR-A24H-01Breastbreast invasive carcinomaFemale>=65I/IIHormone TherapytamoxiphenSD
IVNS1ABPSNVMissense_Mutationc.523N>Tp.Arg175Trpp.R175WQ9Y6Y0protein_codingtolerated(0.19)probably_damaging(1)TCGA-AR-A251-01Breastbreast invasive carcinomaFemale<65III/IVChemotherapydoxorubicinSD
IVNS1ABPinsertionIn_Frame_Insnovelc.931_932insCTTTTTCTCATTGTGCAGATTp.Ile311delinsThrPheSerHisCysAlaAspLeup.I311delinsTFSHCADLQ9Y6Y0protein_codingTCGA-A2-A0EO-01Breastbreast invasive carcinomaFemale<65I/IIHormone TherapytamoxiphenSD
IVNS1ABPinsertionNonsense_Mutationnovelc.929_930insCATCCTTAAAAAGTTTTAAp.Phe312LeufsTer5p.F312Lfs*5Q9Y6Y0protein_codingTCGA-A2-A0EO-01Breastbreast invasive carcinomaFemale<65I/IIHormone TherapytamoxiphenSD
IVNS1ABPSNVMissense_Mutationnovelc.142G>Tp.Ala48Serp.A48SQ9Y6Y0protein_codingdeleterious(0.03)probably_damaging(0.998)TCGA-2W-A8YY-01Cervixcervical & endocervical cancerFemale<65I/IIChemotherapycisplatinCR
IVNS1ABPSNVMissense_Mutationnovelc.1309G>Ap.Asp437Asnp.D437NQ9Y6Y0protein_codingtolerated(0.32)benign(0.013)TCGA-VS-A958-01Cervixcervical & endocervical cancerFemale<65I/IIChemotherapycisplatinCR
IVNS1ABPSNVMissense_Mutationnovelc.1696N>Ap.Gly566Serp.G566SQ9Y6Y0protein_codingdeleterious(0)probably_damaging(1)TCGA-VS-A9UI-01Cervixcervical & endocervical cancerFemale>=65I/IIUnknownUnknownSD
IVNS1ABPSNVMissense_Mutationnovelc.1912N>Cp.Lys638Glnp.K638QQ9Y6Y0protein_codingtolerated_low_confidence(0.18)benign(0.001)TCGA-AA-3984-01Colorectumcolon adenocarcinomaFemale<65I/IIUnknownUnknownSD
Page: 1 2 3 4 5 6 7 8 

Top

Related drugs of malignant transformation related genes

check buttonIdentification of chemicals and drugs interact with genes involved in malignant transfromation
(DGIdb 4.0)
Entrez IDSymbolCategoryInteraction TypesDrug Claim NameDrug NamePMIDs
Page: 1