| Tissue | Expression Dynamics | Abbreviation |
| Cervix | 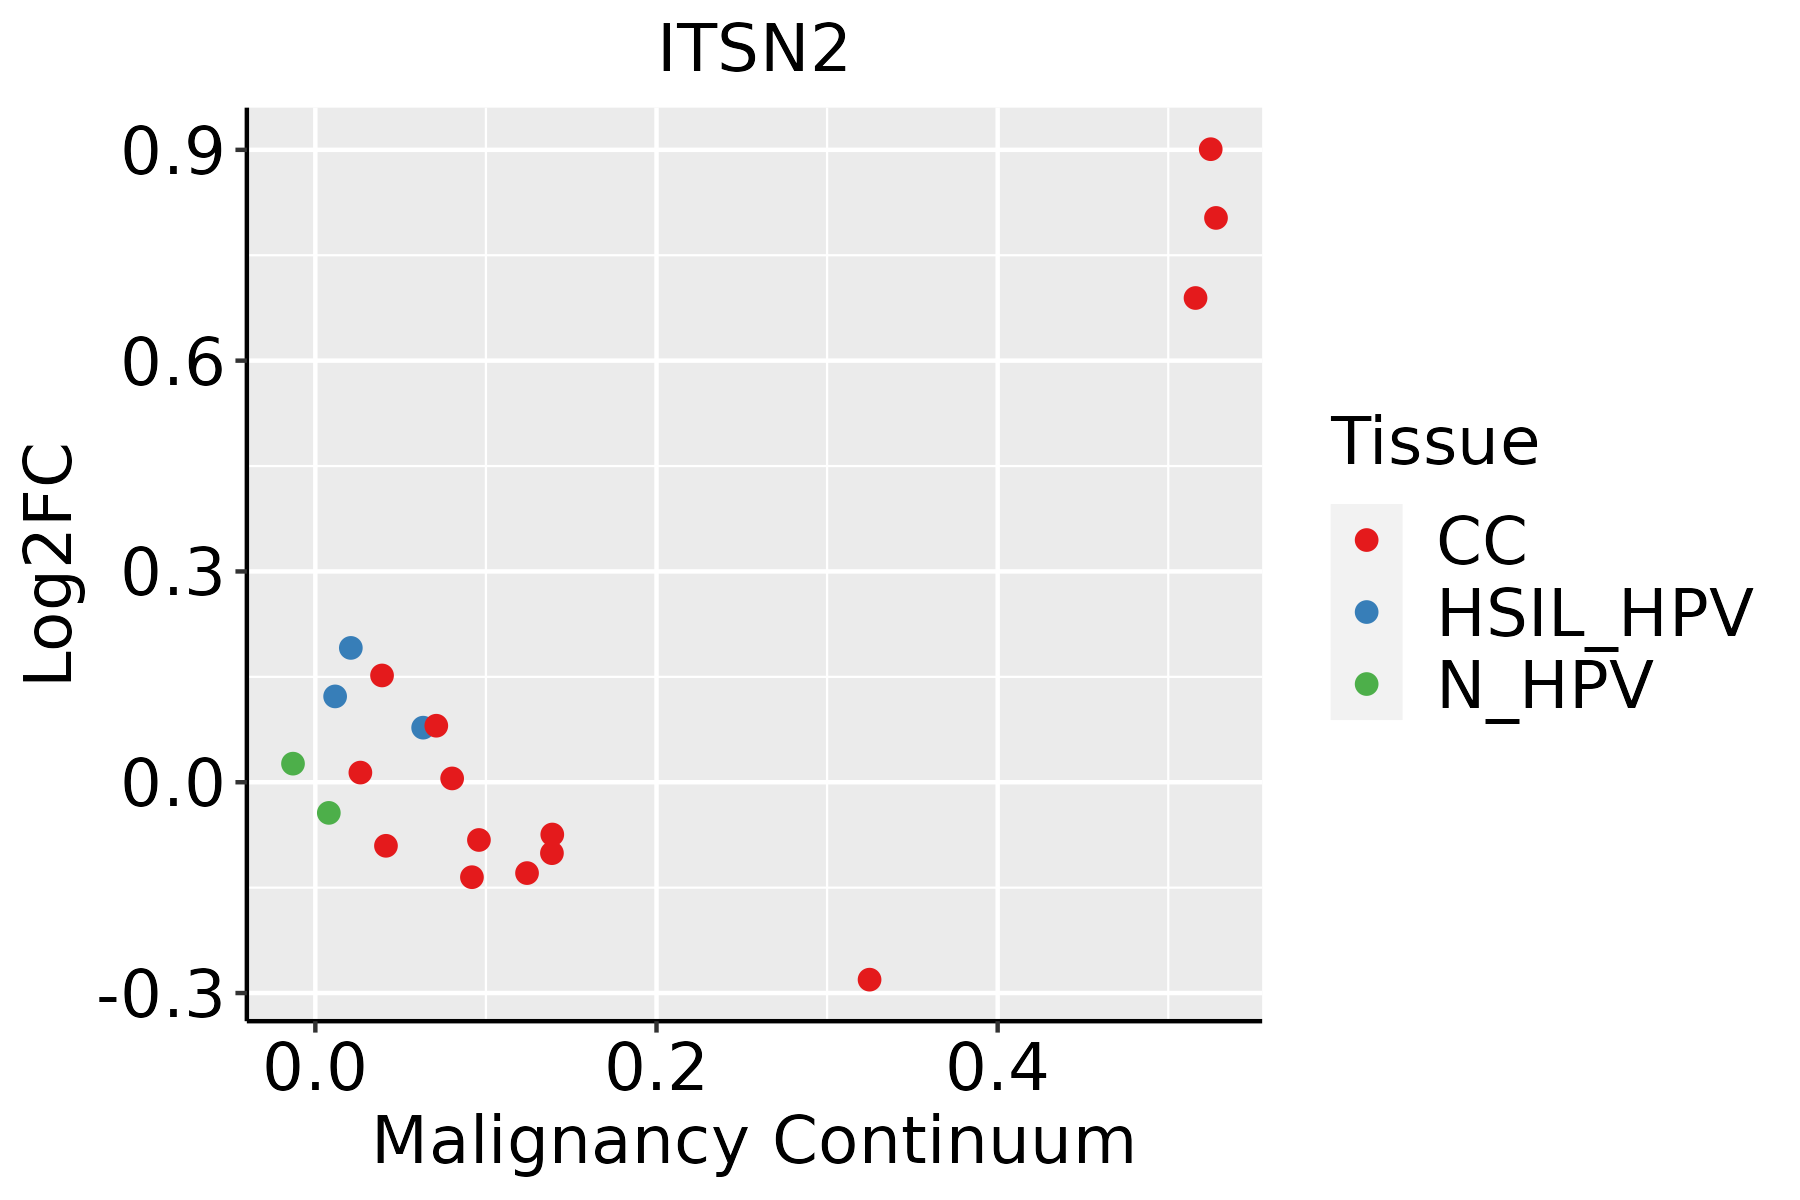 | CC: Cervix cancer |
| HSIL_HPV: HPV-infected high-grade squamous intraepithelial lesions |
| N_HPV: HPV-infected normal cervix |
| Colorectum (GSE201348) |  | FAP: Familial adenomatous polyposis |
| CRC: Colorectal cancer |
| Colorectum (HTA11) |  | AD: Adenomas |
| SER: Sessile serrated lesions |
| MSI-H: Microsatellite-high colorectal cancer |
| MSS: Microsatellite stable colorectal cancer |
| Endometrium | 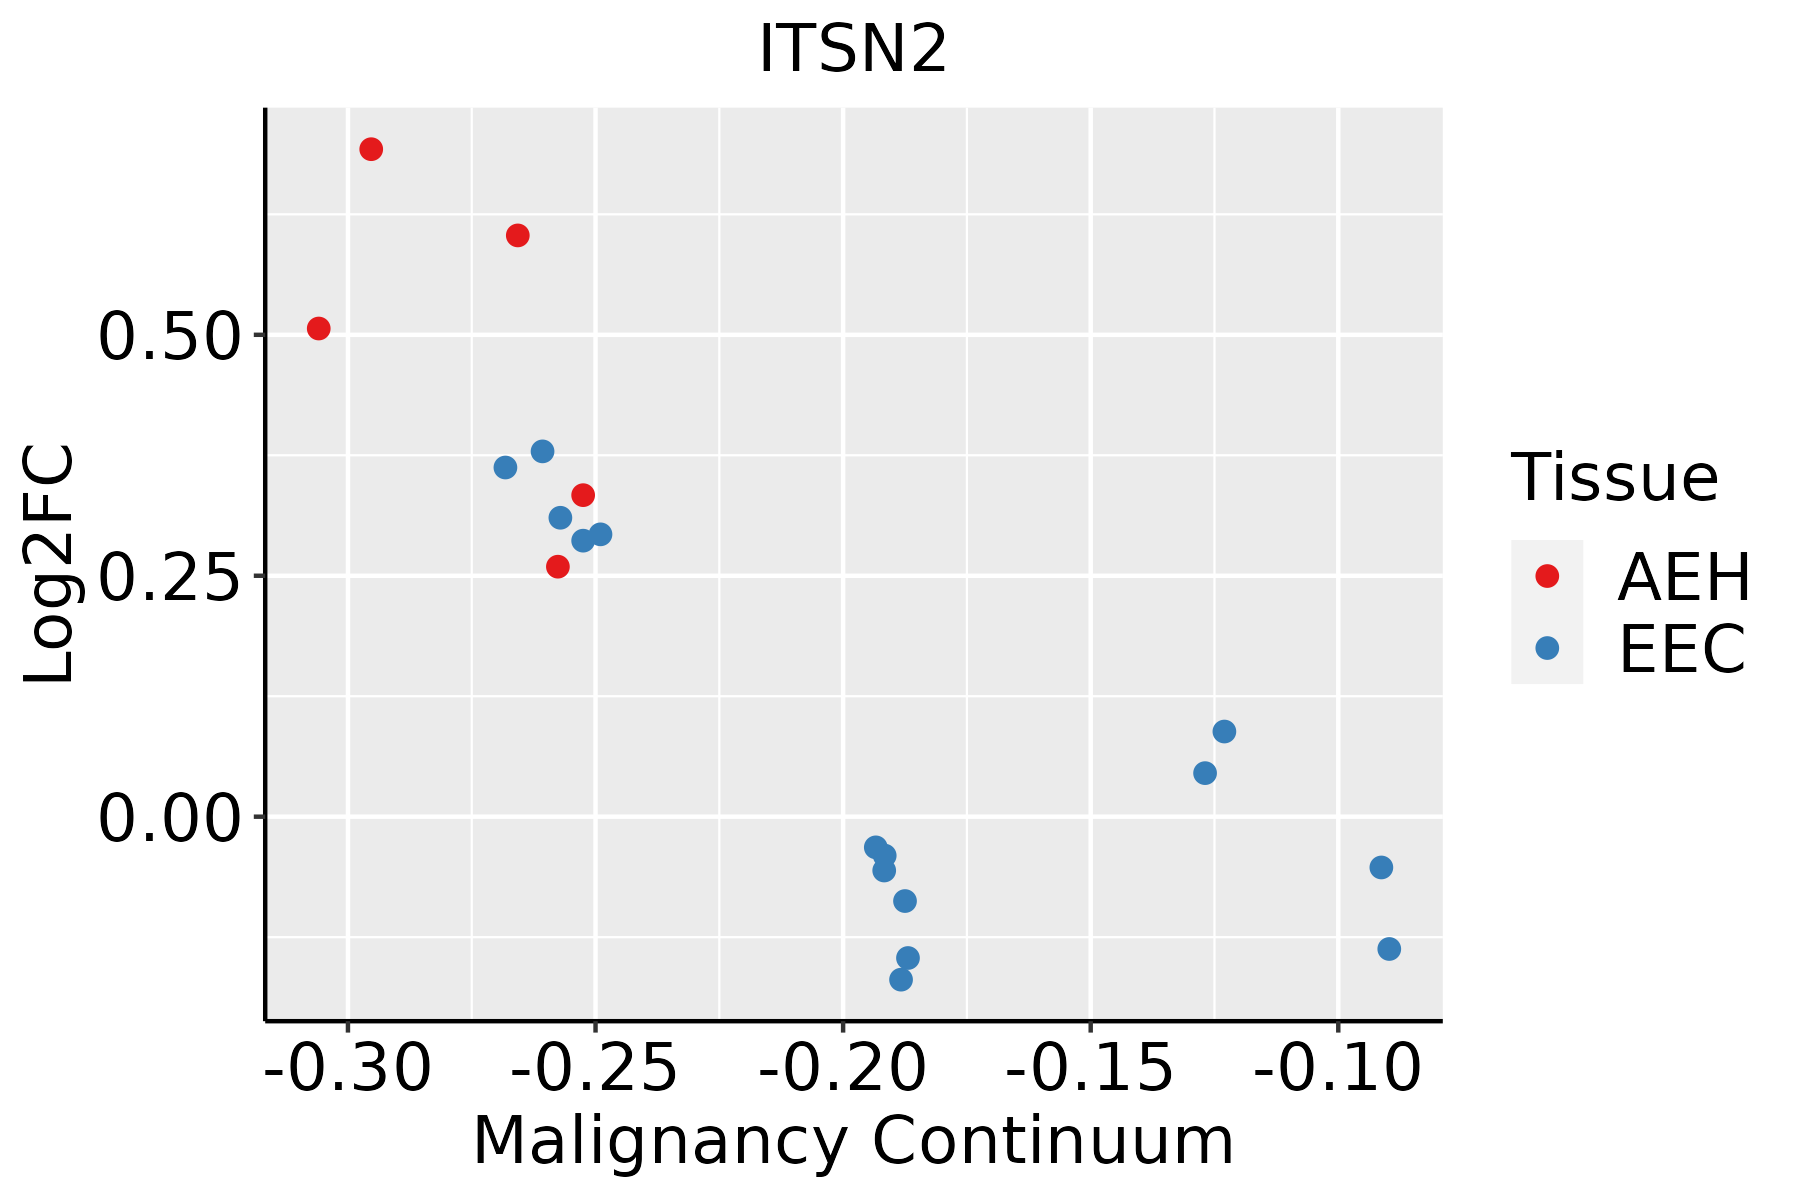 | AEH: Atypical endometrial hyperplasia |
| EEC: Endometrioid Cancer |
| Esophagus | 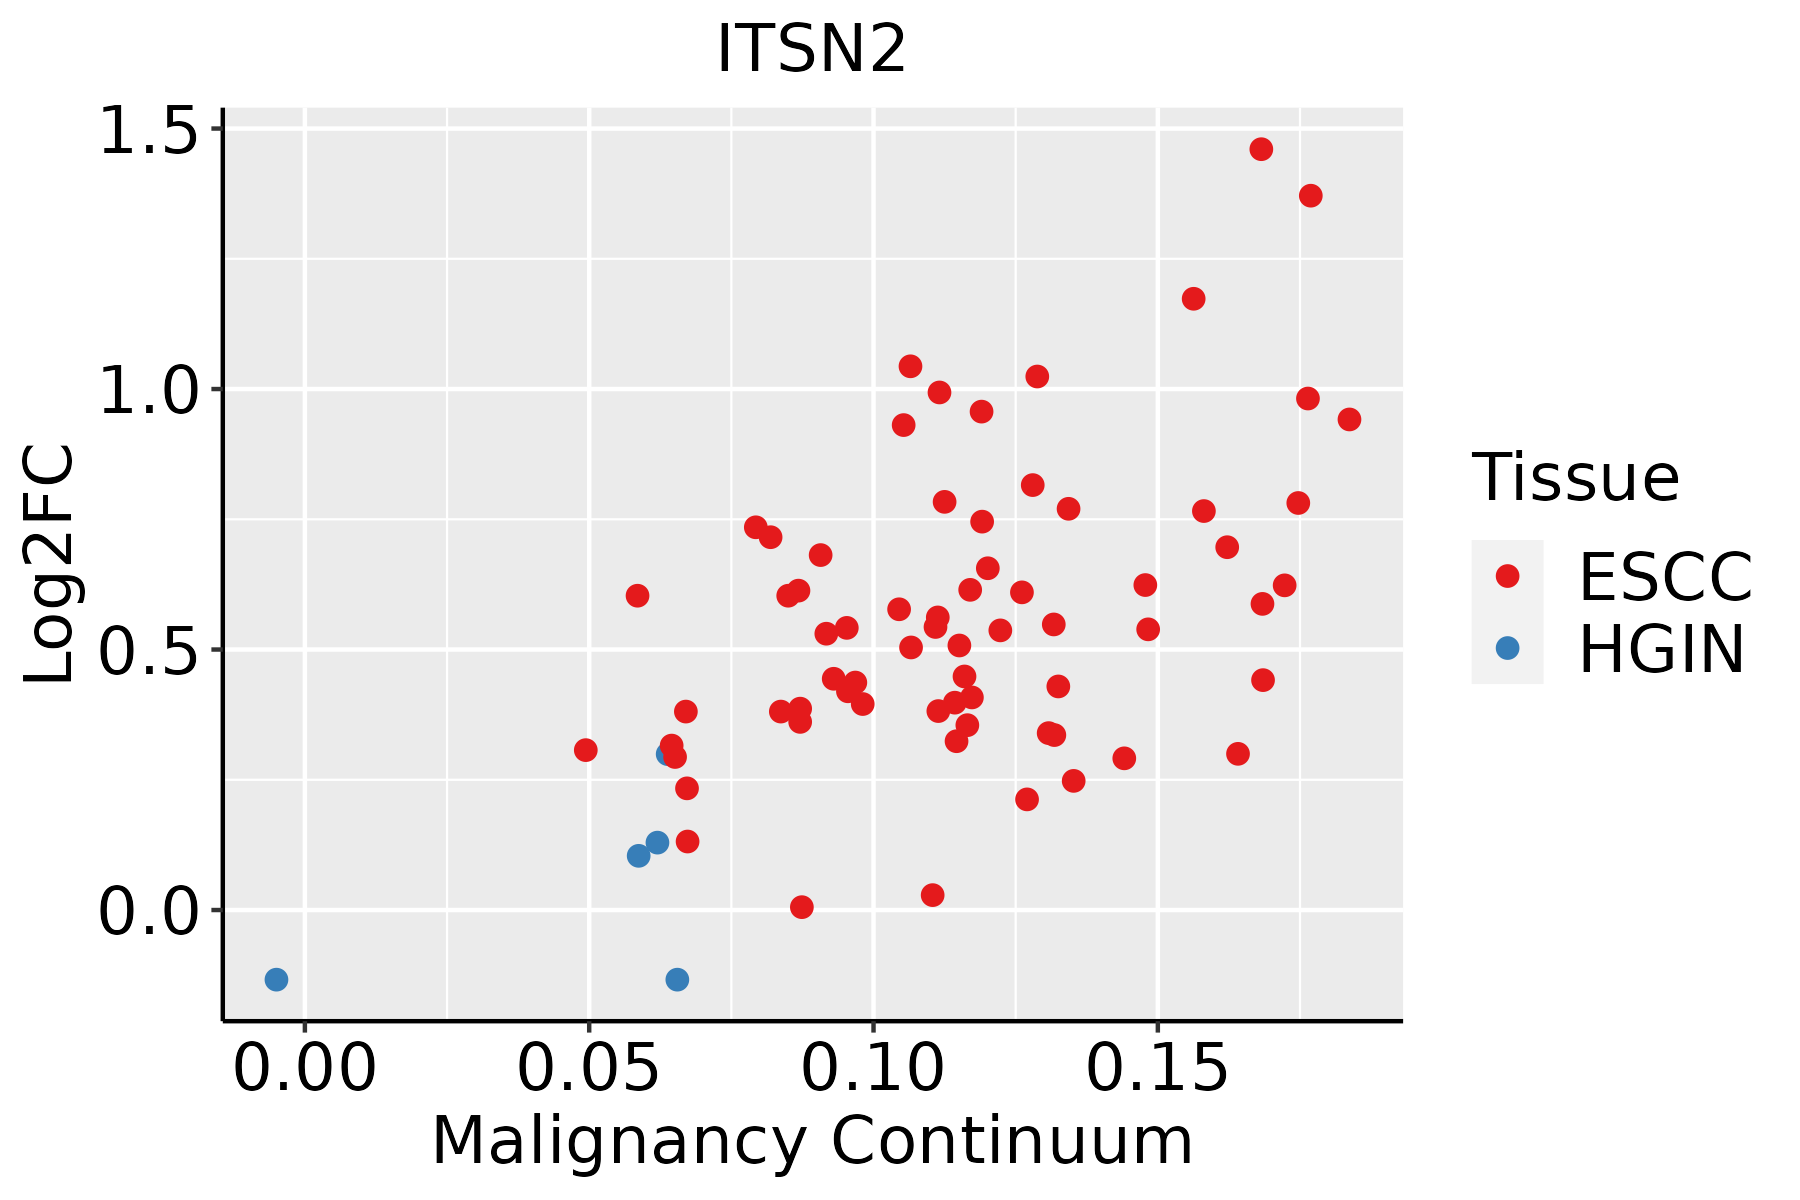 | ESCC: Esophageal squamous cell carcinoma |
| HGIN: High-grade intraepithelial neoplasias |
| LGIN: Low-grade intraepithelial neoplasias |
| Liver | 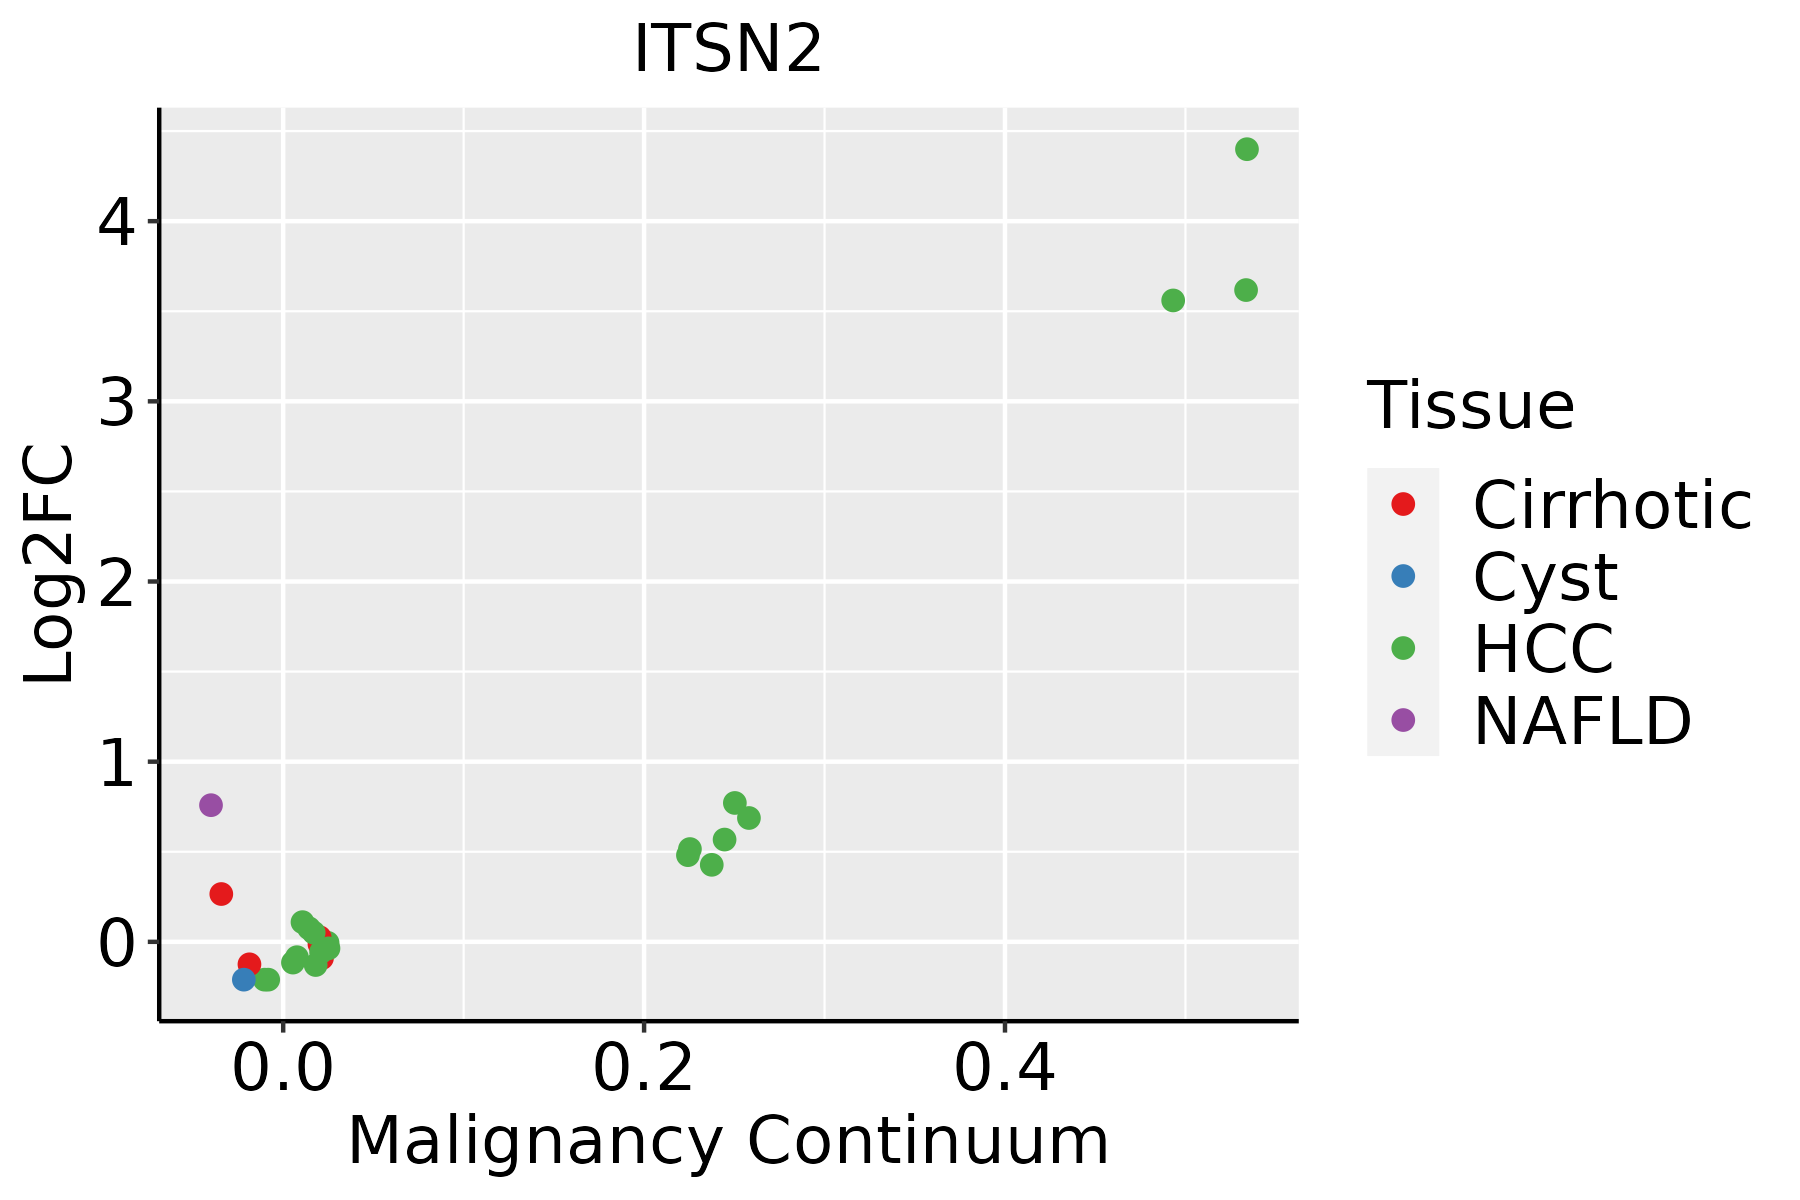 | HCC: Hepatocellular carcinoma |
| NAFLD: Non-alcoholic fatty liver disease |
| Lung | 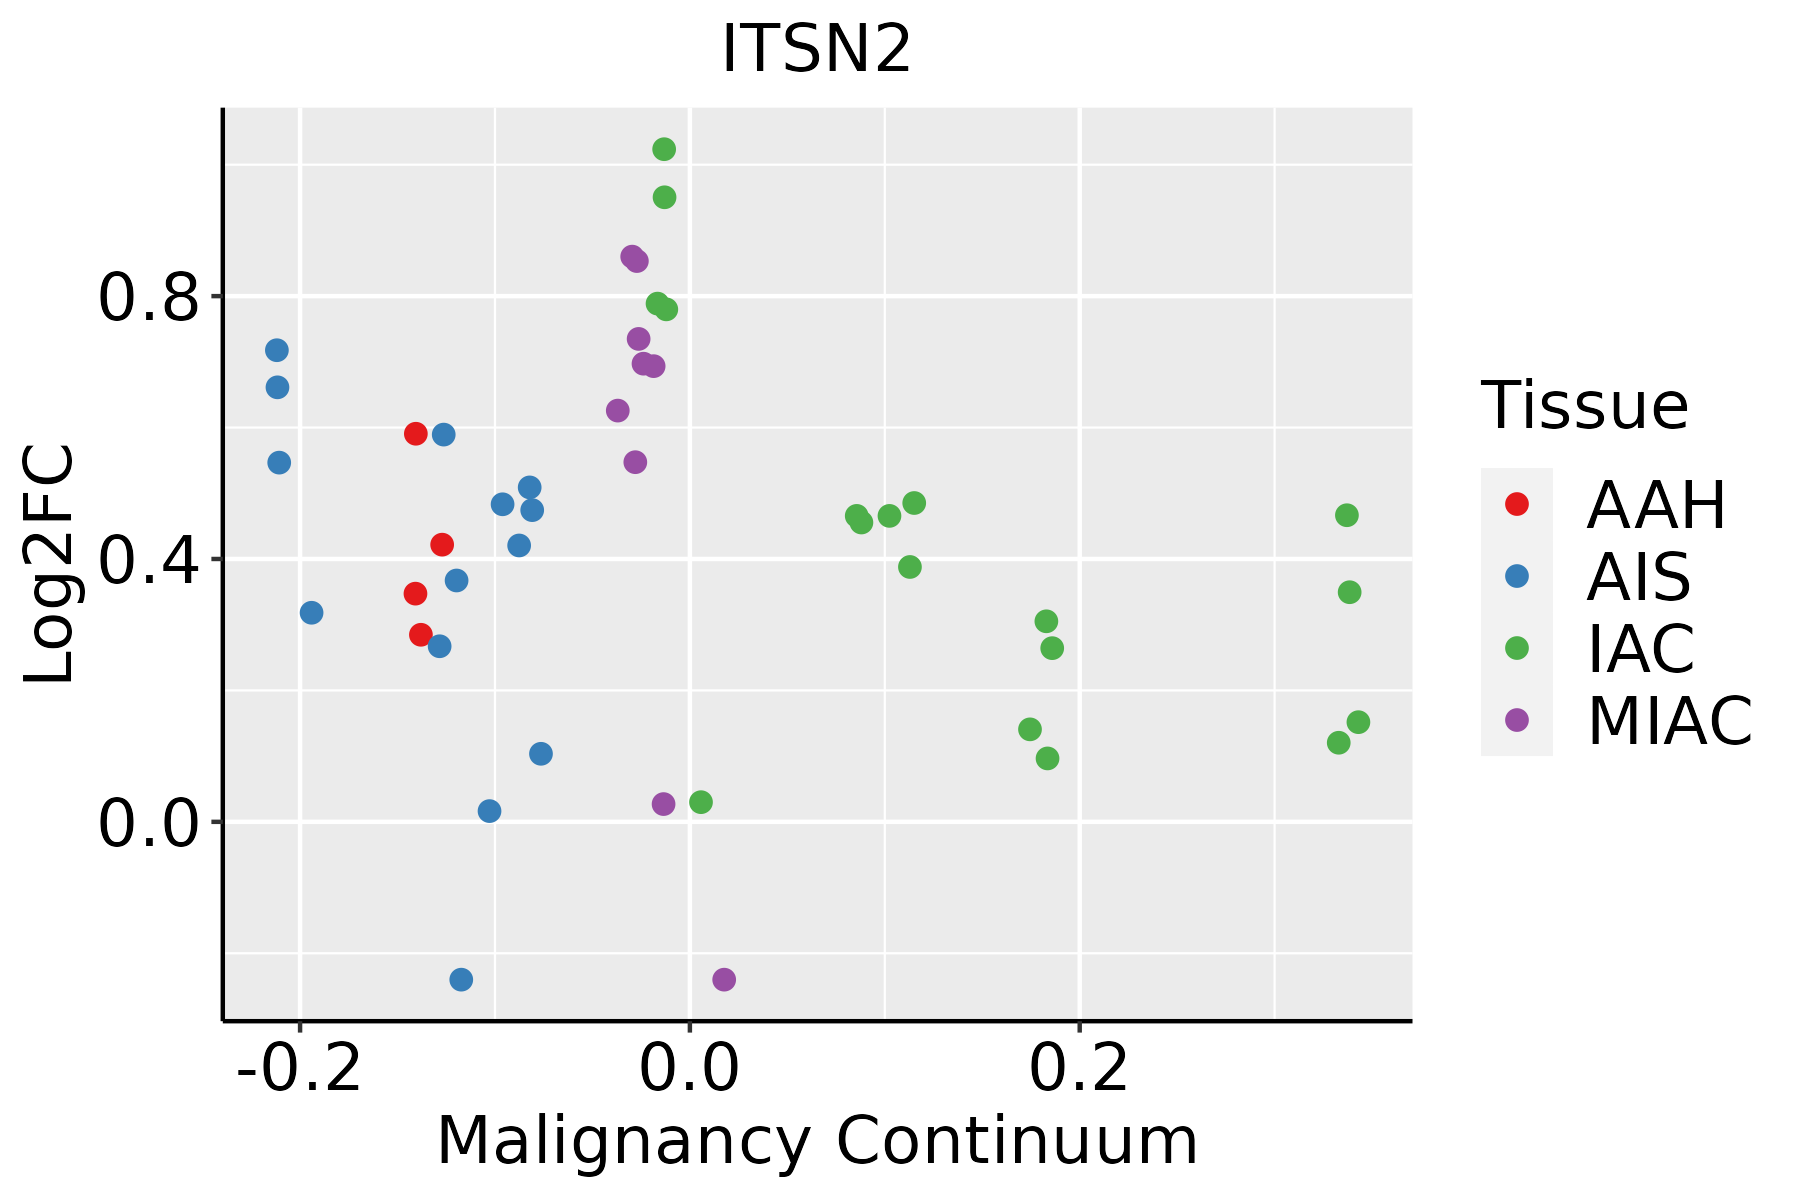 | AAH: Atypical adenomatous hyperplasia |
| AIS: Adenocarcinoma in situ |
| IAC: Invasive lung adenocarcinoma |
| MIA: Minimally invasive adenocarcinoma |
| Oral Cavity | 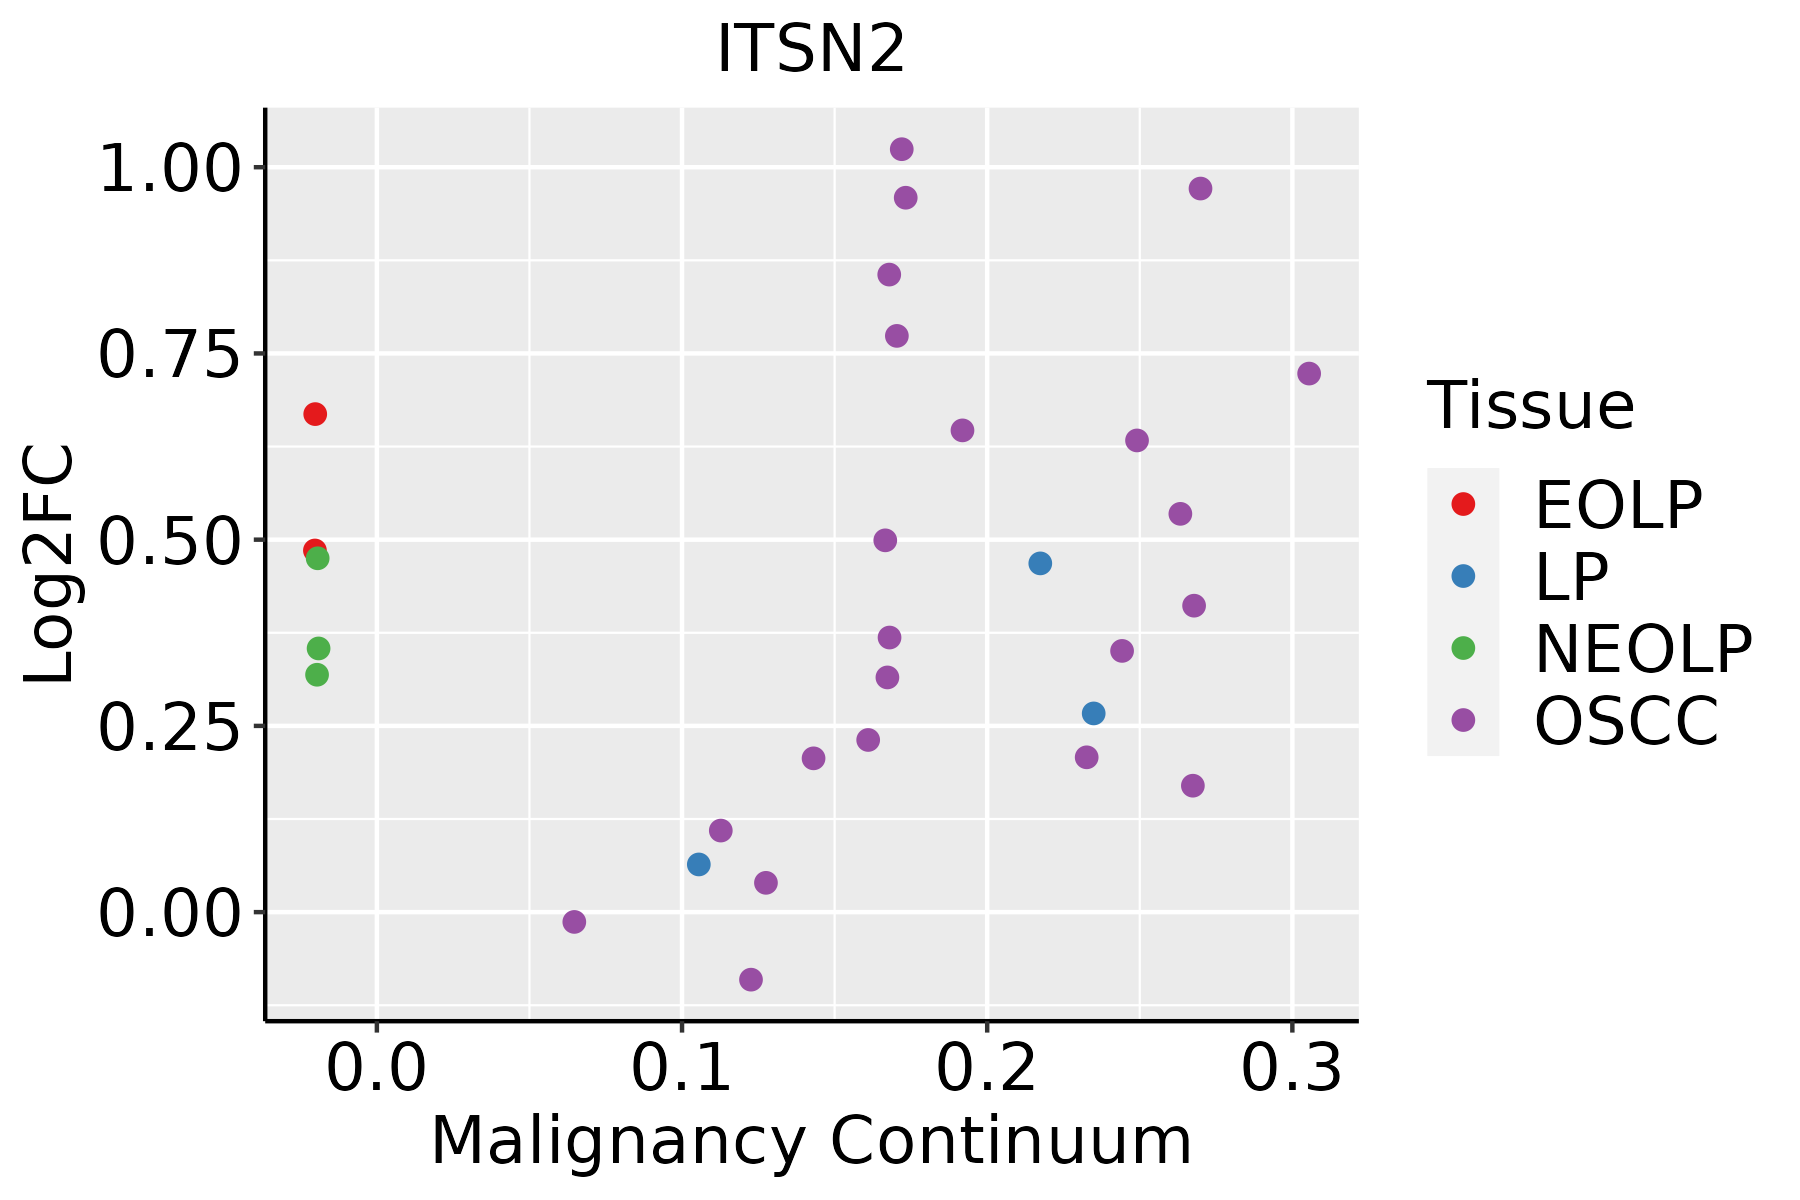 | EOLP: Erosive Oral lichen planus |
| LP: leukoplakia |
| NEOLP: Non-erosive oral lichen planus |
| OSCC: Oral squamous cell carcinoma |
| Skin | 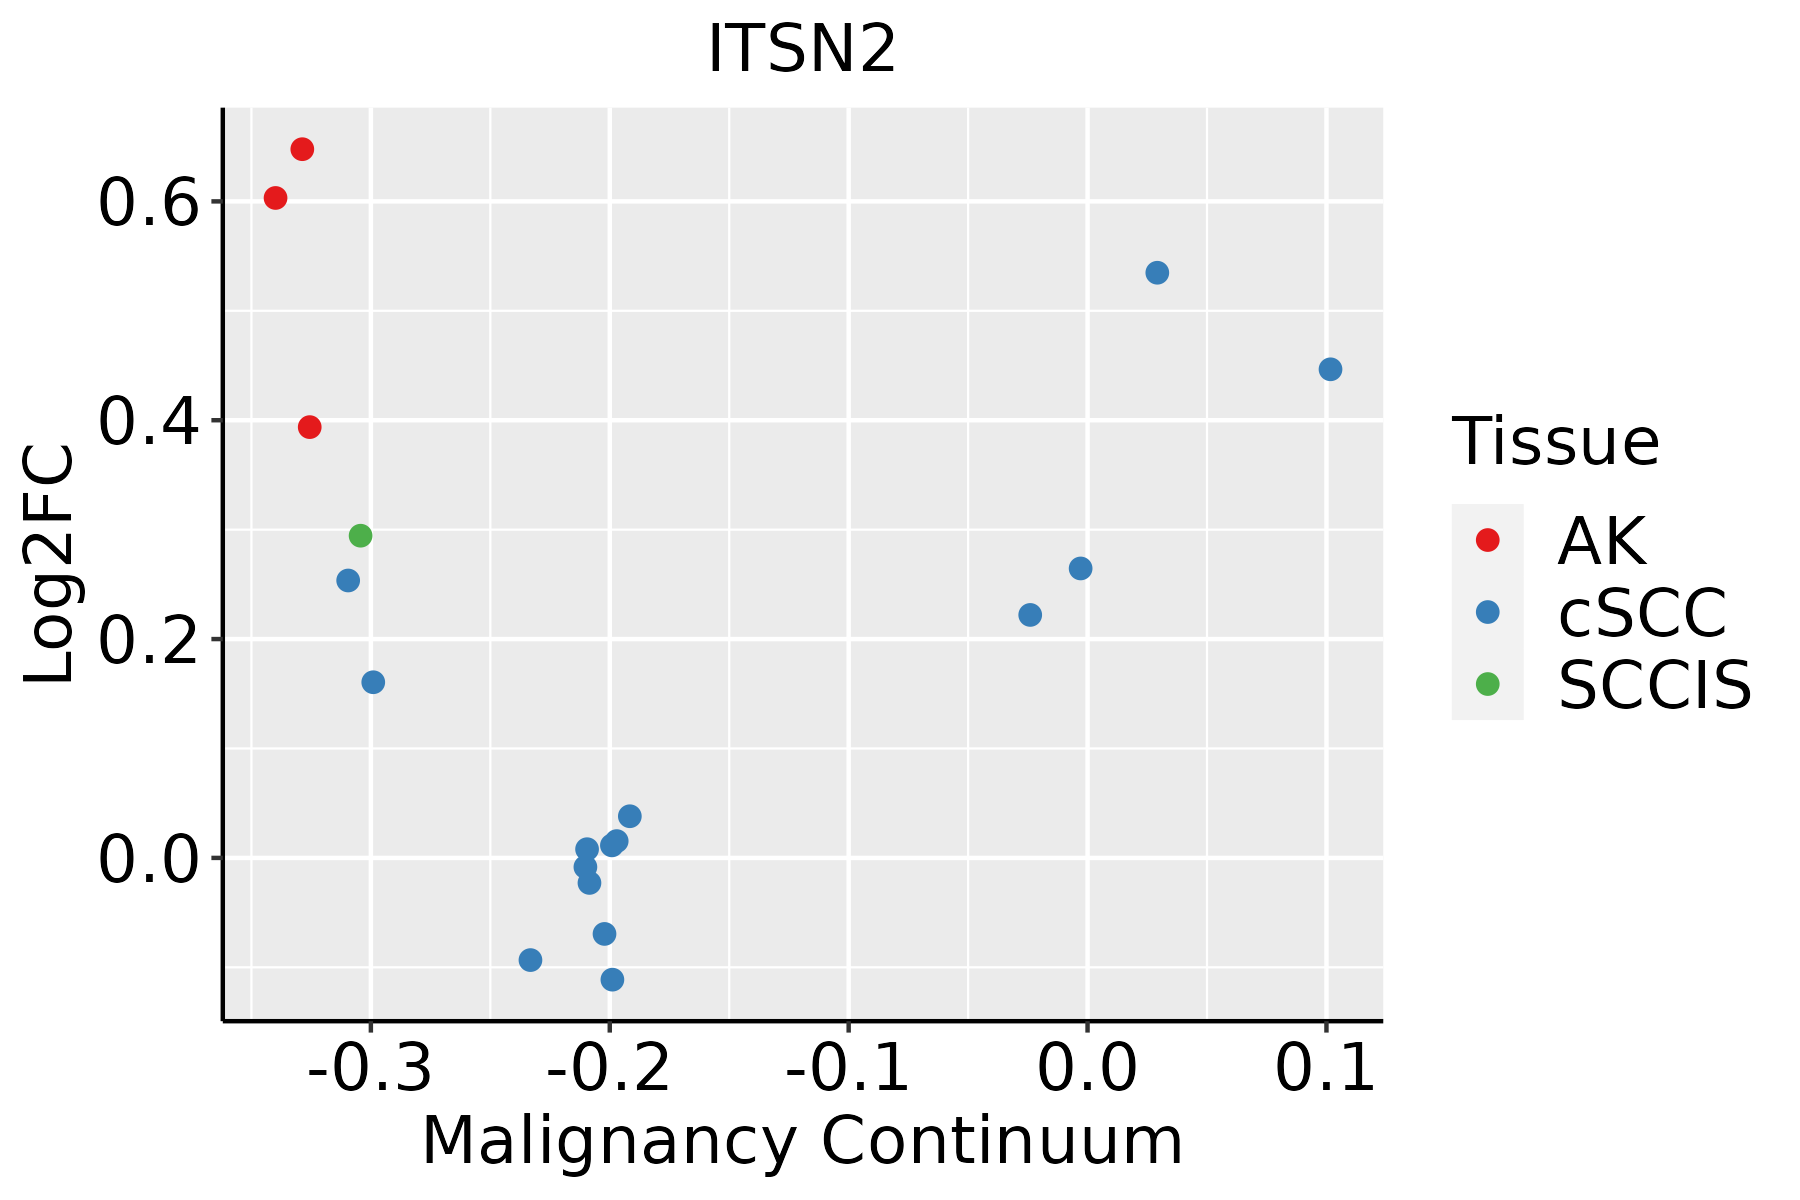 | AK: Actinic keratosis |
| cSCC: Cutaneous squamous cell carcinoma |
| SCCIS:squamous cell carcinoma in situ |
| Thyroid |  | ATC: Anaplastic thyroid cancer |
| HT: Hashimoto's thyroiditis |
| PTC: Papillary thyroid cancer |
| GO ID | Tissue | Disease Stage | Description | Gene Ratio | Bg Ratio | pvalue | p.adjust | Count |
| GO:002260410 | Cervix | CC | regulation of cell morphogenesis | 84/2311 | 309/18723 | 1.00e-12 | 4.29e-10 | 84 |
| GO:00160498 | Cervix | CC | cell growth | 92/2311 | 482/18723 | 1.16e-05 | 2.49e-04 | 92 |
| GO:00068987 | Cervix | CC | receptor-mediated endocytosis | 53/2311 | 244/18723 | 2.52e-05 | 4.29e-04 | 53 |
| GO:00725836 | Cervix | CC | clathrin-dependent endocytosis | 16/2311 | 47/18723 | 9.56e-05 | 1.25e-03 | 16 |
| GO:00459277 | Cervix | CC | positive regulation of growth | 53/2311 | 259/18723 | 1.33e-04 | 1.64e-03 | 53 |
| GO:00015588 | Cervix | CC | regulation of cell growth | 77/2311 | 414/18723 | 1.40e-04 | 1.70e-03 | 77 |
| GO:00161977 | Cervix | CC | endosomal transport | 48/2311 | 230/18723 | 1.65e-04 | 1.97e-03 | 48 |
| GO:00995322 | Cervix | CC | synaptic vesicle endosomal processing | 6/2311 | 10/18723 | 4.73e-04 | 4.68e-03 | 6 |
| GO:00303077 | Cervix | CC | positive regulation of cell growth | 36/2311 | 166/18723 | 4.84e-04 | 4.75e-03 | 36 |
| GO:00486386 | Cervix | CC | regulation of developmental growth | 61/2311 | 330/18723 | 7.69e-04 | 6.85e-03 | 61 |
| GO:00605606 | Cervix | CC | developmental growth involved in morphogenesis | 46/2311 | 234/18723 | 8.82e-04 | 7.63e-03 | 46 |
| GO:00484883 | Cervix | CC | synaptic vesicle endocytosis | 16/2311 | 62/18723 | 2.87e-03 | 1.91e-02 | 16 |
| GO:01402383 | Cervix | CC | presynaptic endocytosis | 16/2311 | 62/18723 | 2.87e-03 | 1.91e-02 | 16 |
| GO:19901385 | Cervix | CC | neuron projection extension | 34/2311 | 172/18723 | 3.52e-03 | 2.27e-02 | 34 |
| GO:00486395 | Cervix | CC | positive regulation of developmental growth | 33/2311 | 174/18723 | 7.65e-03 | 4.07e-02 | 33 |
| GO:00485886 | Cervix | CC | developmental cell growth | 42/2311 | 234/18723 | 7.88e-03 | 4.15e-02 | 42 |
| GO:00364655 | Cervix | CC | synaptic vesicle recycling | 17/2311 | 75/18723 | 8.87e-03 | 4.53e-02 | 17 |
| GO:0016197 | Colorectum | AD | endosomal transport | 90/3918 | 230/18723 | 1.88e-10 | 1.73e-08 | 90 |
| GO:0022604 | Colorectum | AD | regulation of cell morphogenesis | 109/3918 | 309/18723 | 3.08e-09 | 2.07e-07 | 109 |
| GO:0016049 | Colorectum | AD | cell growth | 143/3918 | 482/18723 | 2.83e-06 | 8.09e-05 | 143 |
| Hugo Symbol | Variant Class | Variant Classification | dbSNP RS | HGVSc | HGVSp | HGVSp Short | SWISSPROT | BIOTYPE | SIFT | PolyPhen | Tumor Sample Barcode | Tissue | Histology | Sex | Age | Stage | Therapy Types | Drugs | Outcome |
| ITSN2 | SNV | Missense_Mutation | | c.700N>T | p.Gly234Trp | p.G234W | Q9NZM3 | protein_coding | deleterious(0) | probably_damaging(0.971) | TCGA-A8-A08L-01 | Breast | breast invasive carcinoma | Female | >=65 | III/IV | Unknown | Unknown | SD |
| ITSN2 | SNV | Missense_Mutation | | c.4803N>C | p.Gln1601His | p.Q1601H | Q9NZM3 | protein_coding | deleterious(0.01) | probably_damaging(0.999) | TCGA-AC-A23H-01 | Breast | breast invasive carcinoma | Female | >=65 | I/II | Unknown | Unknown | PD |
| ITSN2 | SNV | Missense_Mutation | | c.707N>T | p.Ser236Leu | p.S236L | Q9NZM3 | protein_coding | tolerated(0.16) | benign(0.141) | TCGA-BH-A0HL-01 | Breast | breast invasive carcinoma | Female | <65 | I/II | Chemotherapy | cyclophosphamide | SD |
| ITSN2 | SNV | Missense_Mutation | | c.2516N>G | p.Ser839Cys | p.S839C | Q9NZM3 | protein_coding | deleterious(0.03) | benign(0.286) | TCGA-C8-A12Q-01 | Breast | breast invasive carcinoma | Female | >=65 | III/IV | Unknown | Unknown | PD |
| ITSN2 | SNV | Missense_Mutation | | c.3047N>T | p.Glu1016Val | p.E1016V | Q9NZM3 | protein_coding | deleterious(0) | possibly_damaging(0.857) | TCGA-C8-A1HJ-01 | Breast | breast invasive carcinoma | Female | <65 | I/II | Unknown | Unknown | SD |
| ITSN2 | SNV | Missense_Mutation | | c.338N>A | p.Ile113Asn | p.I113N | Q9NZM3 | protein_coding | tolerated(0.2) | benign(0.105) | TCGA-C8-A26Y-01 | Breast | breast invasive carcinoma | Female | >=65 | I/II | Unknown | Unknown | SD |
| ITSN2 | SNV | Missense_Mutation | novel | c.3318N>T | p.Trp1106Cys | p.W1106C | Q9NZM3 | protein_coding | deleterious(0) | benign(0.157) | TCGA-D8-A1JK-01 | Breast | breast invasive carcinoma | Female | >=65 | I/II | Unknown | Unknown | SD |
| ITSN2 | SNV | Missense_Mutation | | c.335N>C | p.Leu112Ser | p.L112S | Q9NZM3 | protein_coding | tolerated(0.66) | benign(0.124) | TCGA-D8-A1XK-01 | Breast | breast invasive carcinoma | Female | <65 | I/II | Chemotherapy | doxorubicine+cyclophosphamide | SD |
| ITSN2 | SNV | Missense_Mutation | | c.2203N>C | p.Ala735Pro | p.A735P | Q9NZM3 | protein_coding | tolerated(0.32) | benign(0.043) | TCGA-D8-A27F-01 | Breast | breast invasive carcinoma | Female | <65 | I/II | Chemotherapy | adriamycin+cyclophosphamide | SD |
| ITSN2 | SNV | Missense_Mutation | | c.2359G>A | p.Asp787Asn | p.D787N | Q9NZM3 | protein_coding | deleterious(0.04) | possibly_damaging(0.836) | TCGA-E2-A159-01 | Breast | breast invasive carcinoma | Female | <65 | I/II | Chemotherapy | cyclophosphamide | SD |


