
|
|||||
|
 | |
| |
| |
| |
| |
| |
|
Gene: ITPRIP |
Gene summary for ITPRIP |
| Gene information | Species | Human | Gene symbol | ITPRIP | Gene ID | 85450 |
| Gene name | inositol 1,4,5-trisphosphate receptor interacting protein | |
| Gene Alias | DANGER | |
| Cytomap | 10q25.1 | |
| Gene Type | protein-coding | GO ID | GO:0006915 | UniProtAcc | Q8IWB1 |
Top |
Malignant transformation analysis |
| Identification of the aberrant gene expression in precancerous and cancerous lesions by comparing the gene expression of stem-like cells in diseased tissues with normal stem cells |
| Entrez ID | Symbol | Replicates | Species | Organ | Tissue | Adj P-value | Log2FC | Malignancy |
| 85450 | ITPRIP | C21 | Human | Oral cavity | OSCC | 1.64e-11 | 5.12e-01 | 0.2678 |
| 85450 | ITPRIP | C30 | Human | Oral cavity | OSCC | 5.90e-08 | 5.22e-01 | 0.3055 |
| 85450 | ITPRIP | C43 | Human | Oral cavity | OSCC | 3.61e-02 | 1.76e-01 | 0.1704 |
| 85450 | ITPRIP | C51 | Human | Oral cavity | OSCC | 2.97e-02 | 2.32e-01 | 0.2674 |
| 85450 | ITPRIP | C57 | Human | Oral cavity | OSCC | 8.17e-07 | 2.38e-01 | 0.1679 |
| 85450 | ITPRIP | C09 | Human | Oral cavity | OSCC | 3.13e-09 | 4.26e-01 | 0.1431 |
| 85450 | ITPRIP | male-WTA | Human | Thyroid | PTC | 1.23e-07 | 4.68e-03 | 0.1037 |
| 85450 | ITPRIP | PTC01 | Human | Thyroid | PTC | 1.06e-03 | 1.41e-02 | 0.1899 |
| 85450 | ITPRIP | PTC04 | Human | Thyroid | PTC | 5.70e-11 | 7.28e-02 | 0.1927 |
| 85450 | ITPRIP | PTC06 | Human | Thyroid | PTC | 9.75e-10 | 2.29e-01 | 0.2057 |
| 85450 | ITPRIP | PTC07 | Human | Thyroid | PTC | 6.57e-10 | 6.63e-02 | 0.2044 |
| 85450 | ITPRIP | ATC11 | Human | Thyroid | ATC | 2.27e-08 | 5.56e-01 | 0.3386 |
| 85450 | ITPRIP | ATC12 | Human | Thyroid | ATC | 3.95e-16 | 1.65e-01 | 0.34 |
| 85450 | ITPRIP | ATC13 | Human | Thyroid | ATC | 6.64e-05 | 2.23e-02 | 0.34 |
| 85450 | ITPRIP | ATC2 | Human | Thyroid | ATC | 2.50e-03 | 5.25e-01 | 0.34 |
| 85450 | ITPRIP | ATC3 | Human | Thyroid | ATC | 5.64e-11 | 5.31e-01 | 0.338 |
| 85450 | ITPRIP | ATC4 | Human | Thyroid | ATC | 3.53e-09 | 2.84e-01 | 0.34 |
| 85450 | ITPRIP | ATC5 | Human | Thyroid | ATC | 6.23e-10 | 3.08e-02 | 0.34 |
| Page: 1 |
| Tissue | Expression Dynamics | Abbreviation |
| Oral Cavity |  | EOLP: Erosive Oral lichen planus |
| LP: leukoplakia | ||
| NEOLP: Non-erosive oral lichen planus | ||
| OSCC: Oral squamous cell carcinoma | ||
| Thyroid | 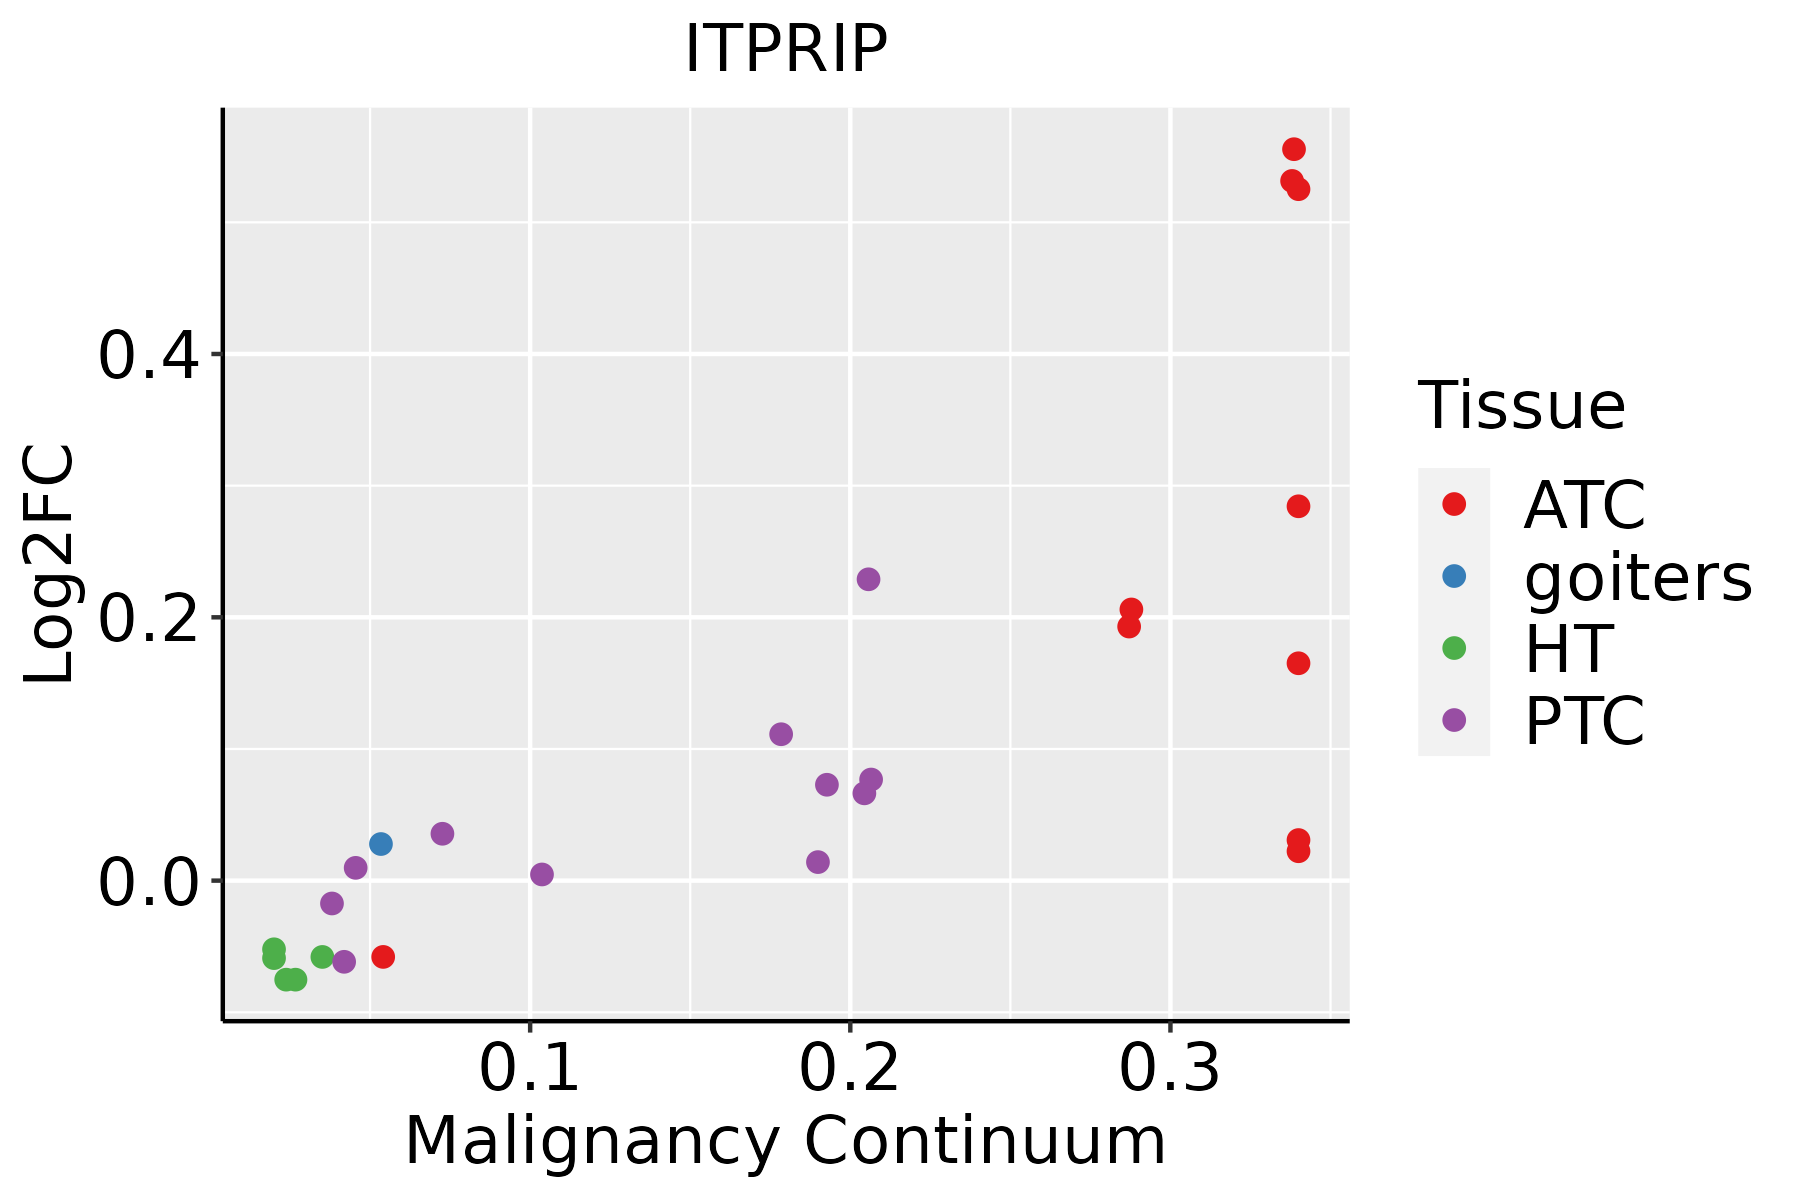 | ATC: Anaplastic thyroid cancer |
| HT: Hashimoto's thyroiditis | ||
| PTC: Papillary thyroid cancer |
| ∗log2FC in expression of this searched gene in stem-like cells from each diseased tissue sample relative to stem-like cells in normal samples in each tissue plotted against the malignancy continuum. Samples are colored based on if they are from different disease stage. |
Top |
Malignant transformation related pathway analysis |
| Find out the enriched GO biological processes and KEGG pathways involved in transition from healthy to precancer to cancer |
| Tissue | Disease Stage | Enriched GO biological Processes |
| Colorectum | AD |  |
| Colorectum | SER |  |
| Colorectum | MSS |  |
| Colorectum | MSI-H |  |
| Colorectum | FAP |  |
| ∗Top 15 enriched GO BP terms are showed in the bar plot of each disease state in each tissue. Each row represents a significant GO biological process which is colored according to the -log10(p.adjust). |
| Page: 1 2 3 4 5 6 7 8 9 |
| GO ID | Tissue | Disease Stage | Description | Gene Ratio | Bg Ratio | pvalue | p.adjust | Count |
| GO:200123320 | Oral cavity | OSCC | regulation of apoptotic signaling pathway | 242/7305 | 356/18723 | 6.66e-29 | 3.24e-26 | 242 |
| GO:200123420 | Oral cavity | OSCC | negative regulation of apoptotic signaling pathway | 148/7305 | 224/18723 | 1.71e-16 | 1.36e-14 | 148 |
| GO:009719120 | Oral cavity | OSCC | extrinsic apoptotic signaling pathway | 142/7305 | 219/18723 | 7.34e-15 | 4.55e-13 | 142 |
| GO:200123620 | Oral cavity | OSCC | regulation of extrinsic apoptotic signaling pathway | 100/7305 | 151/18723 | 1.07e-11 | 3.90e-10 | 100 |
| GO:000862516 | Oral cavity | OSCC | extrinsic apoptotic signaling pathway via death domain receptors | 53/7305 | 82/18723 | 2.30e-06 | 2.92e-05 | 53 |
| GO:200123720 | Oral cavity | OSCC | negative regulation of extrinsic apoptotic signaling pathway | 60/7305 | 97/18723 | 4.31e-06 | 4.98e-05 | 60 |
| GO:190204115 | Oral cavity | OSCC | regulation of extrinsic apoptotic signaling pathway via death domain receptors | 33/7305 | 49/18723 | 5.49e-05 | 4.54e-04 | 33 |
| GO:2001233113 | Thyroid | PTC | regulation of apoptotic signaling pathway | 197/5968 | 356/18723 | 2.58e-20 | 3.69e-18 | 197 |
| GO:2001234113 | Thyroid | PTC | negative regulation of apoptotic signaling pathway | 124/5968 | 224/18723 | 2.57e-13 | 1.32e-11 | 124 |
| GO:0097191113 | Thyroid | PTC | extrinsic apoptotic signaling pathway | 117/5968 | 219/18723 | 2.73e-11 | 1.03e-09 | 117 |
| GO:2001236113 | Thyroid | PTC | regulation of extrinsic apoptotic signaling pathway | 82/5968 | 151/18723 | 9.01e-09 | 2.18e-07 | 82 |
| GO:000862523 | Thyroid | PTC | extrinsic apoptotic signaling pathway via death domain receptors | 47/5968 | 82/18723 | 1.70e-06 | 2.38e-05 | 47 |
| GO:2001237113 | Thyroid | PTC | negative regulation of extrinsic apoptotic signaling pathway | 51/5968 | 97/18723 | 1.83e-05 | 1.88e-04 | 51 |
| GO:190204120 | Thyroid | PTC | regulation of extrinsic apoptotic signaling pathway via death domain receptors | 29/5968 | 49/18723 | 7.32e-05 | 6.31e-04 | 29 |
| GO:19020426 | Thyroid | PTC | negative regulation of extrinsic apoptotic signaling pathway via death domain receptors | 17/5968 | 31/18723 | 6.74e-03 | 2.90e-02 | 17 |
| GO:200123335 | Thyroid | ATC | regulation of apoptotic signaling pathway | 206/6293 | 356/18723 | 2.81e-21 | 5.92e-19 | 206 |
| GO:2001234210 | Thyroid | ATC | negative regulation of apoptotic signaling pathway | 129/6293 | 224/18723 | 1.26e-13 | 6.46e-12 | 129 |
| GO:0097191210 | Thyroid | ATC | extrinsic apoptotic signaling pathway | 125/6293 | 219/18723 | 7.19e-13 | 3.16e-11 | 125 |
| GO:2001236210 | Thyroid | ATC | regulation of extrinsic apoptotic signaling pathway | 89/6293 | 151/18723 | 1.43e-10 | 4.40e-09 | 89 |
| GO:0008625111 | Thyroid | ATC | extrinsic apoptotic signaling pathway via death domain receptors | 50/6293 | 82/18723 | 3.47e-07 | 5.13e-06 | 50 |
| Page: 1 2 |
| Pathway ID | Tissue | Disease Stage | Description | Gene Ratio | Bg Ratio | pvalue | p.adjust | qvalue | Count |
| Page: 1 |
Top |
Cell-cell communication analysis |
| Identification of potential cell-cell interactions between two cell types and their ligand-receptor pairs for different disease states |
| Ligand | Receptor | LRpair | Pathway | Tissue | Disease Stage |
| Page: 1 |
Top |
Single-cell gene regulatory network inference analysis |
| Find out the significant the regulons (TFs) and the target genes of each regulon across cell types for different disease states |
| TF | Cell Type | Tissue | Disease Stage | Target Gene | RSS | Regulon Activity |
| ∗The dot plots of a searched regulon are shown for all cell subpopulations in each disease state of each tissue based on the regulon specific score inferred using pySCENIC and by calculating the average expression. |
| Page: 1 |
Top |
Somatic mutation of malignant transformation related genes |
| Annotation of somatic variants for genes involved in malignant transformation |
| Hugo Symbol | Variant Class | Variant Classification | dbSNP RS | HGVSc | HGVSp | HGVSp Short | SWISSPROT | BIOTYPE | SIFT | PolyPhen | Tumor Sample Barcode | Tissue | Histology | Sex | Age | Stage | Therapy Types | Drugs | Outcome |
| ITPRIP | SNV | Missense_Mutation | rs557384863 | c.1529G>A | p.Arg510Gln | p.R510Q | Q8IWB1 | protein_coding | deleterious(0.01) | probably_damaging(0.965) | TCGA-AC-A23H-01 | Breast | breast invasive carcinoma | Female | >=65 | I/II | Unknown | Unknown | PD |
| ITPRIP | SNV | Missense_Mutation | rs756046738 | c.247C>T | p.Arg83Cys | p.R83C | Q8IWB1 | protein_coding | tolerated(0.09) | benign(0.353) | TCGA-E2-A14V-01 | Breast | breast invasive carcinoma | Female | <65 | I/II | Chemotherapy | cyclophosphamide | SD |
| ITPRIP | SNV | Missense_Mutation | novel | c.958N>C | p.Glu320Gln | p.E320Q | Q8IWB1 | protein_coding | deleterious(0.01) | probably_damaging(0.982) | TCGA-LL-A5YP-01 | Breast | breast invasive carcinoma | Female | <65 | I/II | Chemotherapy | cytoxan | SD |
| ITPRIP | insertion | Nonsense_Mutation | novel | c.84_85insTAAAACTTTTCAAAAAGAATTGAGAGT | p.Ala28_Thr29insTer | p.A28_T29ins* | Q8IWB1 | protein_coding | TCGA-A8-A0A4-01 | Breast | breast invasive carcinoma | Female | >=65 | I/II | Hormone Therapy | tamoxiphen | CR | ||
| ITPRIP | deletion | Frame_Shift_Del | novel | c.406delC | p.Leu136CysfsTer40 | p.L136Cfs*40 | Q8IWB1 | protein_coding | TCGA-D8-A27V-01 | Breast | breast invasive carcinoma | Female | <65 | I/II | Hormone Therapy | tamoxiphen | SD | ||
| ITPRIP | SNV | Missense_Mutation | rs756046738 | c.247C>T | p.Arg83Cys | p.R83C | Q8IWB1 | protein_coding | tolerated(0.09) | benign(0.353) | TCGA-2W-A8YY-01 | Cervix | cervical & endocervical cancer | Female | <65 | I/II | Chemotherapy | cisplatin | CR |
| ITPRIP | SNV | Missense_Mutation | c.71N>T | p.Pro24Leu | p.P24L | Q8IWB1 | protein_coding | deleterious(0) | possibly_damaging(0.632) | TCGA-EK-A3GJ-01 | Cervix | cervical & endocervical cancer | Female | <65 | I/II | Unknown | Unknown | SD | |
| ITPRIP | SNV | Missense_Mutation | rs750228977 | c.1438N>A | p.Gly480Ser | p.G480S | Q8IWB1 | protein_coding | deleterious(0) | probably_damaging(1) | TCGA-AA-3678-01 | Colorectum | colon adenocarcinoma | Female | <65 | III/IV | Chemotherapy | folinic | CR |
| ITPRIP | SNV | Missense_Mutation | c.307N>C | p.Trp103Arg | p.W103R | Q8IWB1 | protein_coding | deleterious(0.01) | possibly_damaging(0.467) | TCGA-AA-3715-01 | Colorectum | colon adenocarcinoma | Male | >=65 | I/II | Unknown | Unknown | PD | |
| ITPRIP | SNV | Missense_Mutation | rs776290130 | c.787N>A | p.Gly263Arg | p.G263R | Q8IWB1 | protein_coding | deleterious(0) | possibly_damaging(0.821) | TCGA-AA-A022-01 | Colorectum | colon adenocarcinoma | Female | >=65 | I/II | Unknown | Unknown | SD |
| Page: 1 2 3 4 5 6 |
Top |
Related drugs of malignant transformation related genes |
| Identification of chemicals and drugs interact with genes involved in malignant transfromation |
| (DGIdb 4.0) |
| Entrez ID | Symbol | Category | Interaction Types | Drug Claim Name | Drug Name | PMIDs |
| Page: 1 |

Copyright 2023-Present -The University of Texas Health Science Center at Houston |