
|
|||||
|
 | |
| |
| |
| |
| |
| |
|
Gene: ITPR3 |
Gene summary for ITPR3 |
| Gene information | Species | Human | Gene symbol | ITPR3 | Gene ID | 3710 |
| Gene name | inositol 1,4,5-trisphosphate receptor type 3 | |
| Gene Alias | IP3R | |
| Cytomap | 6p21.31 | |
| Gene Type | protein-coding | GO ID | GO:0003008 | UniProtAcc | A6H8K3 |
Top |
Malignant transformation analysis |
| Identification of the aberrant gene expression in precancerous and cancerous lesions by comparing the gene expression of stem-like cells in diseased tissues with normal stem cells |
| Entrez ID | Symbol | Replicates | Species | Organ | Tissue | Adj P-value | Log2FC | Malignancy |
| 3710 | ITPR3 | LZE4T | Human | Esophagus | ESCC | 8.36e-03 | 1.01e-01 | 0.0811 |
| 3710 | ITPR3 | LZE5T | Human | Esophagus | ESCC | 6.19e-06 | 3.59e-01 | 0.0514 |
| 3710 | ITPR3 | LZE7T | Human | Esophagus | ESCC | 4.84e-16 | 6.19e-01 | 0.0667 |
| 3710 | ITPR3 | LZE8T | Human | Esophagus | ESCC | 2.12e-05 | 5.86e-02 | 0.067 |
| 3710 | ITPR3 | LZE20T | Human | Esophagus | ESCC | 8.79e-03 | 7.72e-02 | 0.0662 |
| 3710 | ITPR3 | LZE21D1 | Human | Esophagus | HGIN | 6.44e-06 | 4.12e-01 | 0.0632 |
| 3710 | ITPR3 | LZE22D1 | Human | Esophagus | HGIN | 3.91e-02 | 1.78e-01 | 0.0595 |
| 3710 | ITPR3 | LZE22T | Human | Esophagus | ESCC | 6.95e-11 | 3.84e-01 | 0.068 |
| 3710 | ITPR3 | LZE24T | Human | Esophagus | ESCC | 4.92e-10 | 2.36e-01 | 0.0596 |
| 3710 | ITPR3 | LZE22D3 | Human | Esophagus | HGIN | 1.54e-02 | 3.10e-01 | 0.0653 |
| 3710 | ITPR3 | LZE21T | Human | Esophagus | ESCC | 2.88e-10 | 5.78e-01 | 0.0655 |
| 3710 | ITPR3 | LZE6T | Human | Esophagus | ESCC | 5.70e-07 | 1.35e-01 | 0.0845 |
| 3710 | ITPR3 | P1T-E | Human | Esophagus | ESCC | 2.11e-14 | 6.58e-01 | 0.0875 |
| 3710 | ITPR3 | P2T-E | Human | Esophagus | ESCC | 1.63e-29 | 5.51e-01 | 0.1177 |
| 3710 | ITPR3 | P4T-E | Human | Esophagus | ESCC | 1.28e-17 | 2.67e-01 | 0.1323 |
| 3710 | ITPR3 | P5T-E | Human | Esophagus | ESCC | 4.05e-12 | 2.40e-01 | 0.1327 |
| 3710 | ITPR3 | P8T-E | Human | Esophagus | ESCC | 1.37e-11 | 2.13e-01 | 0.0889 |
| 3710 | ITPR3 | P9T-E | Human | Esophagus | ESCC | 1.55e-15 | 3.75e-01 | 0.1131 |
| 3710 | ITPR3 | P10T-E | Human | Esophagus | ESCC | 7.26e-40 | 7.74e-01 | 0.116 |
| 3710 | ITPR3 | P11T-E | Human | Esophagus | ESCC | 1.27e-09 | 5.21e-01 | 0.1426 |
| Page: 1 2 3 4 5 6 7 |
| Tissue | Expression Dynamics | Abbreviation |
| Esophagus | 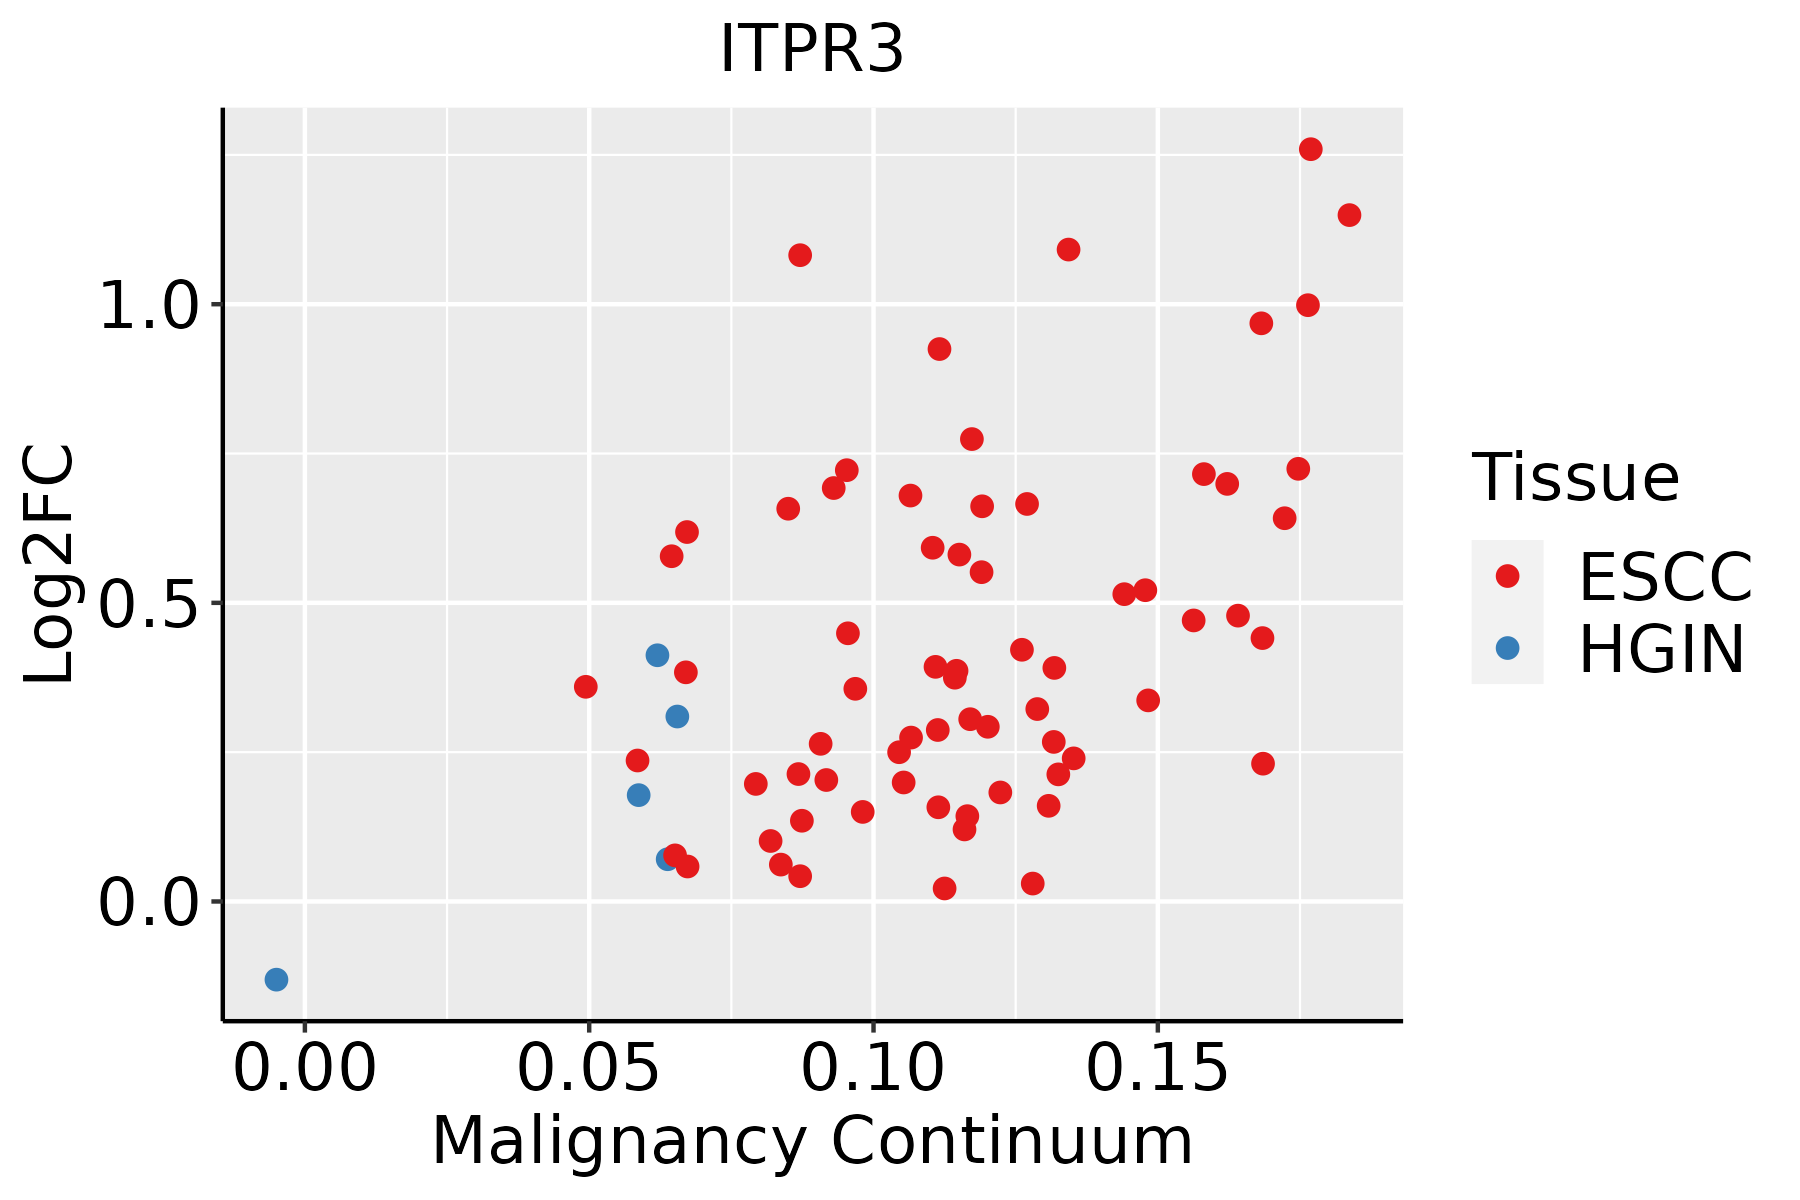 | ESCC: Esophageal squamous cell carcinoma |
| HGIN: High-grade intraepithelial neoplasias | ||
| LGIN: Low-grade intraepithelial neoplasias | ||
| Lung | 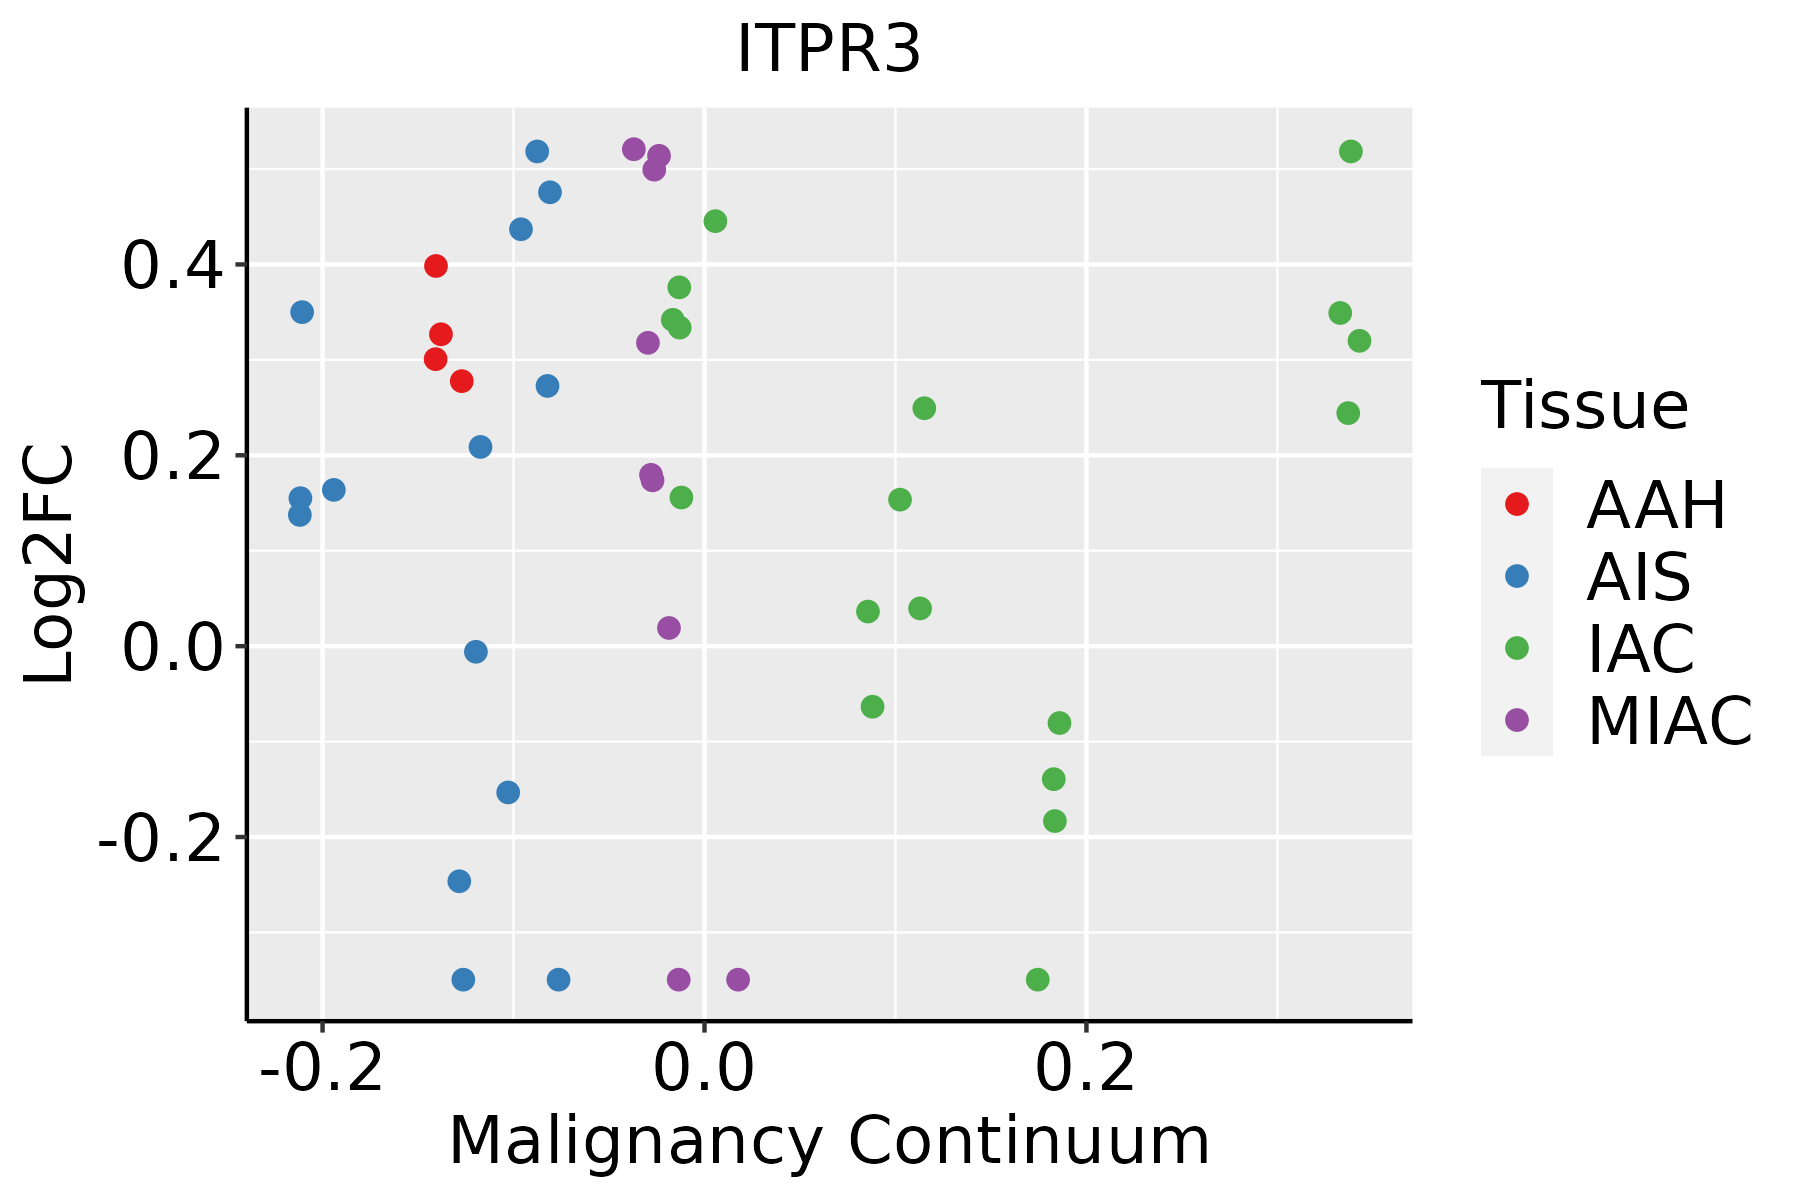 | AAH: Atypical adenomatous hyperplasia |
| AIS: Adenocarcinoma in situ | ||
| IAC: Invasive lung adenocarcinoma | ||
| MIA: Minimally invasive adenocarcinoma | ||
| Oral Cavity | 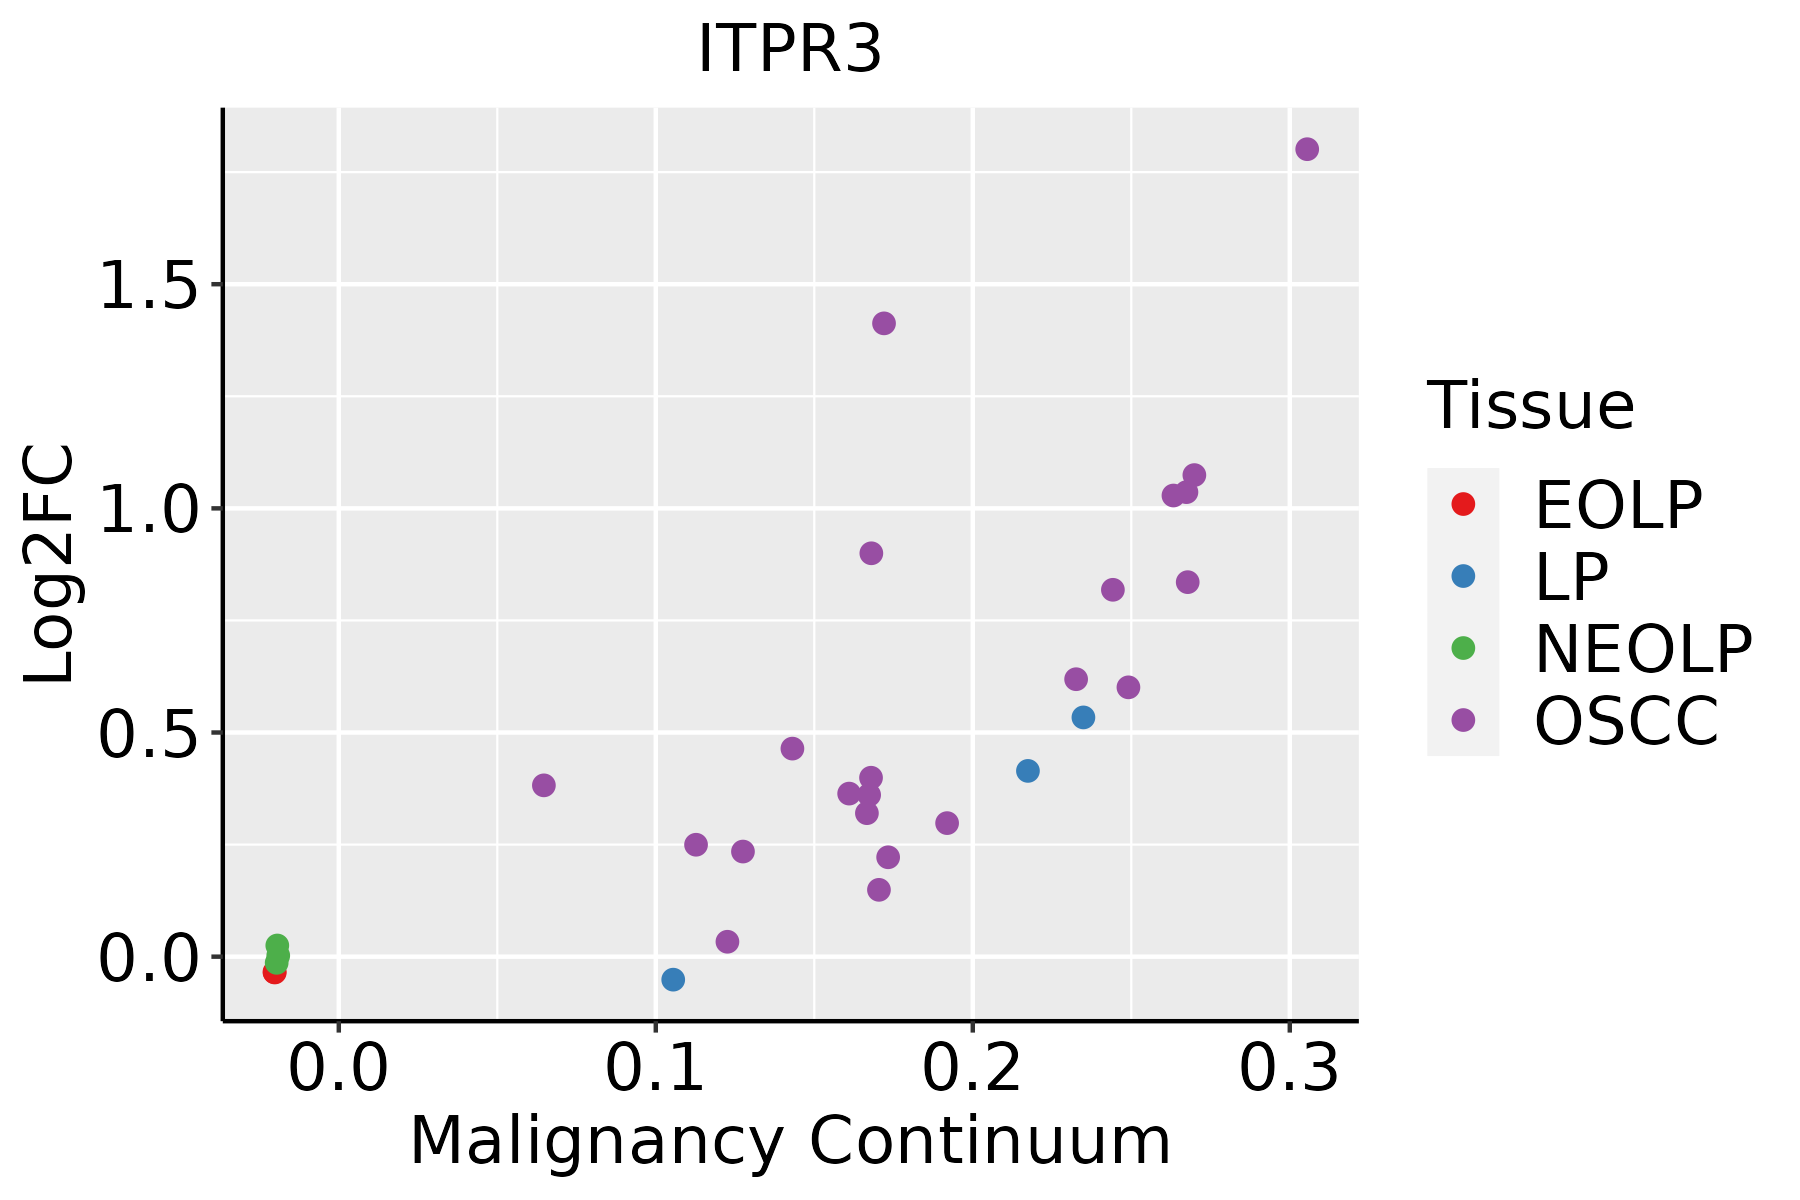 | EOLP: Erosive Oral lichen planus |
| LP: leukoplakia | ||
| NEOLP: Non-erosive oral lichen planus | ||
| OSCC: Oral squamous cell carcinoma | ||
| Skin | 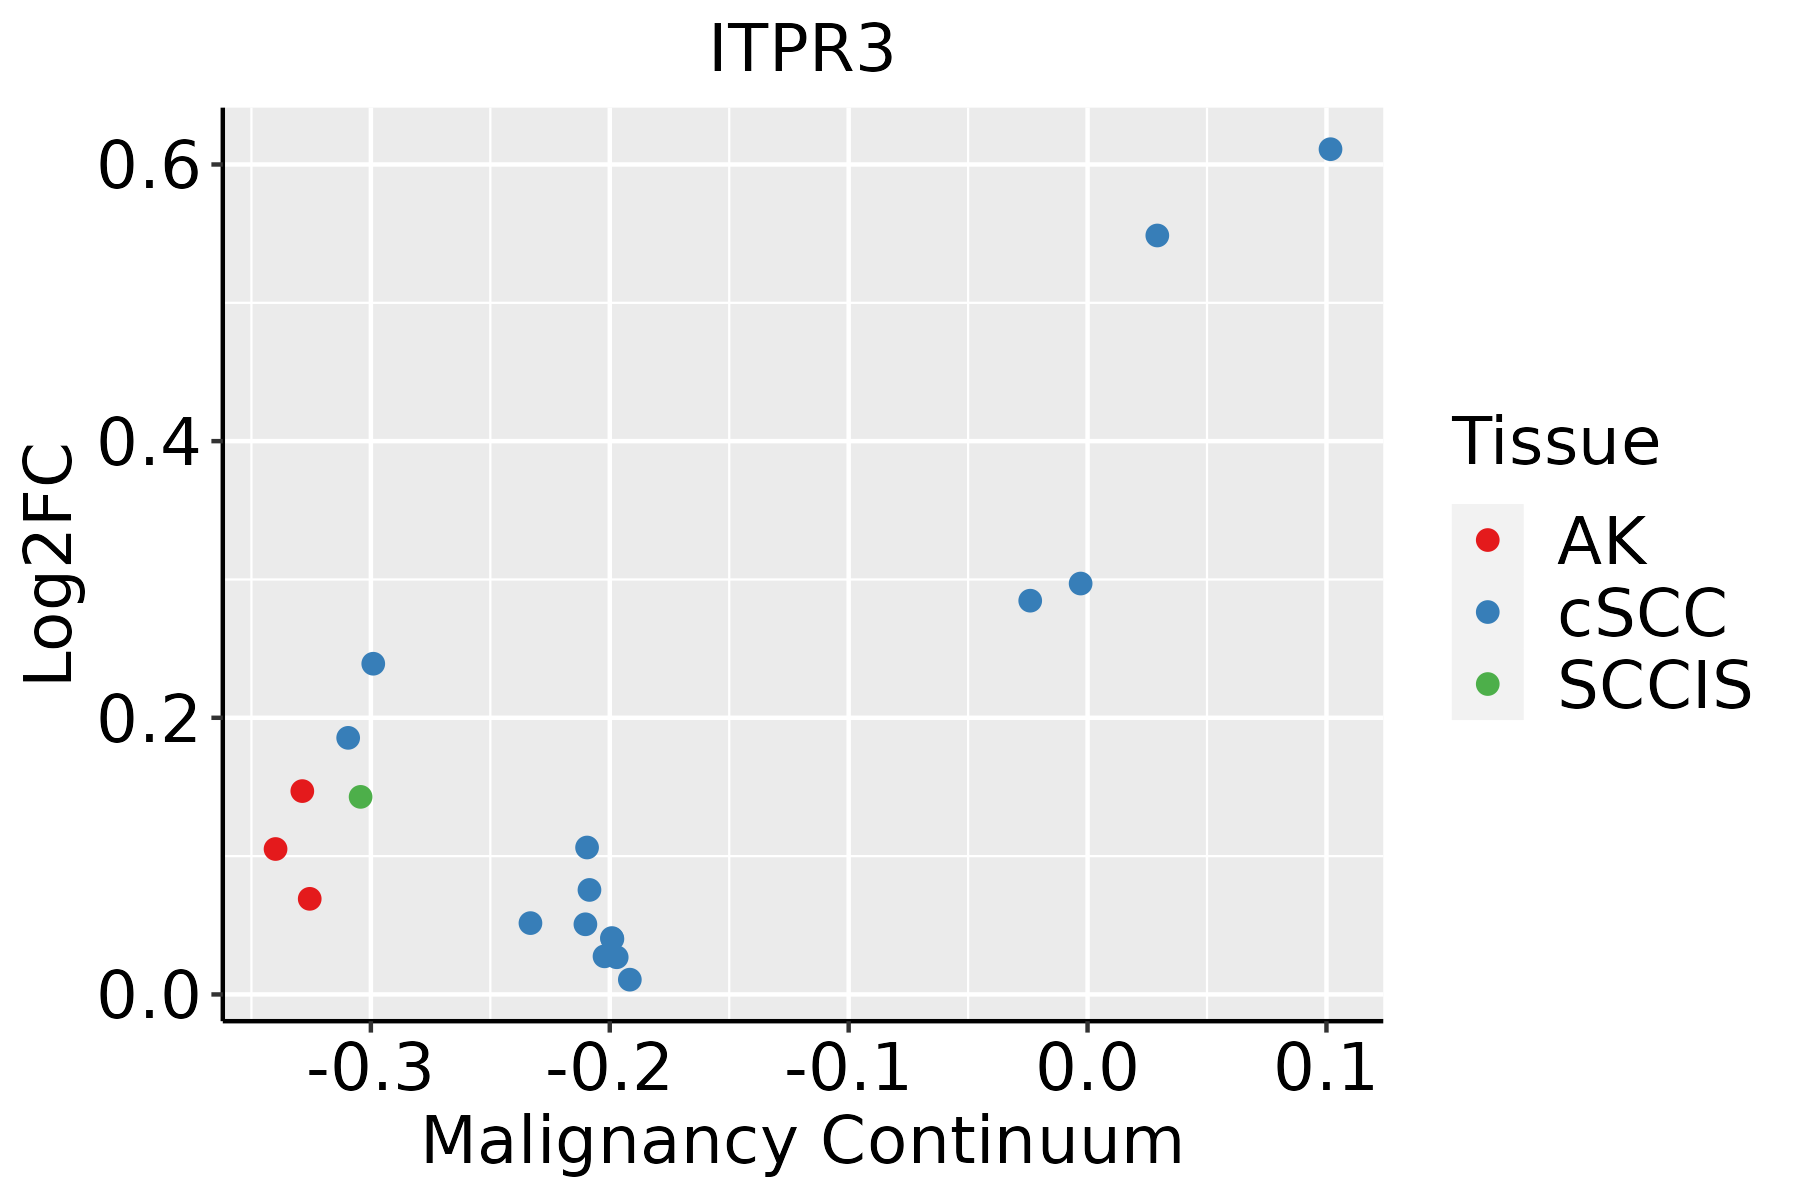 | AK: Actinic keratosis |
| cSCC: Cutaneous squamous cell carcinoma | ||
| SCCIS:squamous cell carcinoma in situ | ||
| Thyroid |  | ATC: Anaplastic thyroid cancer |
| HT: Hashimoto's thyroiditis | ||
| PTC: Papillary thyroid cancer |
| ∗log2FC in expression of this searched gene in stem-like cells from each diseased tissue sample relative to stem-like cells in normal samples in each tissue plotted against the malignancy continuum. Samples are colored based on if they are from different disease stage. |
Top |
Malignant transformation related pathway analysis |
| Find out the enriched GO biological processes and KEGG pathways involved in transition from healthy to precancer to cancer |
| Tissue | Disease Stage | Enriched GO biological Processes |
| Colorectum | AD |  |
| Colorectum | SER |  |
| Colorectum | MSS |  |
| Colorectum | MSI-H |  |
| Colorectum | FAP |  |
| ∗Top 15 enriched GO BP terms are showed in the bar plot of each disease state in each tissue. Each row represents a significant GO biological process which is colored according to the -log10(p.adjust). |
| Page: 1 2 3 4 5 6 7 8 9 |
| GO ID | Tissue | Disease Stage | Description | Gene Ratio | Bg Ratio | pvalue | p.adjust | Count |
| GO:005165126 | Esophagus | HGIN | maintenance of location in cell | 53/2587 | 214/18723 | 1.22e-05 | 3.45e-04 | 53 |
| GO:005123520 | Esophagus | HGIN | maintenance of location | 73/2587 | 327/18723 | 1.73e-05 | 4.71e-04 | 73 |
| GO:0051235110 | Esophagus | ESCC | maintenance of location | 200/8552 | 327/18723 | 1.01e-08 | 2.02e-07 | 200 |
| GO:001003827 | Esophagus | ESCC | response to metal ion | 208/8552 | 373/18723 | 5.02e-05 | 3.90e-04 | 208 |
| GO:0051651111 | Esophagus | ESCC | maintenance of location in cell | 126/8552 | 214/18723 | 6.57e-05 | 5.00e-04 | 126 |
| GO:00512357 | Lung | IAC | maintenance of location | 58/2061 | 327/18723 | 1.66e-04 | 2.96e-03 | 58 |
| GO:00515924 | Lung | IAC | response to calcium ion | 31/2061 | 149/18723 | 3.47e-04 | 5.42e-03 | 31 |
| GO:00100388 | Lung | IAC | response to metal ion | 61/2061 | 373/18723 | 1.02e-03 | 1.22e-02 | 61 |
| GO:00516518 | Lung | IAC | maintenance of location in cell | 39/2061 | 214/18723 | 1.07e-03 | 1.26e-02 | 39 |
| GO:00480162 | Lung | IAC | inositol phosphate-mediated signaling | 14/2061 | 55/18723 | 2.04e-03 | 2.05e-02 | 14 |
| GO:005123512 | Lung | AIS | maintenance of location | 55/1849 | 327/18723 | 5.93e-05 | 1.65e-03 | 55 |
| GO:005159212 | Lung | AIS | response to calcium ion | 30/1849 | 149/18723 | 1.18e-04 | 2.72e-03 | 30 |
| GO:005165113 | Lung | AIS | maintenance of location in cell | 39/1849 | 214/18723 | 1.23e-04 | 2.81e-03 | 39 |
| GO:001003813 | Lung | AIS | response to metal ion | 57/1849 | 373/18723 | 5.80e-04 | 9.01e-03 | 57 |
| GO:004801611 | Lung | AIS | inositol phosphate-mediated signaling | 13/1849 | 55/18723 | 2.25e-03 | 2.39e-02 | 13 |
| GO:0019932 | Lung | AIS | second-messenger-mediated signaling | 46/1849 | 312/18723 | 3.79e-03 | 3.52e-02 | 46 |
| GO:0006816 | Lung | AIS | calcium ion transport | 58/1849 | 422/18723 | 6.08e-03 | 4.98e-02 | 58 |
| GO:001003823 | Lung | MIAC | response to metal ion | 36/967 | 373/18723 | 2.40e-04 | 8.06e-03 | 36 |
| GO:005159222 | Lung | MIAC | response to calcium ion | 18/967 | 149/18723 | 6.87e-04 | 1.59e-02 | 18 |
| GO:00199321 | Lung | MIAC | second-messenger-mediated signaling | 30/967 | 312/18723 | 8.15e-04 | 1.80e-02 | 30 |
| Page: 1 2 |
| Pathway ID | Tissue | Disease Stage | Description | Gene Ratio | Bg Ratio | pvalue | p.adjust | qvalue | Count |
| hsa0501239 | Esophagus | HGIN | Parkinson disease | 124/1383 | 266/8465 | 5.95e-32 | 9.70e-30 | 7.70e-30 | 124 |
| hsa0502030 | Esophagus | HGIN | Prion disease | 117/1383 | 273/8465 | 4.15e-26 | 3.38e-24 | 2.69e-24 | 117 |
| hsa0501430 | Esophagus | HGIN | Amyotrophic lateral sclerosis | 140/1383 | 364/8465 | 2.13e-25 | 1.16e-23 | 9.19e-24 | 140 |
| hsa0502230 | Esophagus | HGIN | Pathways of neurodegeneration - multiple diseases | 153/1383 | 476/8465 | 1.22e-18 | 4.41e-17 | 3.50e-17 | 153 |
| hsa0501030 | Esophagus | HGIN | Alzheimer disease | 130/1383 | 384/8465 | 5.26e-18 | 1.71e-16 | 1.36e-16 | 130 |
| hsa0513139 | Esophagus | HGIN | Shigellosis | 71/1383 | 247/8465 | 4.89e-07 | 7.98e-06 | 6.34e-06 | 71 |
| hsa0501727 | Esophagus | HGIN | Spinocerebellar ataxia | 43/1383 | 143/8465 | 2.68e-05 | 3.64e-04 | 2.89e-04 | 43 |
| hsa0516730 | Esophagus | HGIN | Kaposi sarcoma-associated herpesvirus infection | 51/1383 | 194/8465 | 2.46e-04 | 2.69e-03 | 2.14e-03 | 51 |
| hsa0421828 | Esophagus | HGIN | Cellular senescence | 42/1383 | 156/8465 | 4.94e-04 | 5.03e-03 | 4.00e-03 | 42 |
| hsa0421020 | Esophagus | HGIN | Apoptosis | 36/1383 | 136/8465 | 1.67e-03 | 1.52e-02 | 1.20e-02 | 36 |
| hsa0517029 | Esophagus | HGIN | Human immunodeficiency virus 1 infection | 51/1383 | 212/8465 | 2.16e-03 | 1.90e-02 | 1.51e-02 | 51 |
| hsa046219 | Esophagus | HGIN | NOD-like receptor signaling pathway | 45/1383 | 186/8465 | 3.40e-03 | 2.54e-02 | 2.02e-02 | 45 |
| hsa0472327 | Esophagus | HGIN | Retrograde endocannabinoid signaling | 36/1383 | 148/8465 | 7.52e-03 | 4.63e-02 | 3.68e-02 | 36 |
| hsa0516330 | Esophagus | HGIN | Human cytomegalovirus infection | 51/1383 | 225/8465 | 7.67e-03 | 4.63e-02 | 3.68e-02 | 51 |
| hsa0520528 | Esophagus | HGIN | Proteoglycans in cancer | 47/1383 | 205/8465 | 8.23e-03 | 4.71e-02 | 3.74e-02 | 47 |
| hsa05012114 | Esophagus | HGIN | Parkinson disease | 124/1383 | 266/8465 | 5.95e-32 | 9.70e-30 | 7.70e-30 | 124 |
| hsa05020113 | Esophagus | HGIN | Prion disease | 117/1383 | 273/8465 | 4.15e-26 | 3.38e-24 | 2.69e-24 | 117 |
| hsa05014113 | Esophagus | HGIN | Amyotrophic lateral sclerosis | 140/1383 | 364/8465 | 2.13e-25 | 1.16e-23 | 9.19e-24 | 140 |
| hsa05022113 | Esophagus | HGIN | Pathways of neurodegeneration - multiple diseases | 153/1383 | 476/8465 | 1.22e-18 | 4.41e-17 | 3.50e-17 | 153 |
| hsa05010113 | Esophagus | HGIN | Alzheimer disease | 130/1383 | 384/8465 | 5.26e-18 | 1.71e-16 | 1.36e-16 | 130 |
| Page: 1 2 3 4 5 6 7 8 9 10 |
Top |
Cell-cell communication analysis |
| Identification of potential cell-cell interactions between two cell types and their ligand-receptor pairs for different disease states |
| Ligand | Receptor | LRpair | Pathway | Tissue | Disease Stage |
| Page: 1 |
Top |
Single-cell gene regulatory network inference analysis |
| Find out the significant the regulons (TFs) and the target genes of each regulon across cell types for different disease states |
| TF | Cell Type | Tissue | Disease Stage | Target Gene | RSS | Regulon Activity |
| ∗The dot plots of a searched regulon are shown for all cell subpopulations in each disease state of each tissue based on the regulon specific score inferred using pySCENIC and by calculating the average expression. |
| Page: 1 |
Top |
Somatic mutation of malignant transformation related genes |
| Annotation of somatic variants for genes involved in malignant transformation |
| Hugo Symbol | Variant Class | Variant Classification | dbSNP RS | HGVSc | HGVSp | HGVSp Short | SWISSPROT | BIOTYPE | SIFT | PolyPhen | Tumor Sample Barcode | Tissue | Histology | Sex | Age | Stage | Therapy Types | Drugs | Outcome |
| ITPR3 | SNV | Missense_Mutation | novel | c.6541N>A | p.Glu2181Lys | p.E2181K | Q14573 | protein_coding | deleterious(0) | probably_damaging(0.998) | TCGA-5L-AAT1-01 | Breast | breast invasive carcinoma | Female | <65 | III/IV | Hormone Therapy | letrozol | SD |
| ITPR3 | SNV | Missense_Mutation | c.1059C>G | p.Cys353Trp | p.C353W | Q14573 | protein_coding | tolerated(0.19) | benign(0.013) | TCGA-A2-A1FX-01 | Breast | breast invasive carcinoma | Female | <65 | III/IV | Chemotherapy | taxotere | SD | |
| ITPR3 | SNV | Missense_Mutation | novel | c.3928N>A | p.Glu1310Lys | p.E1310K | Q14573 | protein_coding | deleterious(0.01) | possibly_damaging(0.772) | TCGA-A2-A4RW-01 | Breast | breast invasive carcinoma | Female | <65 | III/IV | Unknown | Unknown | SD |
| ITPR3 | SNV | Missense_Mutation | c.2808N>G | p.Phe936Leu | p.F936L | Q14573 | protein_coding | tolerated(0.64) | benign(0.003) | TCGA-A8-A08P-01 | Breast | breast invasive carcinoma | Female | >=65 | III/IV | Chemotherapy | 5-fluorouracil | CR | |
| ITPR3 | SNV | Missense_Mutation | c.7685N>C | p.Glu2562Ala | p.E2562A | Q14573 | protein_coding | deleterious(0) | probably_damaging(0.998) | TCGA-A8-A09Z-01 | Breast | breast invasive carcinoma | Female | >=65 | I/II | Unknown | Unknown | SD | |
| ITPR3 | SNV | Missense_Mutation | c.55G>C | p.Glu19Gln | p.E19Q | Q14573 | protein_coding | deleterious(0) | probably_damaging(0.974) | TCGA-AC-A23H-01 | Breast | breast invasive carcinoma | Female | >=65 | I/II | Unknown | Unknown | PD | |
| ITPR3 | SNV | Missense_Mutation | c.55N>A | p.Glu19Lys | p.E19K | Q14573 | protein_coding | deleterious(0.05) | probably_damaging(0.934) | TCGA-AC-A5XS-01 | Breast | breast invasive carcinoma | Female | >=65 | I/II | Hormone Therapy | femara | SD | |
| ITPR3 | SNV | Missense_Mutation | rs373625572 | c.2905N>A | p.Leu969Met | p.L969M | Q14573 | protein_coding | deleterious(0) | probably_damaging(0.974) | TCGA-AN-A0AK-01 | Breast | breast invasive carcinoma | Female | >=65 | I/II | Unknown | Unknown | SD |
| ITPR3 | SNV | Missense_Mutation | rs778613128 | c.5800N>A | p.Val1934Met | p.V1934M | Q14573 | protein_coding | deleterious(0.01) | probably_damaging(1) | TCGA-AO-A128-01 | Breast | breast invasive carcinoma | Female | <65 | I/II | Chemotherapy | doxorubicin | SD |
| ITPR3 | SNV | Missense_Mutation | rs755528499 | c.4022N>T | p.Ser1341Leu | p.S1341L | Q14573 | protein_coding | deleterious(0.01) | probably_damaging(0.996) | TCGA-B6-A0RV-01 | Breast | breast invasive carcinoma | Female | <65 | III/IV | Unknown | Unknown | SD |
| Page: 1 2 3 4 5 6 7 8 9 10 11 12 13 14 15 16 17 18 19 20 21 22 23 24 25 26 27 28 |
Top |
Related drugs of malignant transformation related genes |
| Identification of chemicals and drugs interact with genes involved in malignant transfromation |
| (DGIdb 4.0) |
| Entrez ID | Symbol | Category | Interaction Types | Drug Claim Name | Drug Name | PMIDs |
| 3710 | ITPR3 | ION CHANNEL, DRUGGABLE GENOME | activator | 135652731 | ||
| 3710 | ITPR3 | ION CHANNEL, DRUGGABLE GENOME | antagonist | 135652750 | ||
| 3710 | ITPR3 | ION CHANNEL, DRUGGABLE GENOME | activator | 178101039 |
| Page: 1 |

Copyright 2023-Present -The University of Texas Health Science Center at Houston |