
|
|||||
|
 | |
| |
| |
| |
| |
| |
|
Gene: ITPKC |
Gene summary for ITPKC |
| Gene information | Species | Human | Gene symbol | ITPKC | Gene ID | 80271 |
| Gene name | inositol-trisphosphate 3-kinase C | |
| Gene Alias | IP3-3KC | |
| Cytomap | 19q13.2 | |
| Gene Type | protein-coding | GO ID | GO:0006066 | UniProtAcc | A0A024R0N8 |
Top |
Malignant transformation analysis |
| Identification of the aberrant gene expression in precancerous and cancerous lesions by comparing the gene expression of stem-like cells in diseased tissues with normal stem cells |
| Entrez ID | Symbol | Replicates | Species | Organ | Tissue | Adj P-value | Log2FC | Malignancy |
| 80271 | ITPKC | CA_HPV_2 | Human | Cervix | CC | 6.83e-03 | 2.36e-01 | 0.0391 |
| 80271 | ITPKC | CCI_1 | Human | Cervix | CC | 6.45e-04 | 5.15e-01 | 0.528 |
| 80271 | ITPKC | CCI_2 | Human | Cervix | CC | 1.83e-02 | 4.79e-01 | 0.5249 |
| 80271 | ITPKC | CCI_3 | Human | Cervix | CC | 9.52e-05 | 5.49e-01 | 0.516 |
| 80271 | ITPKC | CCII_1 | Human | Cervix | CC | 2.87e-02 | 3.15e-01 | 0.3249 |
| 80271 | ITPKC | sample3 | Human | Cervix | CC | 8.12e-08 | 3.03e-01 | 0.1387 |
| 80271 | ITPKC | H2 | Human | Cervix | HSIL_HPV | 8.88e-06 | 3.21e-01 | 0.0632 |
| 80271 | ITPKC | T1 | Human | Cervix | CC | 5.42e-03 | 2.93e-01 | 0.0918 |
| 80271 | ITPKC | T3 | Human | Cervix | CC | 4.27e-06 | 2.48e-01 | 0.1389 |
| 80271 | ITPKC | AEH-subject1 | Human | Endometrium | AEH | 1.23e-22 | 6.43e-01 | -0.3059 |
| 80271 | ITPKC | AEH-subject4 | Human | Endometrium | AEH | 4.85e-11 | 5.57e-01 | -0.2657 |
| 80271 | ITPKC | AEH-subject5 | Human | Endometrium | AEH | 8.89e-09 | 4.81e-01 | -0.2953 |
| 80271 | ITPKC | EEC-subject1 | Human | Endometrium | EEC | 4.31e-20 | 6.05e-01 | -0.2682 |
| 80271 | ITPKC | EEC-subject2 | Human | Endometrium | EEC | 4.91e-09 | 4.47e-01 | -0.2607 |
| 80271 | ITPKC | EEC-subject4 | Human | Endometrium | EEC | 6.06e-03 | 3.50e-01 | -0.2571 |
| 80271 | ITPKC | EEC-subject5 | Human | Endometrium | EEC | 5.53e-07 | 4.24e-01 | -0.249 |
| 80271 | ITPKC | GSM6177621_NYU_UCEC2_lib1_lib1 | Human | Endometrium | EEC | 3.87e-05 | -7.58e-02 | -0.1934 |
| 80271 | ITPKC | GSM6177622_NYU_UCEC3_lib1_lib1 | Human | Endometrium | EEC | 2.54e-03 | 5.62e-03 | -0.1917 |
| 80271 | ITPKC | LZE7T | Human | Esophagus | ESCC | 3.32e-03 | -4.57e-02 | 0.0667 |
| 80271 | ITPKC | LZE8T | Human | Esophagus | ESCC | 7.15e-06 | 3.03e-01 | 0.067 |
| Page: 1 2 3 4 5 6 |
| Tissue | Expression Dynamics | Abbreviation |
| Cervix | 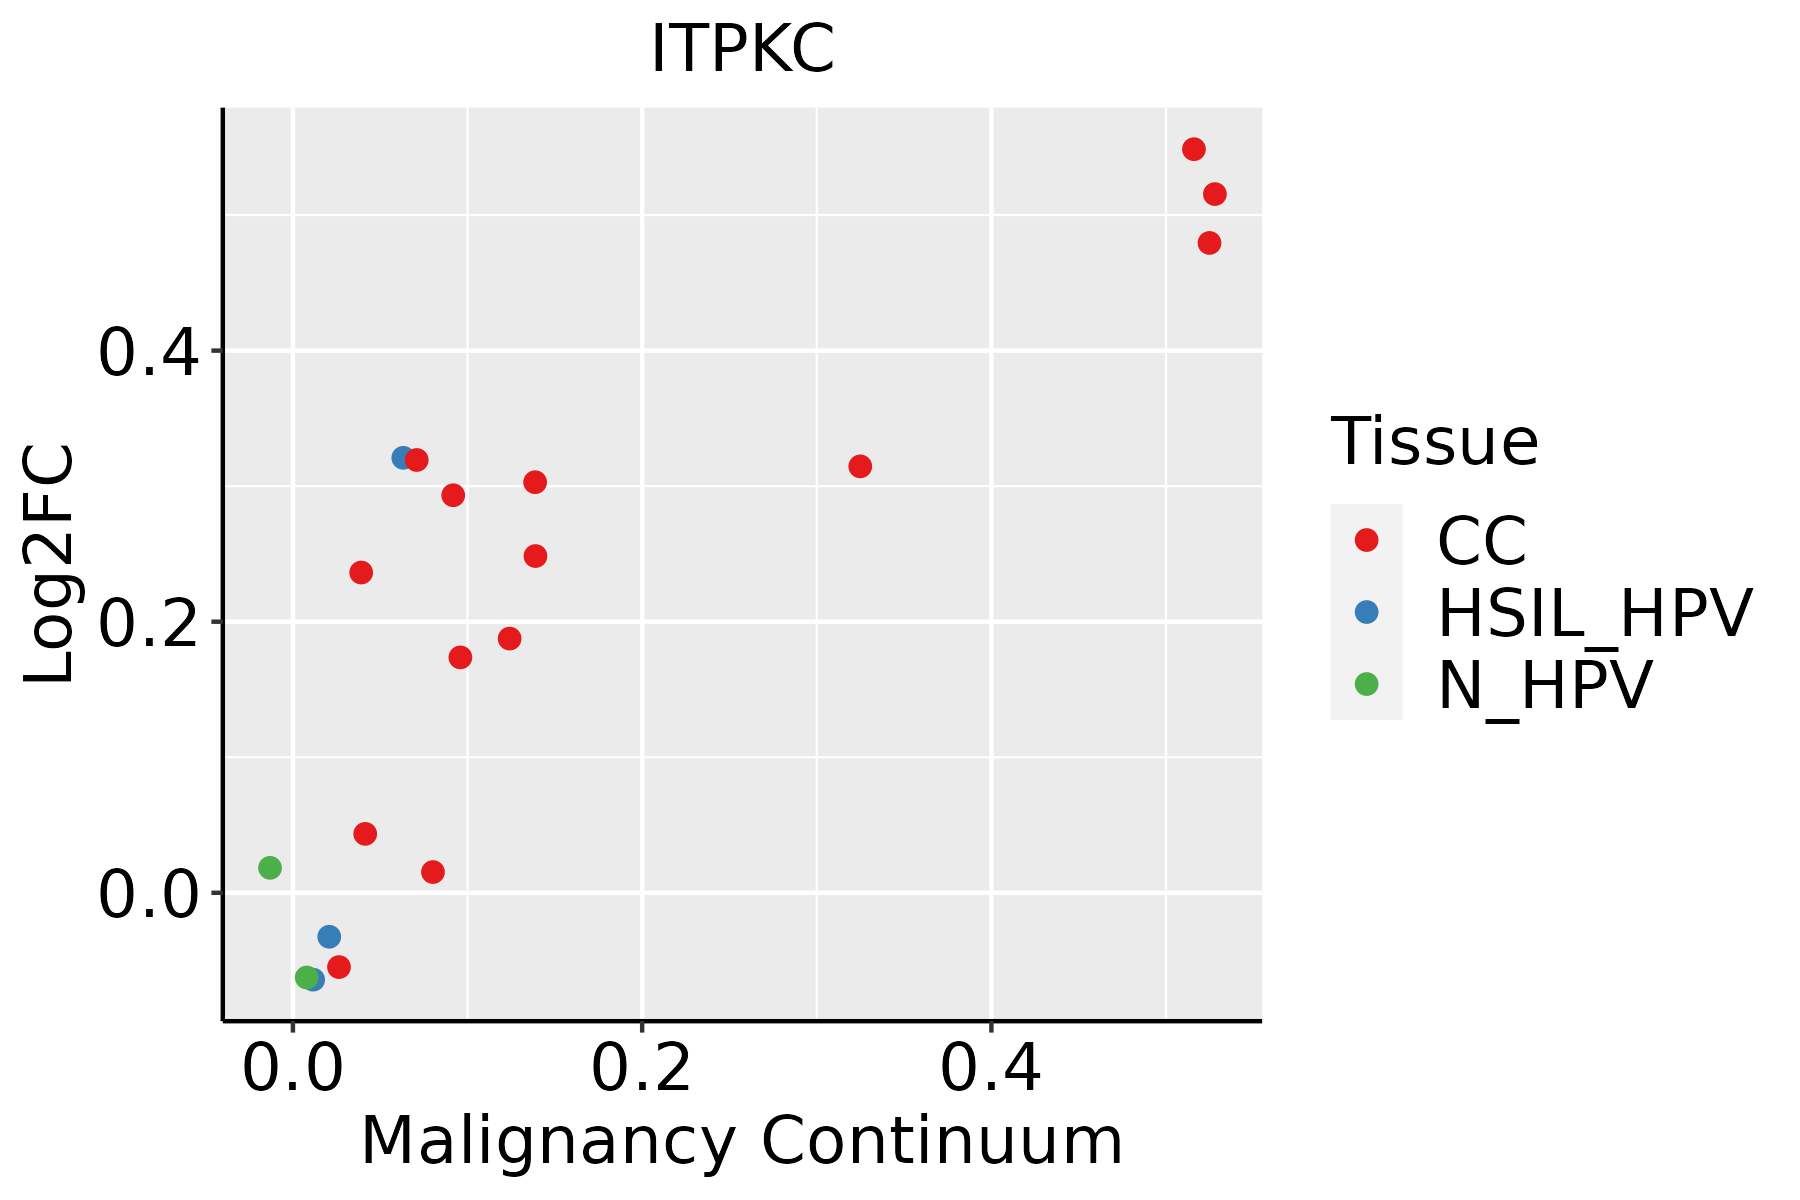 | CC: Cervix cancer |
| HSIL_HPV: HPV-infected high-grade squamous intraepithelial lesions | ||
| N_HPV: HPV-infected normal cervix | ||
| Endometrium | 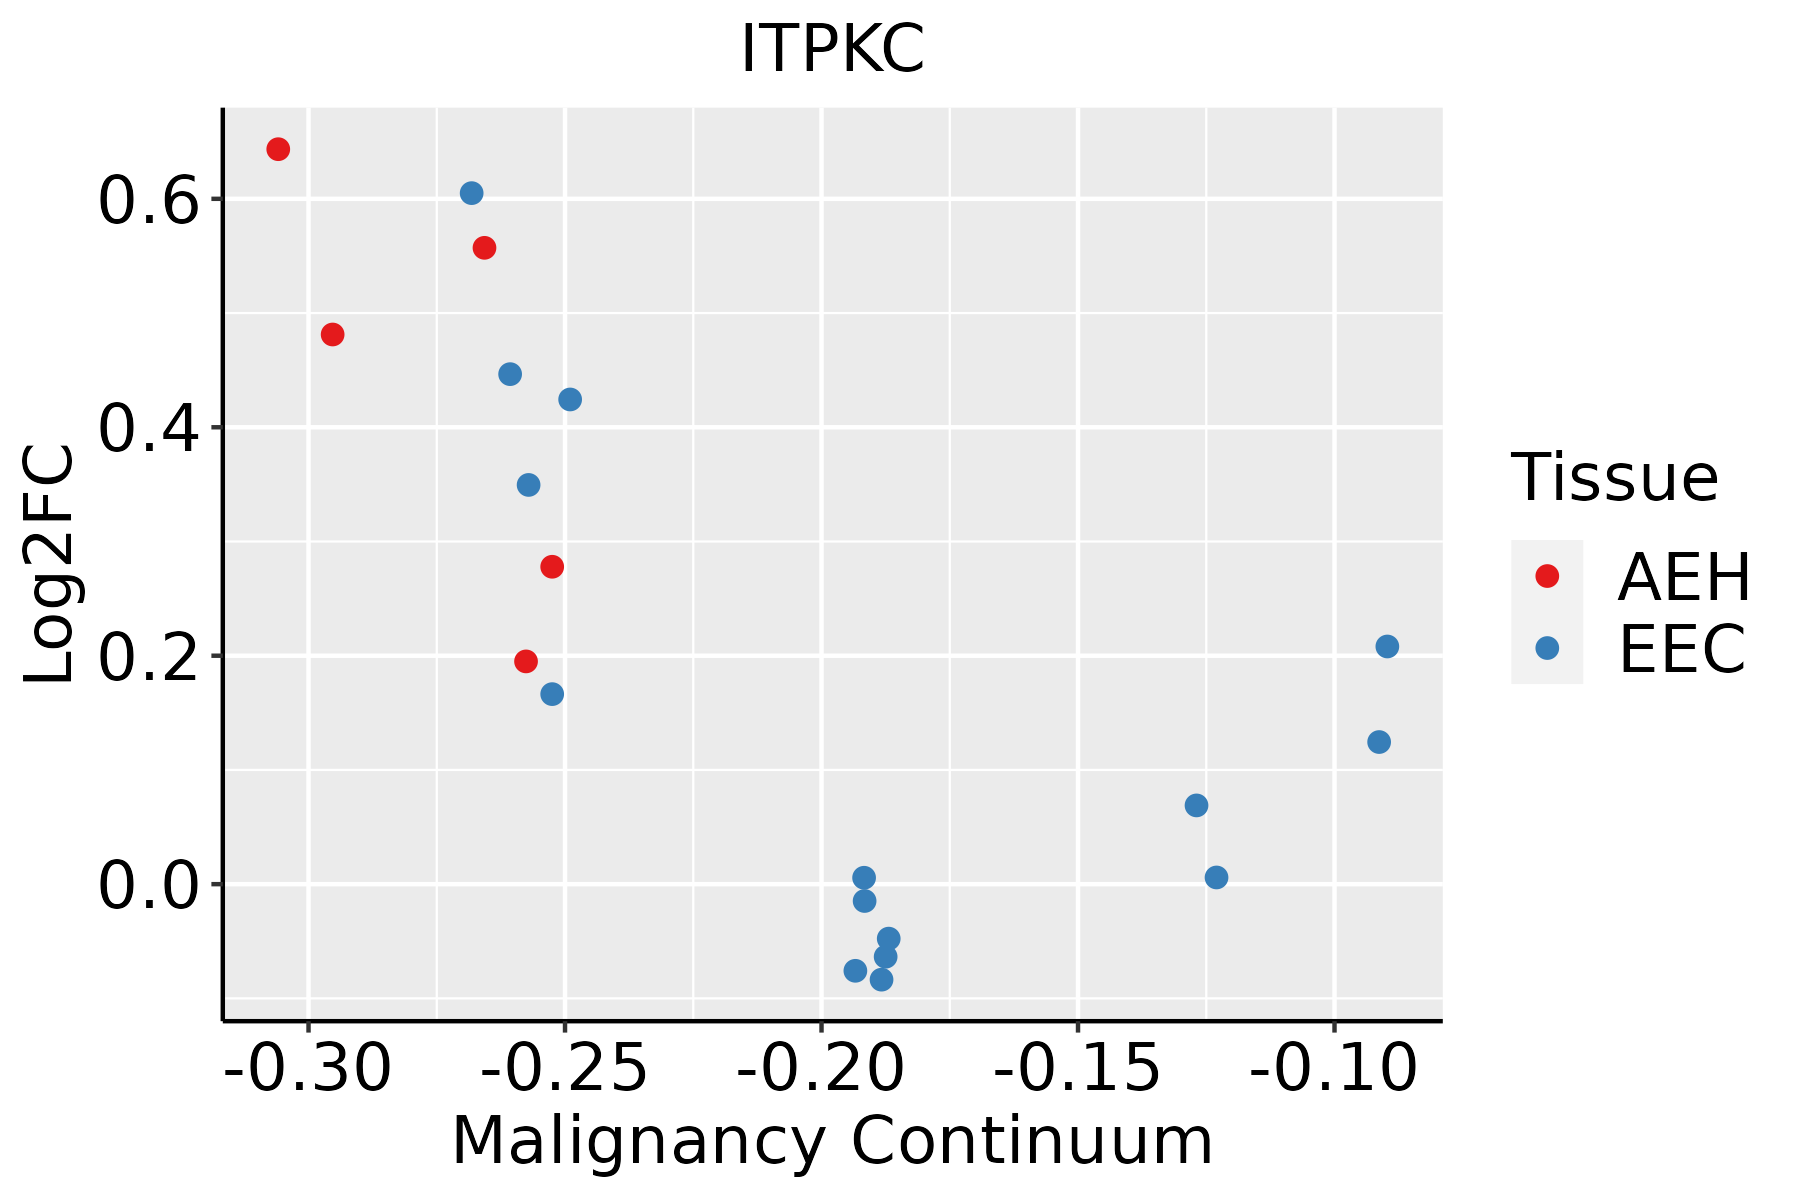 | AEH: Atypical endometrial hyperplasia |
| EEC: Endometrioid Cancer | ||
| Esophagus | 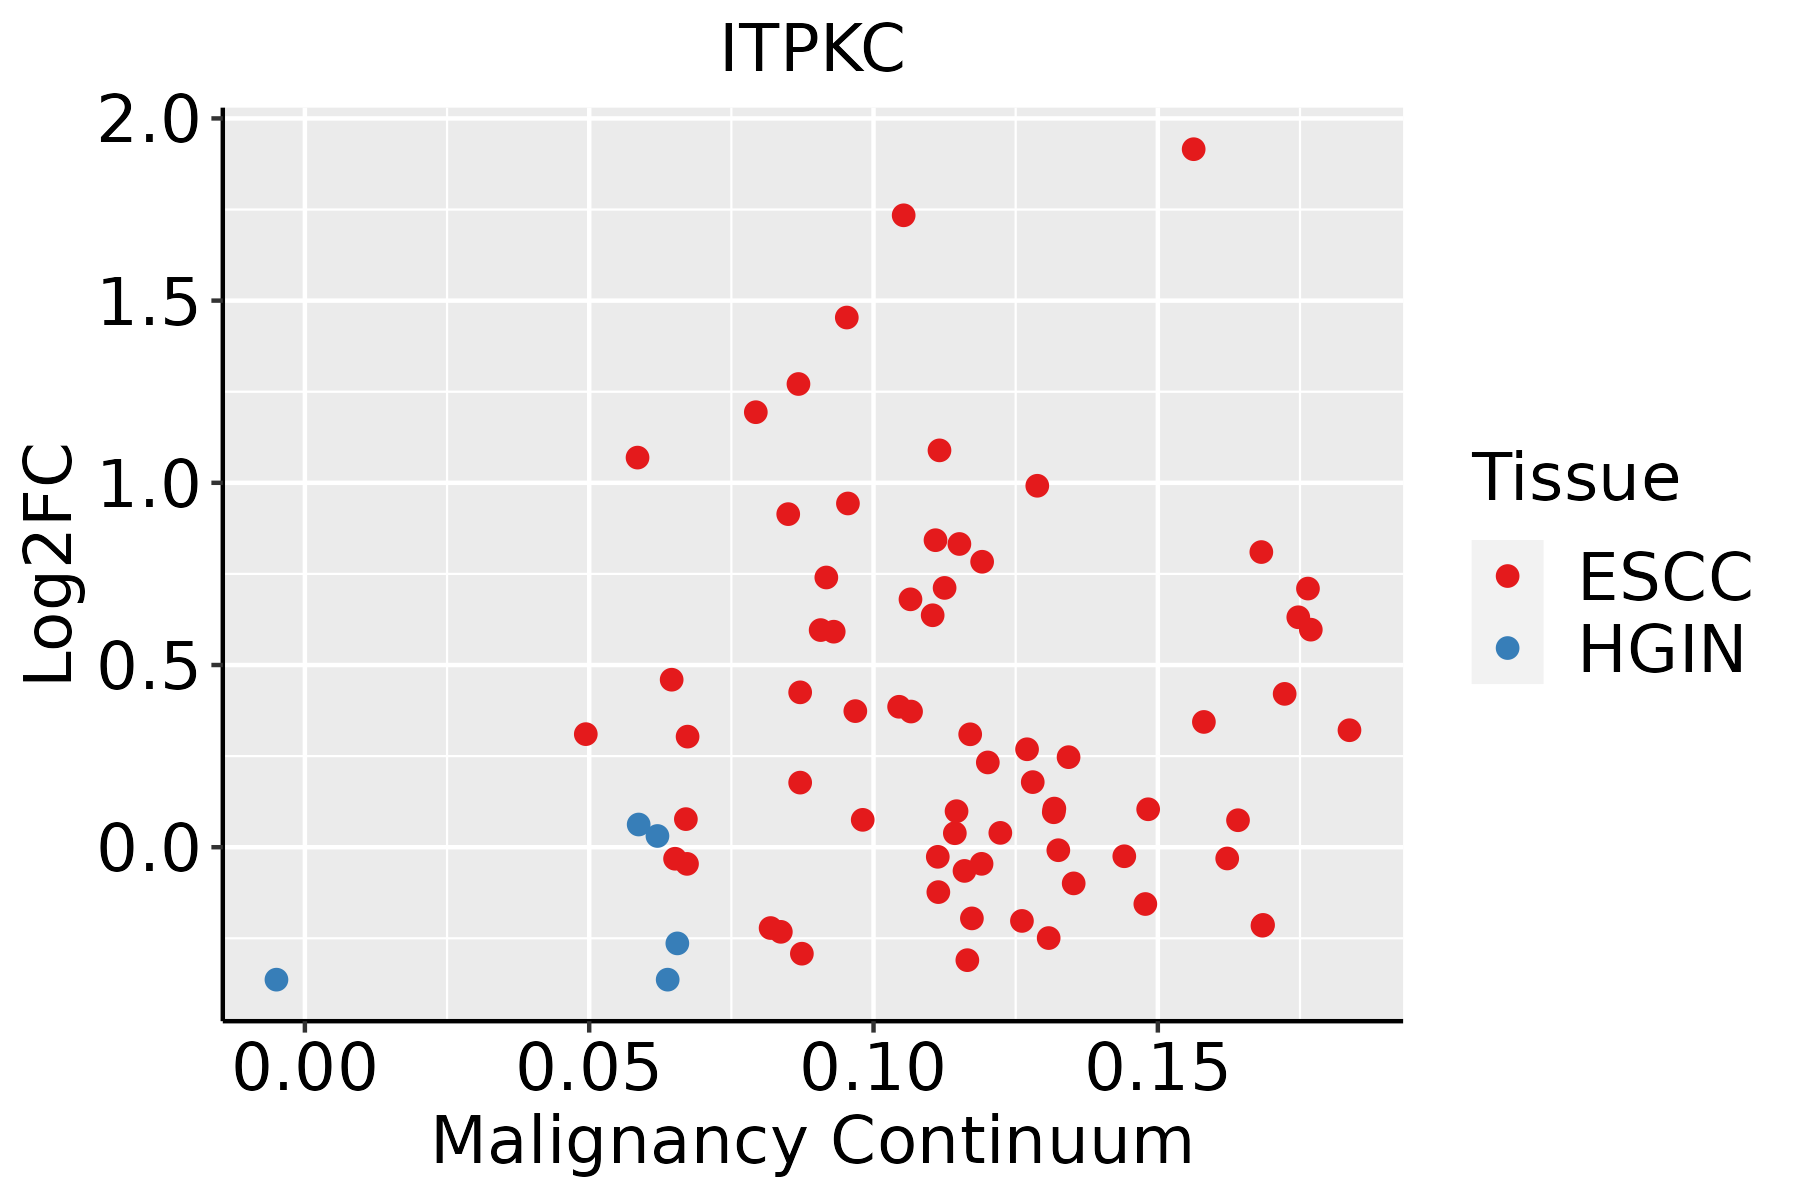 | ESCC: Esophageal squamous cell carcinoma |
| HGIN: High-grade intraepithelial neoplasias | ||
| LGIN: Low-grade intraepithelial neoplasias | ||
| Oral Cavity | 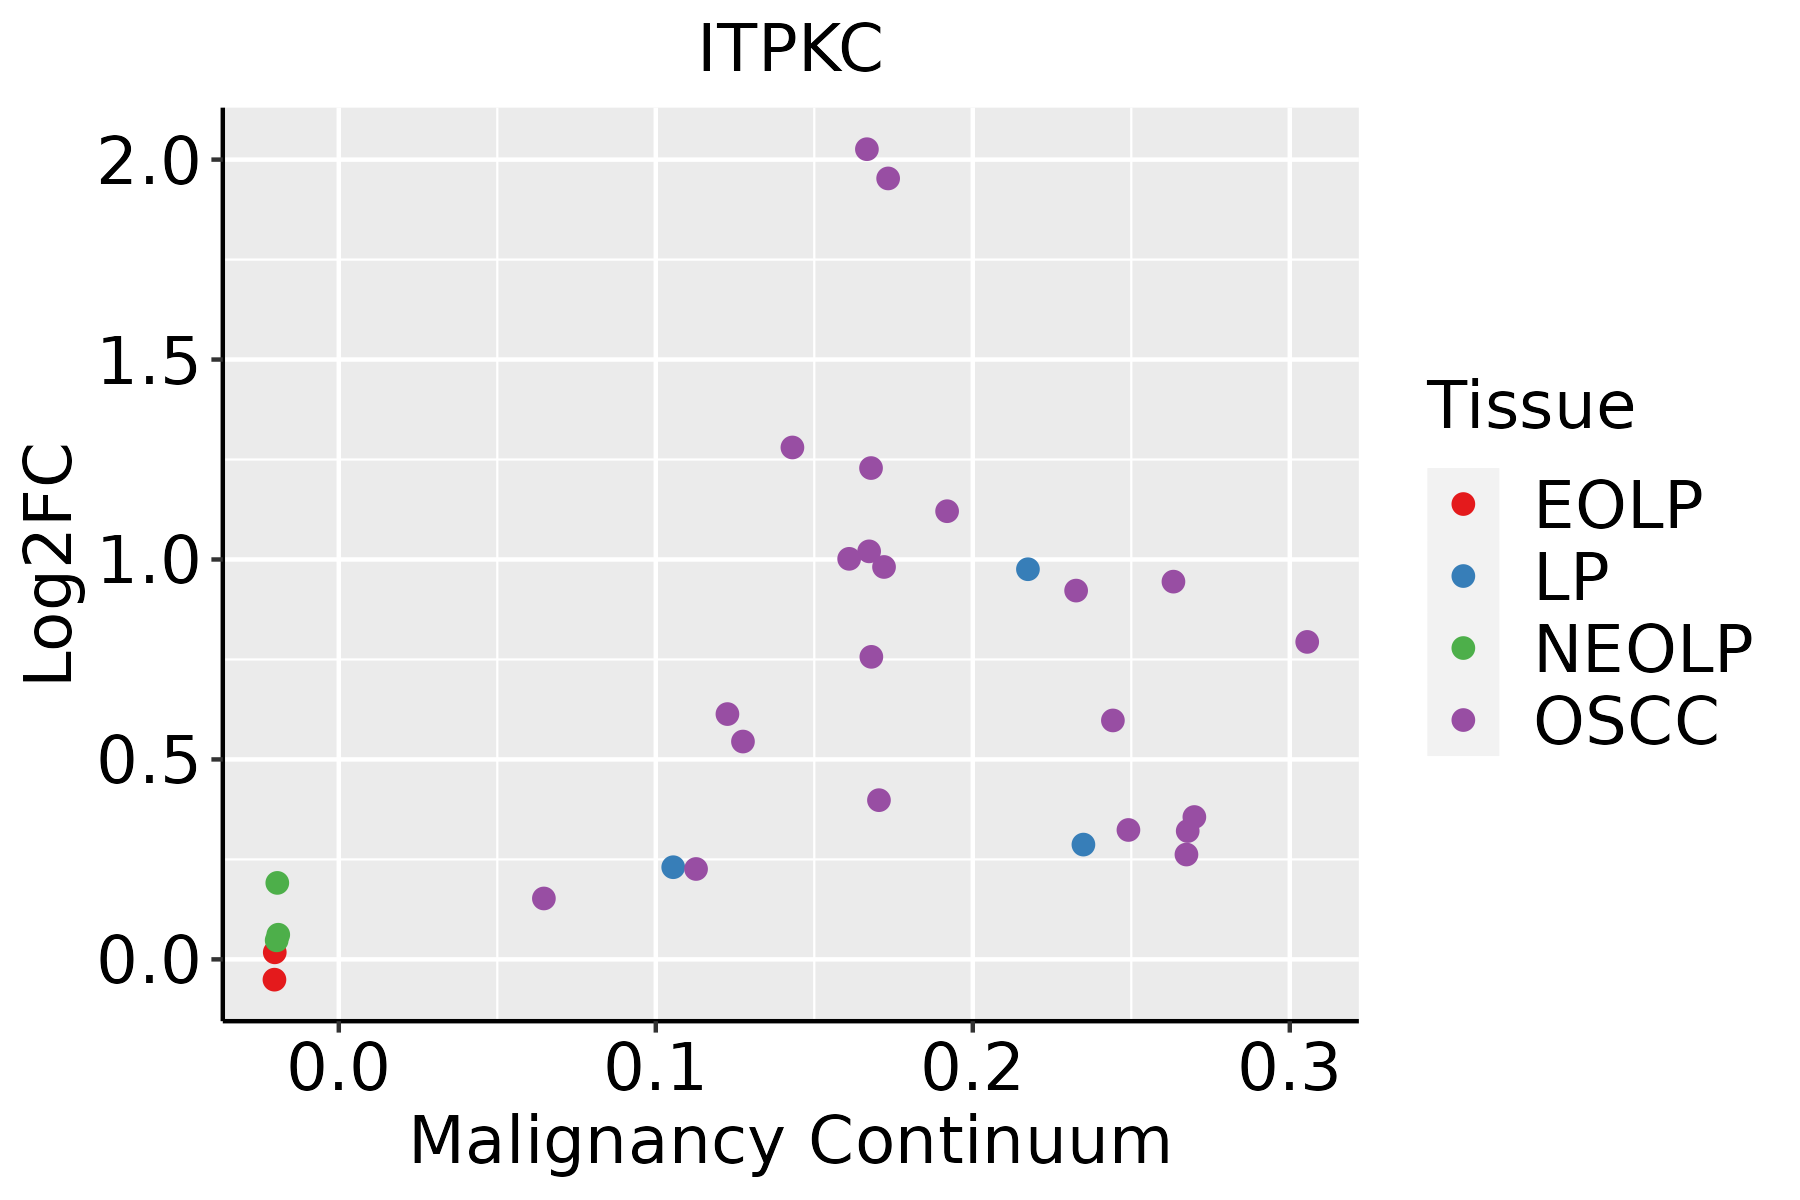 | EOLP: Erosive Oral lichen planus |
| LP: leukoplakia | ||
| NEOLP: Non-erosive oral lichen planus | ||
| OSCC: Oral squamous cell carcinoma | ||
| Prostate | 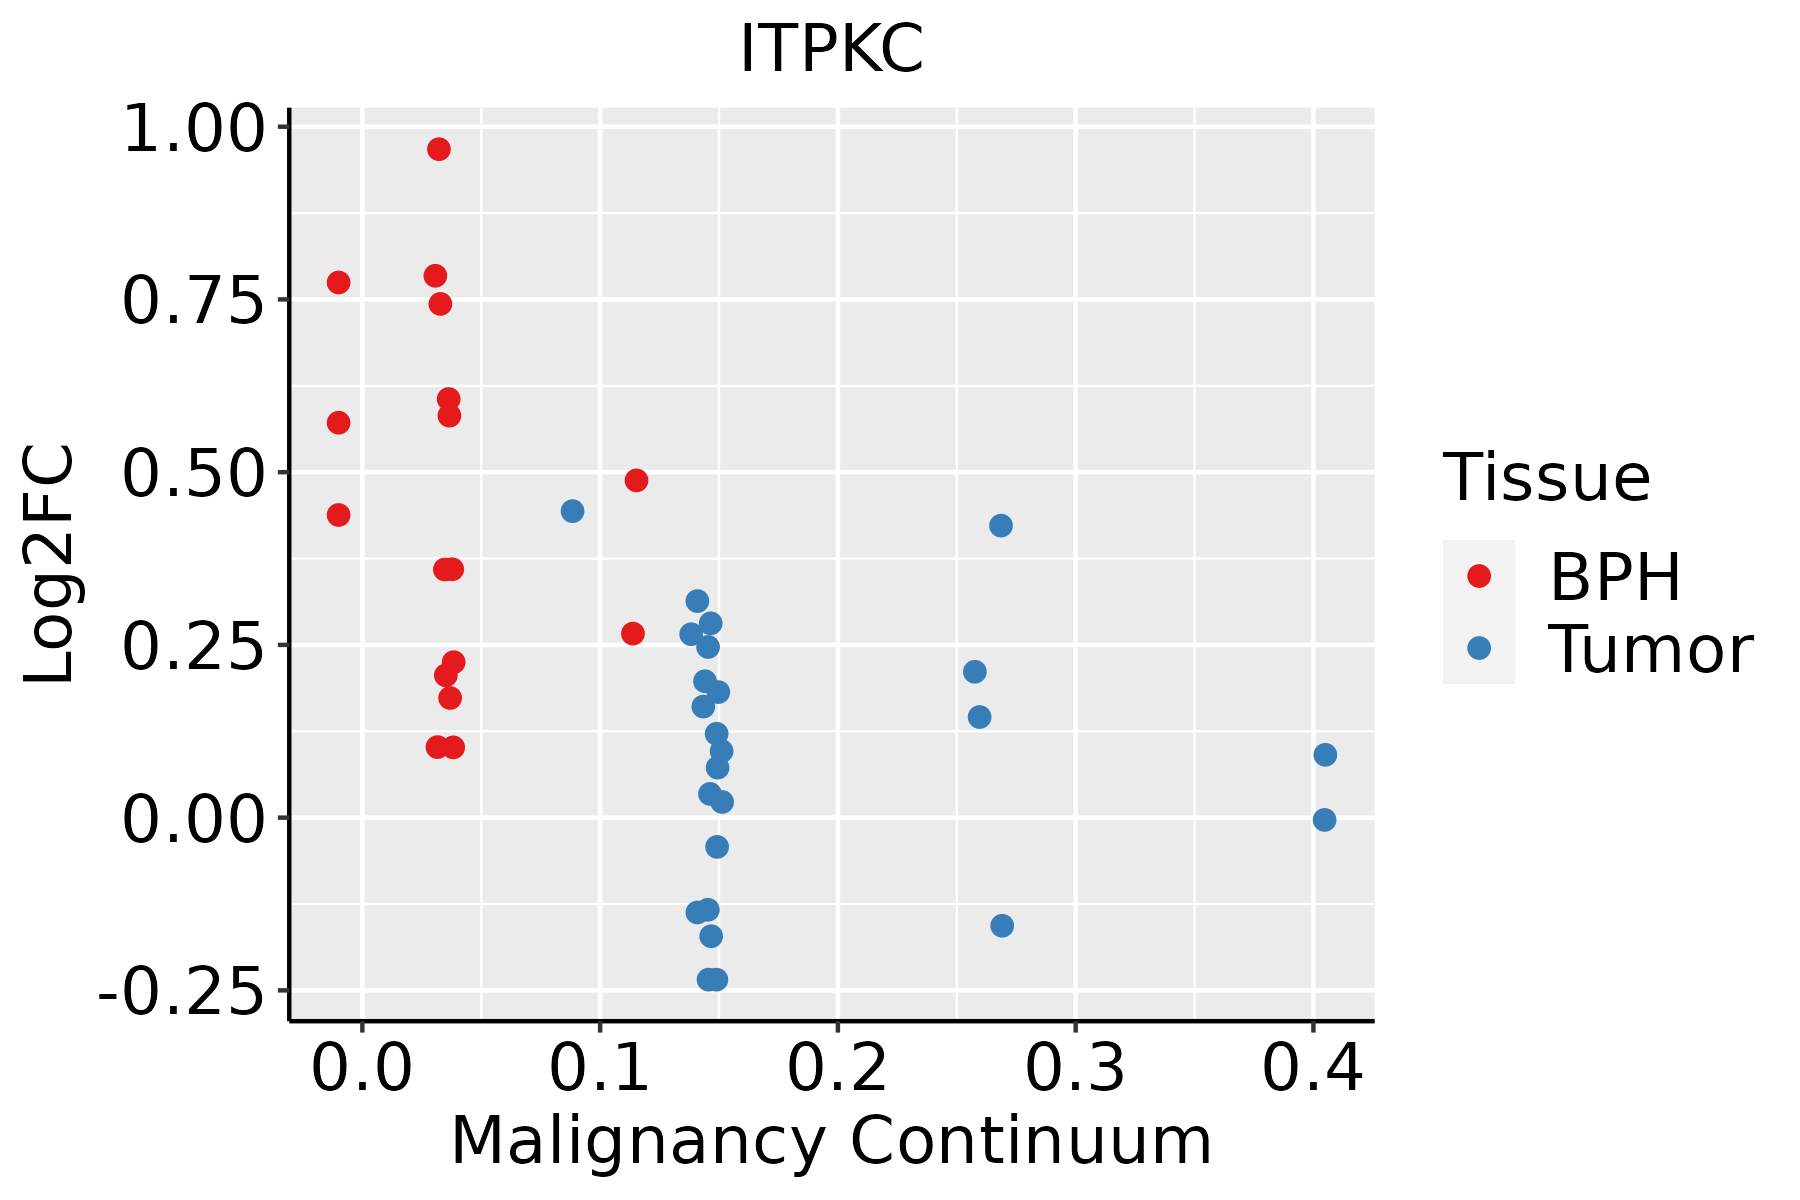 | BPH: Benign Prostatic Hyperplasia |
| Skin | 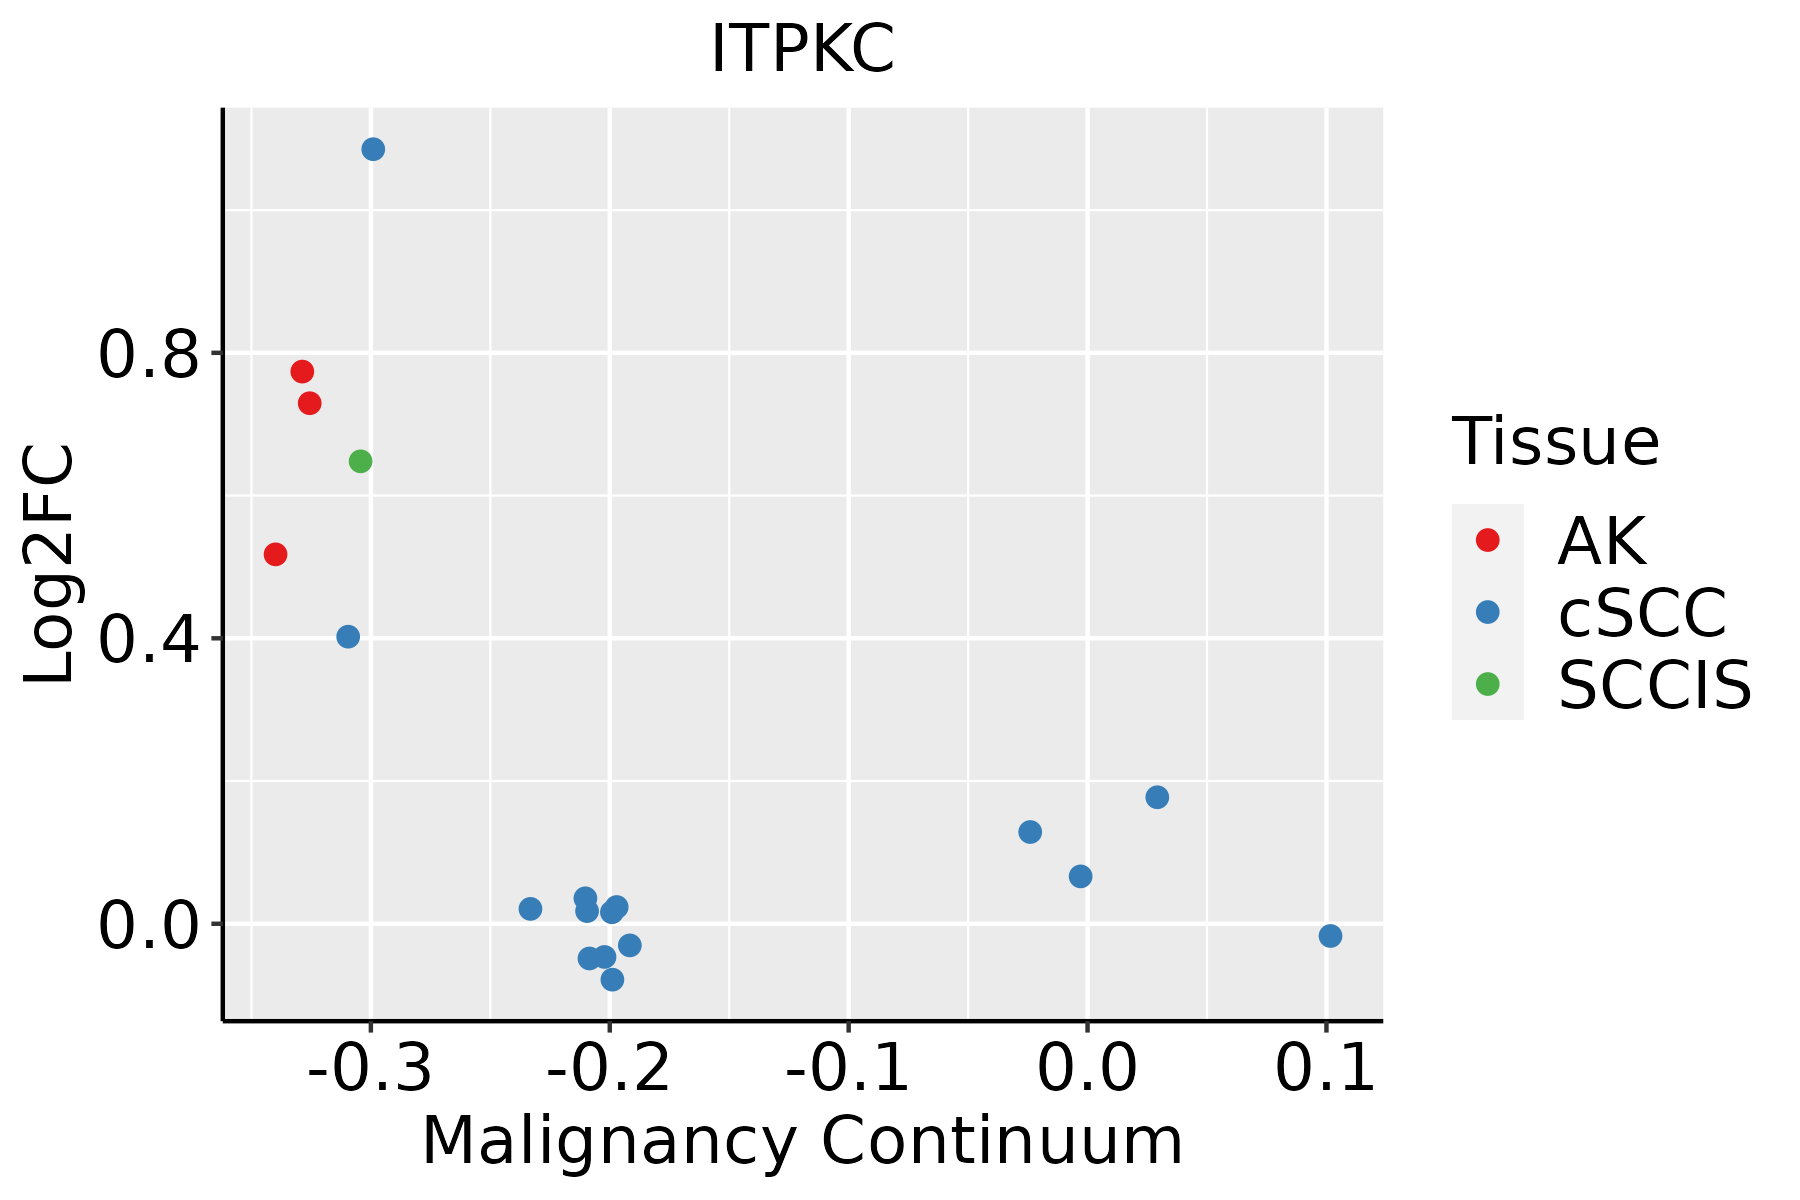 | AK: Actinic keratosis |
| cSCC: Cutaneous squamous cell carcinoma | ||
| SCCIS:squamous cell carcinoma in situ | ||
| Thyroid | 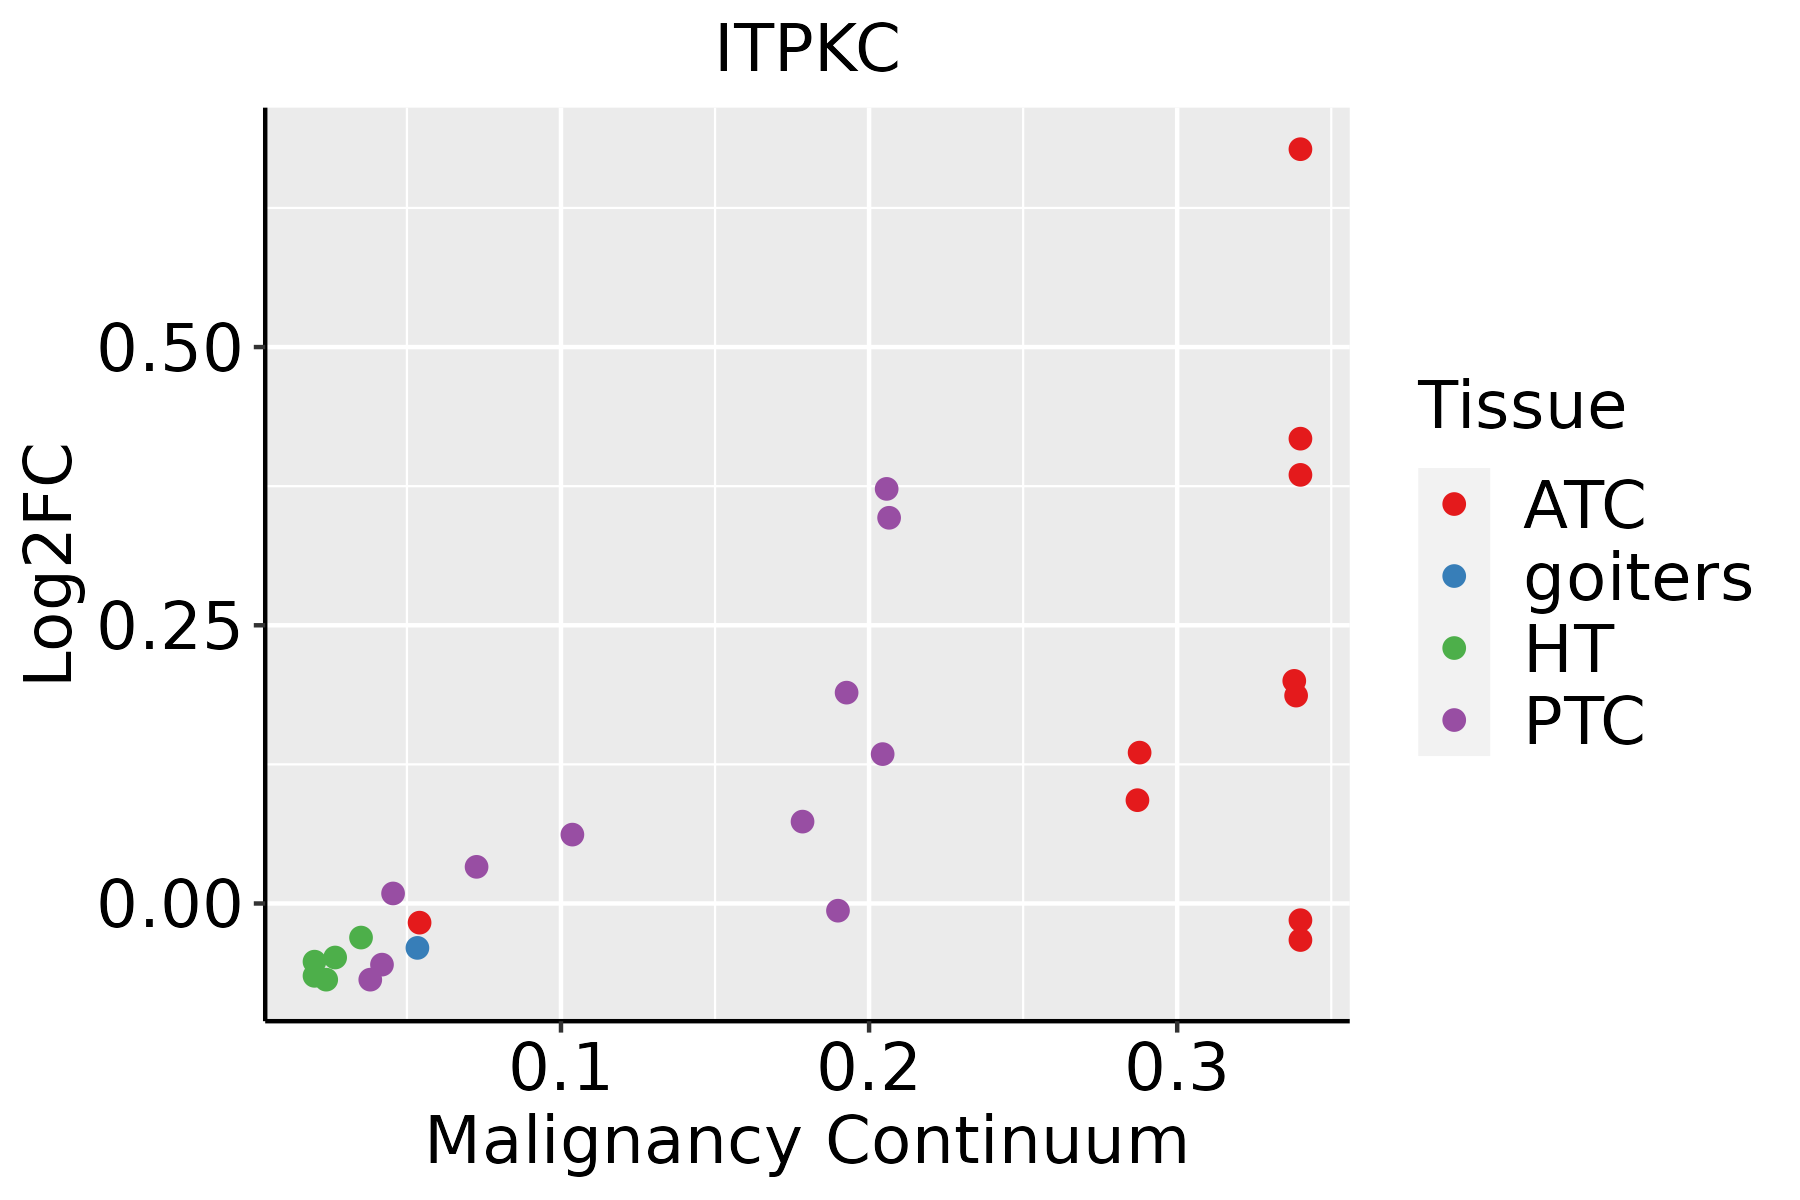 | ATC: Anaplastic thyroid cancer |
| HT: Hashimoto's thyroiditis | ||
| PTC: Papillary thyroid cancer |
| ∗log2FC in expression of this searched gene in stem-like cells from each diseased tissue sample relative to stem-like cells in normal samples in each tissue plotted against the malignancy continuum. Samples are colored based on if they are from different disease stage. |
Top |
Malignant transformation related pathway analysis |
| Find out the enriched GO biological processes and KEGG pathways involved in transition from healthy to precancer to cancer |
| Tissue | Disease Stage | Enriched GO biological Processes |
| Colorectum | AD |  |
| Colorectum | SER |  |
| Colorectum | MSS |  |
| Colorectum | MSI-H |  |
| Colorectum | FAP |  |
| ∗Top 15 enriched GO BP terms are showed in the bar plot of each disease state in each tissue. Each row represents a significant GO biological process which is colored according to the -log10(p.adjust). |
| Page: 1 2 3 4 5 6 7 8 9 |
| GO ID | Tissue | Disease Stage | Description | Gene Ratio | Bg Ratio | pvalue | p.adjust | Count |
| GO:00086544 | Esophagus | ESCC | phospholipid biosynthetic process | 162/8552 | 253/18723 | 2.59e-09 | 5.73e-08 | 162 |
| GO:00464744 | Esophagus | ESCC | glycerophospholipid biosynthetic process | 135/8552 | 211/18723 | 5.75e-08 | 1.02e-06 | 135 |
| GO:00450175 | Esophagus | ESCC | glycerolipid biosynthetic process | 154/8552 | 252/18723 | 5.20e-07 | 6.96e-06 | 154 |
| GO:00066446 | Esophagus | ESCC | phospholipid metabolic process | 218/8552 | 383/18723 | 5.37e-06 | 5.59e-05 | 218 |
| GO:00060668 | Esophagus | ESCC | alcohol metabolic process | 202/8552 | 353/18723 | 7.32e-06 | 7.26e-05 | 202 |
| GO:00066505 | Esophagus | ESCC | glycerophospholipid metabolic process | 174/8552 | 306/18723 | 4.92e-05 | 3.85e-04 | 174 |
| GO:00464864 | Esophagus | ESCC | glycerolipid metabolic process | 211/8552 | 392/18723 | 6.51e-04 | 3.46e-03 | 211 |
| GO:00461653 | Esophagus | ESCC | alcohol biosynthetic process | 83/8552 | 140/18723 | 8.04e-04 | 4.16e-03 | 83 |
| GO:19016174 | Esophagus | ESCC | organic hydroxy compound biosynthetic process | 128/8552 | 237/18723 | 5.86e-03 | 2.16e-02 | 128 |
| GO:00066611 | Esophagus | ESCC | phosphatidylinositol biosynthetic process | 73/8552 | 131/18723 | 1.31e-02 | 4.28e-02 | 73 |
| GO:00060667 | Oral cavity | OSCC | alcohol metabolic process | 179/7305 | 353/18723 | 4.54e-06 | 5.21e-05 | 179 |
| GO:00086543 | Oral cavity | OSCC | phospholipid biosynthetic process | 130/7305 | 253/18723 | 3.96e-05 | 3.46e-04 | 130 |
| GO:00461652 | Oral cavity | OSCC | alcohol biosynthetic process | 77/7305 | 140/18723 | 8.77e-05 | 6.70e-04 | 77 |
| GO:19016173 | Oral cavity | OSCC | organic hydroxy compound biosynthetic process | 115/7305 | 237/18723 | 1.73e-03 | 8.18e-03 | 115 |
| GO:00464743 | Oral cavity | OSCC | glycerophospholipid biosynthetic process | 102/7305 | 211/18723 | 3.50e-03 | 1.48e-02 | 102 |
| GO:00066445 | Oral cavity | OSCC | phospholipid metabolic process | 175/7305 | 383/18723 | 4.21e-03 | 1.71e-02 | 175 |
| GO:00461654 | Skin | cSCC | alcohol biosynthetic process | 50/4864 | 140/18723 | 6.73e-03 | 3.27e-02 | 50 |
| Page: 1 |
| Pathway ID | Tissue | Disease Stage | Description | Gene Ratio | Bg Ratio | pvalue | p.adjust | qvalue | Count |
| Page: 1 |
Top |
Cell-cell communication analysis |
| Identification of potential cell-cell interactions between two cell types and their ligand-receptor pairs for different disease states |
| Ligand | Receptor | LRpair | Pathway | Tissue | Disease Stage |
| Page: 1 |
Top |
Single-cell gene regulatory network inference analysis |
| Find out the significant the regulons (TFs) and the target genes of each regulon across cell types for different disease states |
| TF | Cell Type | Tissue | Disease Stage | Target Gene | RSS | Regulon Activity |
| ∗The dot plots of a searched regulon are shown for all cell subpopulations in each disease state of each tissue based on the regulon specific score inferred using pySCENIC and by calculating the average expression. |
| Page: 1 |
Top |
Somatic mutation of malignant transformation related genes |
| Annotation of somatic variants for genes involved in malignant transformation |
| Hugo Symbol | Variant Class | Variant Classification | dbSNP RS | HGVSc | HGVSp | HGVSp Short | SWISSPROT | BIOTYPE | SIFT | PolyPhen | Tumor Sample Barcode | Tissue | Histology | Sex | Age | Stage | Therapy Types | Drugs | Outcome |
| ITPKC | SNV | Missense_Mutation | rs546922007 | c.1502G>A | p.Arg501Gln | p.R501Q | Q96DU7 | protein_coding | deleterious(0.02) | probably_damaging(0.982) | TCGA-A2-A0CU-01 | Breast | breast invasive carcinoma | Female | >=65 | I/II | Hormone Therapy | tamoxiphen | SD |
| ITPKC | SNV | Missense_Mutation | c.1836N>G | p.Phe612Leu | p.F612L | Q96DU7 | protein_coding | deleterious(0.03) | probably_damaging(1) | TCGA-AC-A23H-01 | Breast | breast invasive carcinoma | Female | >=65 | I/II | Unknown | Unknown | PD | |
| ITPKC | SNV | Missense_Mutation | c.746N>G | p.Ser249Cys | p.S249C | Q96DU7 | protein_coding | deleterious_low_confidence(0) | possibly_damaging(0.707) | TCGA-AN-A0XW-01 | Breast | breast invasive carcinoma | Female | <65 | III/IV | Unknown | Unknown | SD | |
| ITPKC | SNV | Missense_Mutation | novel | c.1994N>A | p.Gly665Asp | p.G665D | Q96DU7 | protein_coding | deleterious(0) | probably_damaging(1) | TCGA-AQ-A7U7-01 | Breast | breast invasive carcinoma | Female | <65 | III/IV | Targeted Molecular therapy | rituximab | CR |
| ITPKC | SNV | Missense_Mutation | c.1099N>C | p.Glu367Gln | p.E367Q | Q96DU7 | protein_coding | deleterious(0) | probably_damaging(0.994) | TCGA-C8-A1HM-01 | Breast | breast invasive carcinoma | Female | >=65 | I/II | Chemotherapy | doxorubicin | CR | |
| ITPKC | SNV | Missense_Mutation | c.247N>A | p.Glu83Lys | p.E83K | Q96DU7 | protein_coding | deleterious_low_confidence(0.01) | benign(0.007) | TCGA-D8-A1JA-01 | Breast | breast invasive carcinoma | Female | <65 | III/IV | Chemotherapy | adriamycin | PD | |
| ITPKC | SNV | Missense_Mutation | novel | c.1294C>G | p.Arg432Gly | p.R432G | Q96DU7 | protein_coding | deleterious(0.01) | benign(0.025) | TCGA-EW-A6SB-01 | Breast | breast invasive carcinoma | Female | <65 | I/II | Unknown | Unknown | SD |
| ITPKC | SNV | Missense_Mutation | c.2036G>C | p.Gly679Ala | p.G679A | Q96DU7 | protein_coding | tolerated(0.06) | benign(0.056) | TCGA-GM-A2DH-01 | Breast | breast invasive carcinoma | Female | <65 | I/II | Chemotherapy | taxol | CR | |
| ITPKC | SNV | Missense_Mutation | novel | c.589N>G | p.Thr197Ala | p.T197A | Q96DU7 | protein_coding | deleterious_low_confidence(0.05) | benign(0.006) | TCGA-LD-A7W6-01 | Breast | breast invasive carcinoma | Female | <65 | I/II | Chemotherapy | letrozole | SD |
| ITPKC | deletion | Frame_Shift_Del | novel | c.1805delN | p.Arg603ValfsTer16 | p.R603Vfs*16 | Q96DU7 | protein_coding | TCGA-D8-A27V-01 | Breast | breast invasive carcinoma | Female | <65 | I/II | Hormone Therapy | tamoxiphen | SD |
| Page: 1 2 3 4 5 6 7 8 |
Top |
Related drugs of malignant transformation related genes |
| Identification of chemicals and drugs interact with genes involved in malignant transfromation |
| (DGIdb 4.0) |
| Entrez ID | Symbol | Category | Interaction Types | Drug Claim Name | Drug Name | PMIDs |
| 80271 | ITPKC | ENZYME, KINASE | inhibitor | 336446934 | ||
| 80271 | ITPKC | ENZYME, KINASE | Immunoglobulins | 21987091 |
| Page: 1 |

Copyright 2023-Present -The University of Texas Health Science Center at Houston |