
|
|||||
|
 | |
| |
| |
| |
| |
| |
|
Gene: ITPKA |
Gene summary for ITPKA |
| Gene information | Species | Human | Gene symbol | ITPKA | Gene ID | 3706 |
| Gene name | inositol-trisphosphate 3-kinase A | |
| Gene Alias | IP3-3KA | |
| Cytomap | 15q15.1 | |
| Gene Type | protein-coding | GO ID | GO:0000902 | UniProtAcc | P23677 |
Top |
Malignant transformation analysis |
| Identification of the aberrant gene expression in precancerous and cancerous lesions by comparing the gene expression of stem-like cells in diseased tissues with normal stem cells |
| Entrez ID | Symbol | Replicates | Species | Organ | Tissue | Adj P-value | Log2FC | Malignancy |
| 3706 | ITPKA | HTA11_2487_2000001011 | Human | Colorectum | SER | 5.20e-04 | 2.53e-01 | -0.1808 |
| 3706 | ITPKA | HTA11_347_2000001011 | Human | Colorectum | AD | 1.58e-21 | 5.52e-01 | -0.1954 |
| 3706 | ITPKA | HTA11_83_2000001011 | Human | Colorectum | SER | 4.49e-04 | 3.08e-01 | -0.1526 |
| 3706 | ITPKA | HTA11_696_2000001011 | Human | Colorectum | AD | 2.48e-07 | 2.88e-01 | -0.1464 |
| Page: 1 |
| Tissue | Expression Dynamics | Abbreviation |
| Colorectum (GSE201348) |  | FAP: Familial adenomatous polyposis |
| CRC: Colorectal cancer | ||
| Colorectum (HTA11) | 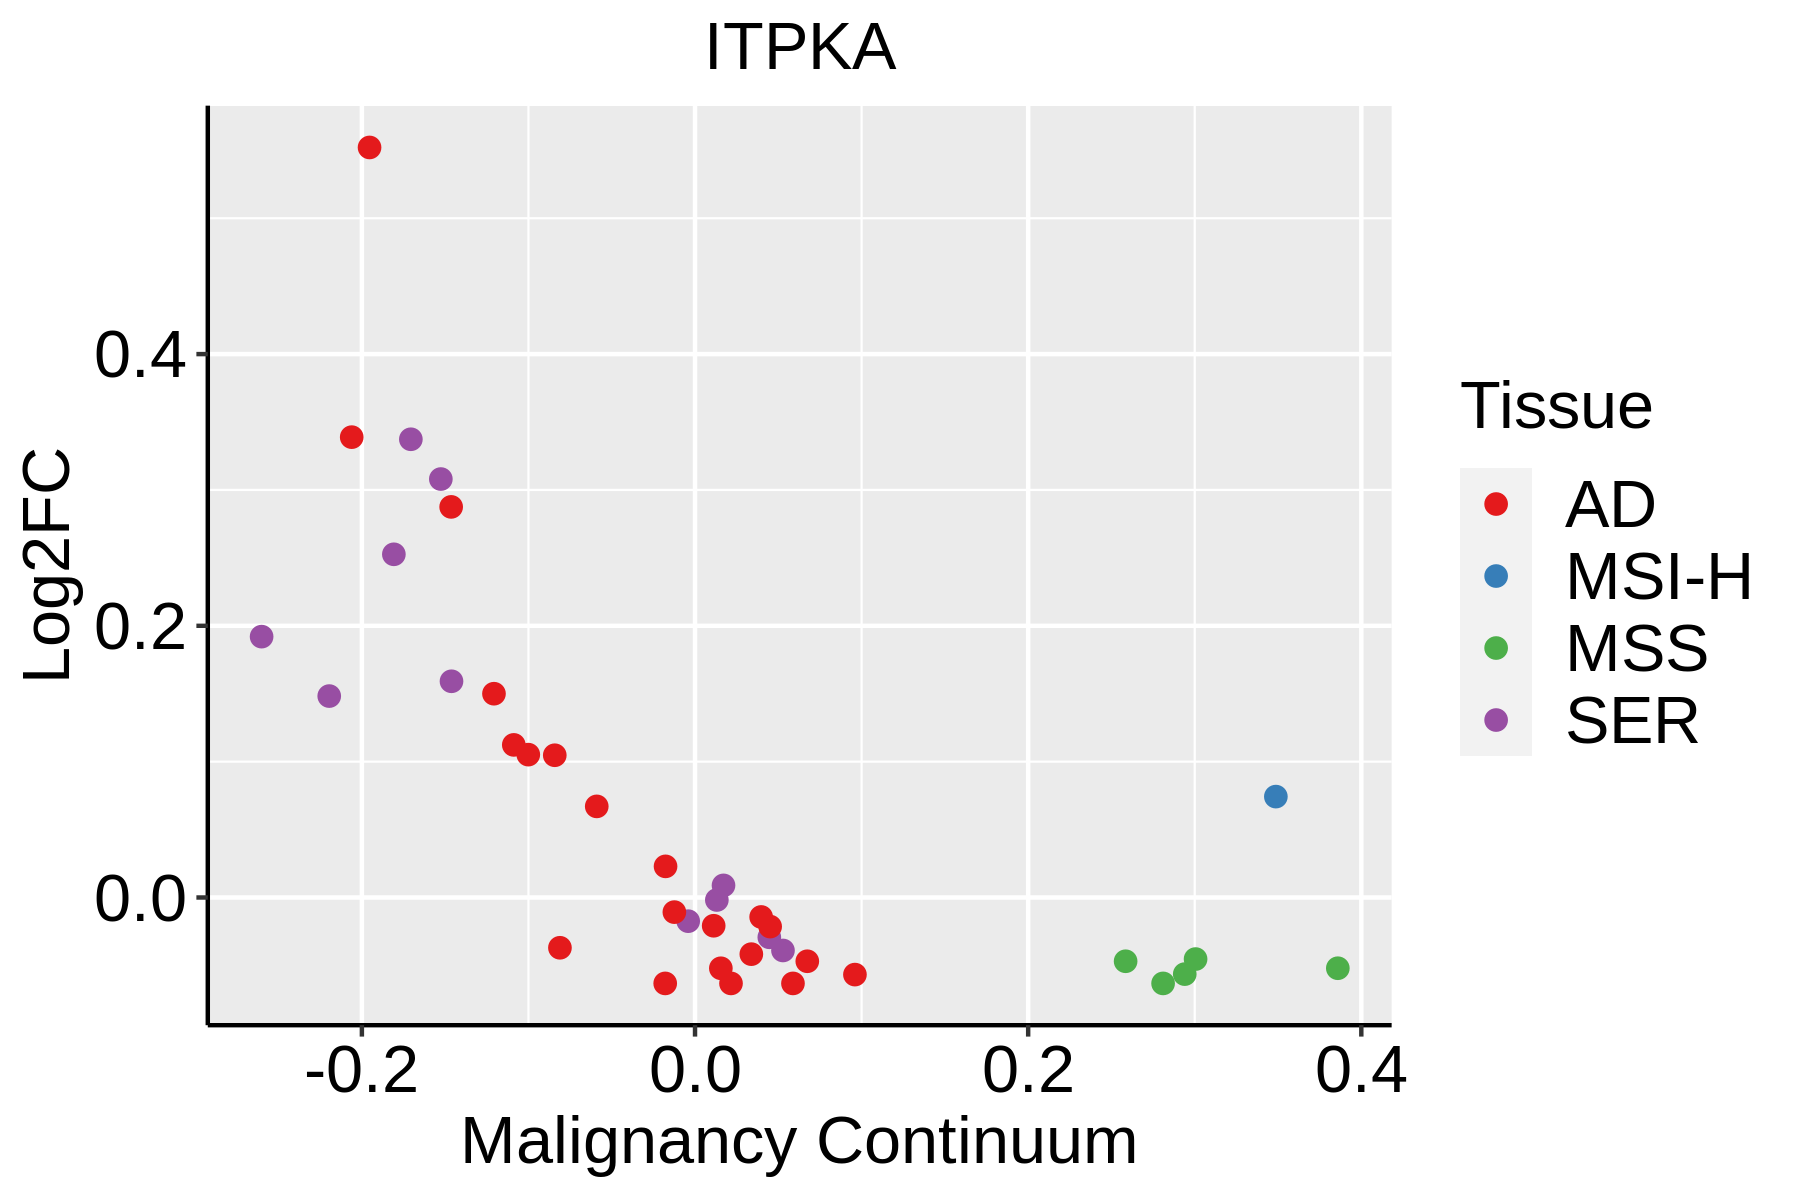 | AD: Adenomas |
| SER: Sessile serrated lesions | ||
| MSI-H: Microsatellite-high colorectal cancer | ||
| MSS: Microsatellite stable colorectal cancer |
| ∗log2FC in expression of this searched gene in stem-like cells from each diseased tissue sample relative to stem-like cells in normal samples in each tissue plotted against the malignancy continuum. Samples are colored based on if they are from different disease stage. |
Top |
Malignant transformation related pathway analysis |
| Find out the enriched GO biological processes and KEGG pathways involved in transition from healthy to precancer to cancer |
| Tissue | Disease Stage | Enriched GO biological Processes |
| Colorectum | AD |  |
| Colorectum | SER |  |
| Colorectum | MSS |  |
| Colorectum | MSI-H |  |
| Colorectum | FAP |  |
| ∗Top 15 enriched GO BP terms are showed in the bar plot of each disease state in each tissue. Each row represents a significant GO biological process which is colored according to the -log10(p.adjust). |
| Page: 1 2 3 4 5 6 7 8 9 |
| GO ID | Tissue | Disease Stage | Description | Gene Ratio | Bg Ratio | pvalue | p.adjust | Count |
| GO:0022604 | Colorectum | AD | regulation of cell morphogenesis | 109/3918 | 309/18723 | 3.08e-09 | 2.07e-07 | 109 |
| GO:0010975 | Colorectum | AD | regulation of neuron projection development | 129/3918 | 445/18723 | 2.88e-05 | 5.37e-04 | 129 |
| GO:0006066 | Colorectum | AD | alcohol metabolic process | 106/3918 | 353/18723 | 3.02e-05 | 5.57e-04 | 106 |
| GO:0044262 | Colorectum | AD | cellular carbohydrate metabolic process | 87/3918 | 283/18723 | 6.00e-05 | 1.01e-03 | 87 |
| GO:0106027 | Colorectum | AD | neuron projection organization | 36/3918 | 93/18723 | 6.58e-05 | 1.07e-03 | 36 |
| GO:0031346 | Colorectum | AD | positive regulation of cell projection organization | 104/3918 | 353/18723 | 8.26e-05 | 1.30e-03 | 104 |
| GO:0043954 | Colorectum | AD | cellular component maintenance | 26/3918 | 61/18723 | 1.04e-04 | 1.56e-03 | 26 |
| GO:0010769 | Colorectum | AD | regulation of cell morphogenesis involved in differentiation | 35/3918 | 96/18723 | 3.26e-04 | 3.85e-03 | 35 |
| GO:0010770 | Colorectum | AD | positive regulation of cell morphogenesis involved in differentiation | 30/3918 | 79/18723 | 3.81e-04 | 4.38e-03 | 30 |
| GO:0010720 | Colorectum | AD | positive regulation of cell development | 87/3918 | 298/18723 | 4.17e-04 | 4.71e-03 | 87 |
| GO:0097061 | Colorectum | AD | dendritic spine organization | 31/3918 | 84/18723 | 5.48e-04 | 5.83e-03 | 31 |
| GO:0050767 | Colorectum | AD | regulation of neurogenesis | 99/3918 | 364/18723 | 2.35e-03 | 1.82e-02 | 99 |
| GO:0099173 | Colorectum | AD | postsynapse organization | 51/3918 | 168/18723 | 2.47e-03 | 1.90e-02 | 51 |
| GO:0016358 | Colorectum | AD | dendrite development | 69/3918 | 243/18723 | 3.32e-03 | 2.42e-02 | 69 |
| GO:0050808 | Colorectum | AD | synapse organization | 112/3918 | 426/18723 | 4.25e-03 | 2.92e-02 | 112 |
| GO:0006650 | Colorectum | AD | glycerophospholipid metabolic process | 83/3918 | 306/18723 | 5.40e-03 | 3.55e-02 | 83 |
| GO:0050807 | Colorectum | AD | regulation of synapse organization | 60/3918 | 211/18723 | 5.67e-03 | 3.64e-02 | 60 |
| GO:0097062 | Colorectum | AD | dendritic spine maintenance | 10/3918 | 21/18723 | 5.71e-03 | 3.64e-02 | 10 |
| GO:0006644 | Colorectum | AD | phospholipid metabolic process | 101/3918 | 383/18723 | 5.80e-03 | 3.67e-02 | 101 |
| GO:0045017 | Colorectum | AD | glycerolipid biosynthetic process | 69/3918 | 252/18723 | 8.33e-03 | 4.88e-02 | 69 |
| Page: 1 2 3 |
| Pathway ID | Tissue | Disease Stage | Description | Gene Ratio | Bg Ratio | pvalue | p.adjust | qvalue | Count |
| Page: 1 |
Top |
Cell-cell communication analysis |
| Identification of potential cell-cell interactions between two cell types and their ligand-receptor pairs for different disease states |
| Ligand | Receptor | LRpair | Pathway | Tissue | Disease Stage |
| Page: 1 |
Top |
Single-cell gene regulatory network inference analysis |
| Find out the significant the regulons (TFs) and the target genes of each regulon across cell types for different disease states |
| TF | Cell Type | Tissue | Disease Stage | Target Gene | RSS | Regulon Activity |
| ∗The dot plots of a searched regulon are shown for all cell subpopulations in each disease state of each tissue based on the regulon specific score inferred using pySCENIC and by calculating the average expression. |
| Page: 1 |
Top |
Somatic mutation of malignant transformation related genes |
| Annotation of somatic variants for genes involved in malignant transformation |
| Hugo Symbol | Variant Class | Variant Classification | dbSNP RS | HGVSc | HGVSp | HGVSp Short | SWISSPROT | BIOTYPE | SIFT | PolyPhen | Tumor Sample Barcode | Tissue | Histology | Sex | Age | Stage | Therapy Types | Drugs | Outcome |
| ITPKA | SNV | Missense_Mutation | c.457N>T | p.Val153Leu | p.V153L | P23677 | protein_coding | tolerated(0.55) | benign(0.393) | TCGA-IR-A3LF-01 | Cervix | cervical & endocervical cancer | Female | <65 | I/II | Unknown | Unknown | SD | |
| ITPKA | SNV | Missense_Mutation | rs772076582 | c.928N>A | p.Val310Ile | p.V310I | P23677 | protein_coding | tolerated(0.09) | probably_damaging(0.989) | TCGA-D5-7000-01 | Colorectum | colon adenocarcinoma | Female | >=65 | I/II | Unknown | Unknown | SD |
| ITPKA | insertion | Frame_Shift_Ins | novel | c.863_866dupTGTA | p.Lys290ValfsTer10 | p.K290Vfs*10 | P23677 | protein_coding | TCGA-CM-4752-01 | Colorectum | colon adenocarcinoma | Male | <65 | I/II | Unknown | Unknown | SD | ||
| ITPKA | SNV | Missense_Mutation | novel | c.1172N>A | p.Arg391Lys | p.R391K | P23677 | protein_coding | tolerated(1) | benign(0.011) | TCGA-A5-A0G1-01 | Endometrium | uterine corpus endometrioid carcinoma | Female | >=65 | I/II | Unknown | Unknown | SD |
| ITPKA | SNV | Missense_Mutation | rs761372084 | c.1104A>C | p.Glu368Asp | p.E368D | P23677 | protein_coding | tolerated(0.44) | benign(0.003) | TCGA-A5-A2K5-01 | Endometrium | uterine corpus endometrioid carcinoma | Female | >=65 | I/II | Unknown | Unknown | SD |
| ITPKA | SNV | Missense_Mutation | c.1046C>T | p.Thr349Met | p.T349M | P23677 | protein_coding | deleterious(0) | probably_damaging(1) | TCGA-AX-A2HC-01 | Endometrium | uterine corpus endometrioid carcinoma | Female | <65 | III/IV | Chemotherapy | paclitaxel | PD | |
| ITPKA | SNV | Missense_Mutation | novel | c.781N>A | p.Leu261Ile | p.L261I | P23677 | protein_coding | deleterious(0) | benign(0.417) | TCGA-B5-A1MX-01 | Endometrium | uterine corpus endometrioid carcinoma | Female | <65 | I/II | Hormone Therapy | megace | SD |
| ITPKA | SNV | Missense_Mutation | novel | c.641C>T | p.Pro214Leu | p.P214L | P23677 | protein_coding | tolerated(0.31) | benign(0.024) | TCGA-DF-A2KU-01 | Endometrium | uterine corpus endometrioid carcinoma | Female | Unknown | I/II | Unknown | Unknown | SD |
| ITPKA | SNV | Missense_Mutation | novel | c.938C>T | p.Pro313Leu | p.P313L | P23677 | protein_coding | deleterious(0.01) | probably_damaging(1) | TCGA-DF-A2KU-01 | Endometrium | uterine corpus endometrioid carcinoma | Female | Unknown | I/II | Unknown | Unknown | SD |
| ITPKA | SNV | Missense_Mutation | novel | c.931N>G | p.Thr311Ala | p.T311A | P23677 | protein_coding | deleterious(0.01) | probably_damaging(0.993) | TCGA-DI-A1BU-01 | Endometrium | uterine corpus endometrioid carcinoma | Female | <65 | I/II | Chemotherapy | paclitaxel | SD |
| Page: 1 2 |
Top |
Related drugs of malignant transformation related genes |
| Identification of chemicals and drugs interact with genes involved in malignant transfromation |
| (DGIdb 4.0) |
| Entrez ID | Symbol | Category | Interaction Types | Drug Claim Name | Drug Name | PMIDs |
| 3706 | ITPKA | KINASE, ENZYME | inhibitor | 336446934 |
| Page: 1 |

Copyright 2023-Present -The University of Texas Health Science Center at Houston |