
|
|||||
|
 | |
| |
| |
| |
| |
| |
|
Gene: ITPK1 |
Gene summary for ITPK1 |
| Gene information | Species | Human | Gene symbol | ITPK1 | Gene ID | 3705 |
| Gene name | inositol-tetrakisphosphate 1-kinase | |
| Gene Alias | ITRPK1 | |
| Cytomap | 14q32.12 | |
| Gene Type | protein-coding | GO ID | GO:0005975 | UniProtAcc | A0A024R6H3 |
Top |
Malignant transformation analysis |
| Identification of the aberrant gene expression in precancerous and cancerous lesions by comparing the gene expression of stem-like cells in diseased tissues with normal stem cells |
| Entrez ID | Symbol | Replicates | Species | Organ | Tissue | Adj P-value | Log2FC | Malignancy |
| 3705 | ITPK1 | HTA11_2487_2000001011 | Human | Colorectum | SER | 5.66e-06 | 5.22e-01 | -0.1808 |
| 3705 | ITPK1 | HTA11_1938_2000001011 | Human | Colorectum | AD | 4.11e-04 | 4.93e-01 | -0.0811 |
| 3705 | ITPK1 | HTA11_347_2000001011 | Human | Colorectum | AD | 4.54e-07 | 3.68e-01 | -0.1954 |
| 3705 | ITPK1 | HTA11_411_2000001011 | Human | Colorectum | SER | 7.85e-05 | 8.23e-01 | -0.2602 |
| 3705 | ITPK1 | HTA11_83_2000001011 | Human | Colorectum | SER | 2.29e-02 | 4.28e-01 | -0.1526 |
| 3705 | ITPK1 | HTA11_696_2000001011 | Human | Colorectum | AD | 3.33e-06 | 4.41e-01 | -0.1464 |
| 3705 | ITPK1 | HTA11_1391_2000001011 | Human | Colorectum | AD | 6.41e-07 | 6.07e-01 | -0.059 |
| 3705 | ITPK1 | HTA11_7696_3000711011 | Human | Colorectum | AD | 1.75e-02 | 2.86e-01 | 0.0674 |
| 3705 | ITPK1 | A015-C-203 | Human | Colorectum | FAP | 2.07e-10 | -3.25e-01 | -0.1294 |
| 3705 | ITPK1 | A002-C-201 | Human | Colorectum | FAP | 2.10e-02 | -1.76e-01 | 0.0324 |
| 3705 | ITPK1 | A001-C-119 | Human | Colorectum | FAP | 2.72e-02 | -2.69e-01 | -0.1557 |
| 3705 | ITPK1 | A001-C-108 | Human | Colorectum | FAP | 1.70e-02 | -1.08e-01 | -0.0272 |
| 3705 | ITPK1 | A002-C-205 | Human | Colorectum | FAP | 7.65e-08 | -2.85e-01 | -0.1236 |
| 3705 | ITPK1 | A015-C-006 | Human | Colorectum | FAP | 2.08e-05 | -3.27e-01 | -0.0994 |
| 3705 | ITPK1 | A015-C-106 | Human | Colorectum | FAP | 5.08e-06 | -1.77e-01 | -0.0511 |
| 3705 | ITPK1 | A002-C-114 | Human | Colorectum | FAP | 2.36e-06 | -2.99e-01 | -0.1561 |
| 3705 | ITPK1 | A015-C-104 | Human | Colorectum | FAP | 1.37e-11 | -2.78e-01 | -0.1899 |
| 3705 | ITPK1 | A001-C-014 | Human | Colorectum | FAP | 4.46e-03 | -1.59e-01 | 0.0135 |
| 3705 | ITPK1 | A002-C-016 | Human | Colorectum | FAP | 1.50e-05 | -1.71e-01 | 0.0521 |
| 3705 | ITPK1 | A001-C-203 | Human | Colorectum | FAP | 1.45e-04 | -1.54e-01 | -0.0481 |
| Page: 1 2 3 4 5 |
| Tissue | Expression Dynamics | Abbreviation |
| Colorectum (GSE201348) |  | FAP: Familial adenomatous polyposis |
| CRC: Colorectal cancer | ||
| Colorectum (HTA11) |  | AD: Adenomas |
| SER: Sessile serrated lesions | ||
| MSI-H: Microsatellite-high colorectal cancer | ||
| MSS: Microsatellite stable colorectal cancer | ||
| Esophagus | 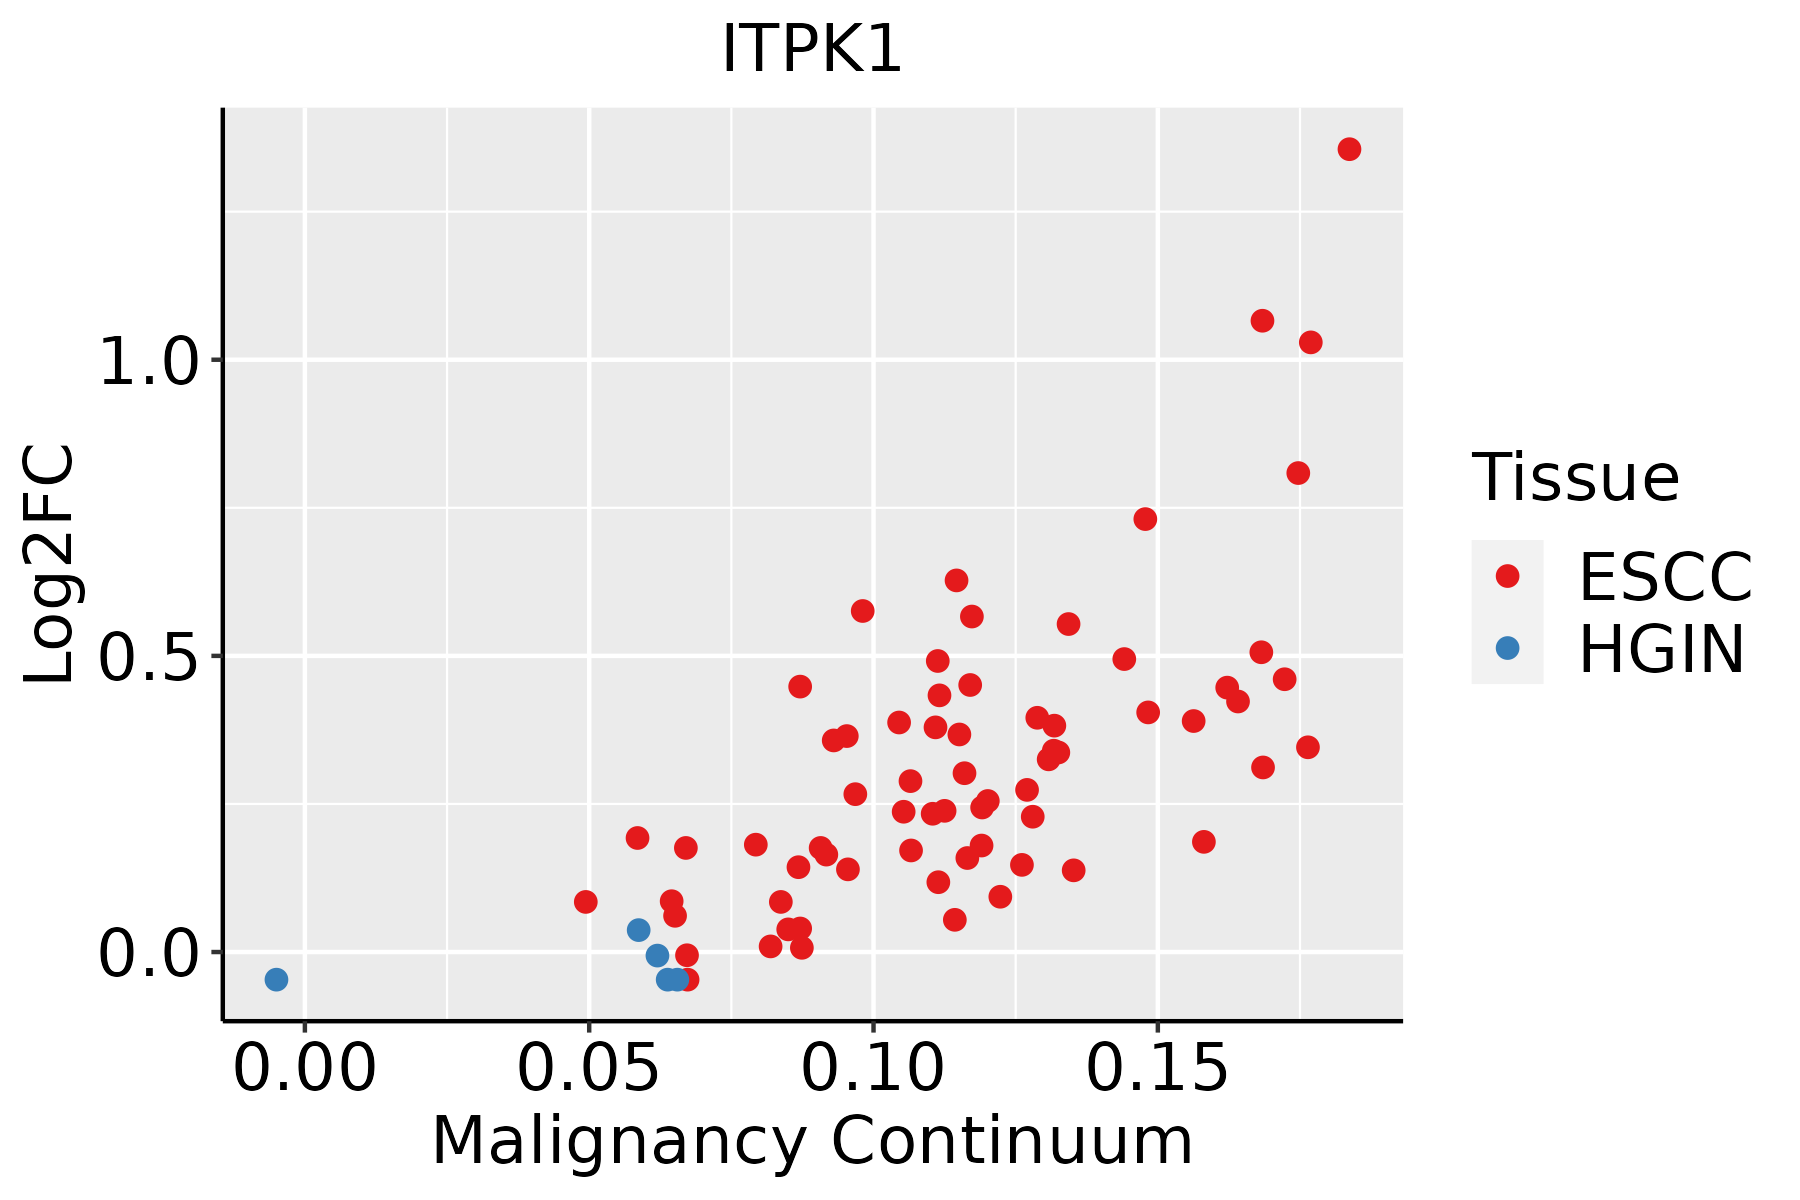 | ESCC: Esophageal squamous cell carcinoma |
| HGIN: High-grade intraepithelial neoplasias | ||
| LGIN: Low-grade intraepithelial neoplasias | ||
| Liver |  | HCC: Hepatocellular carcinoma |
| NAFLD: Non-alcoholic fatty liver disease | ||
| Oral Cavity | 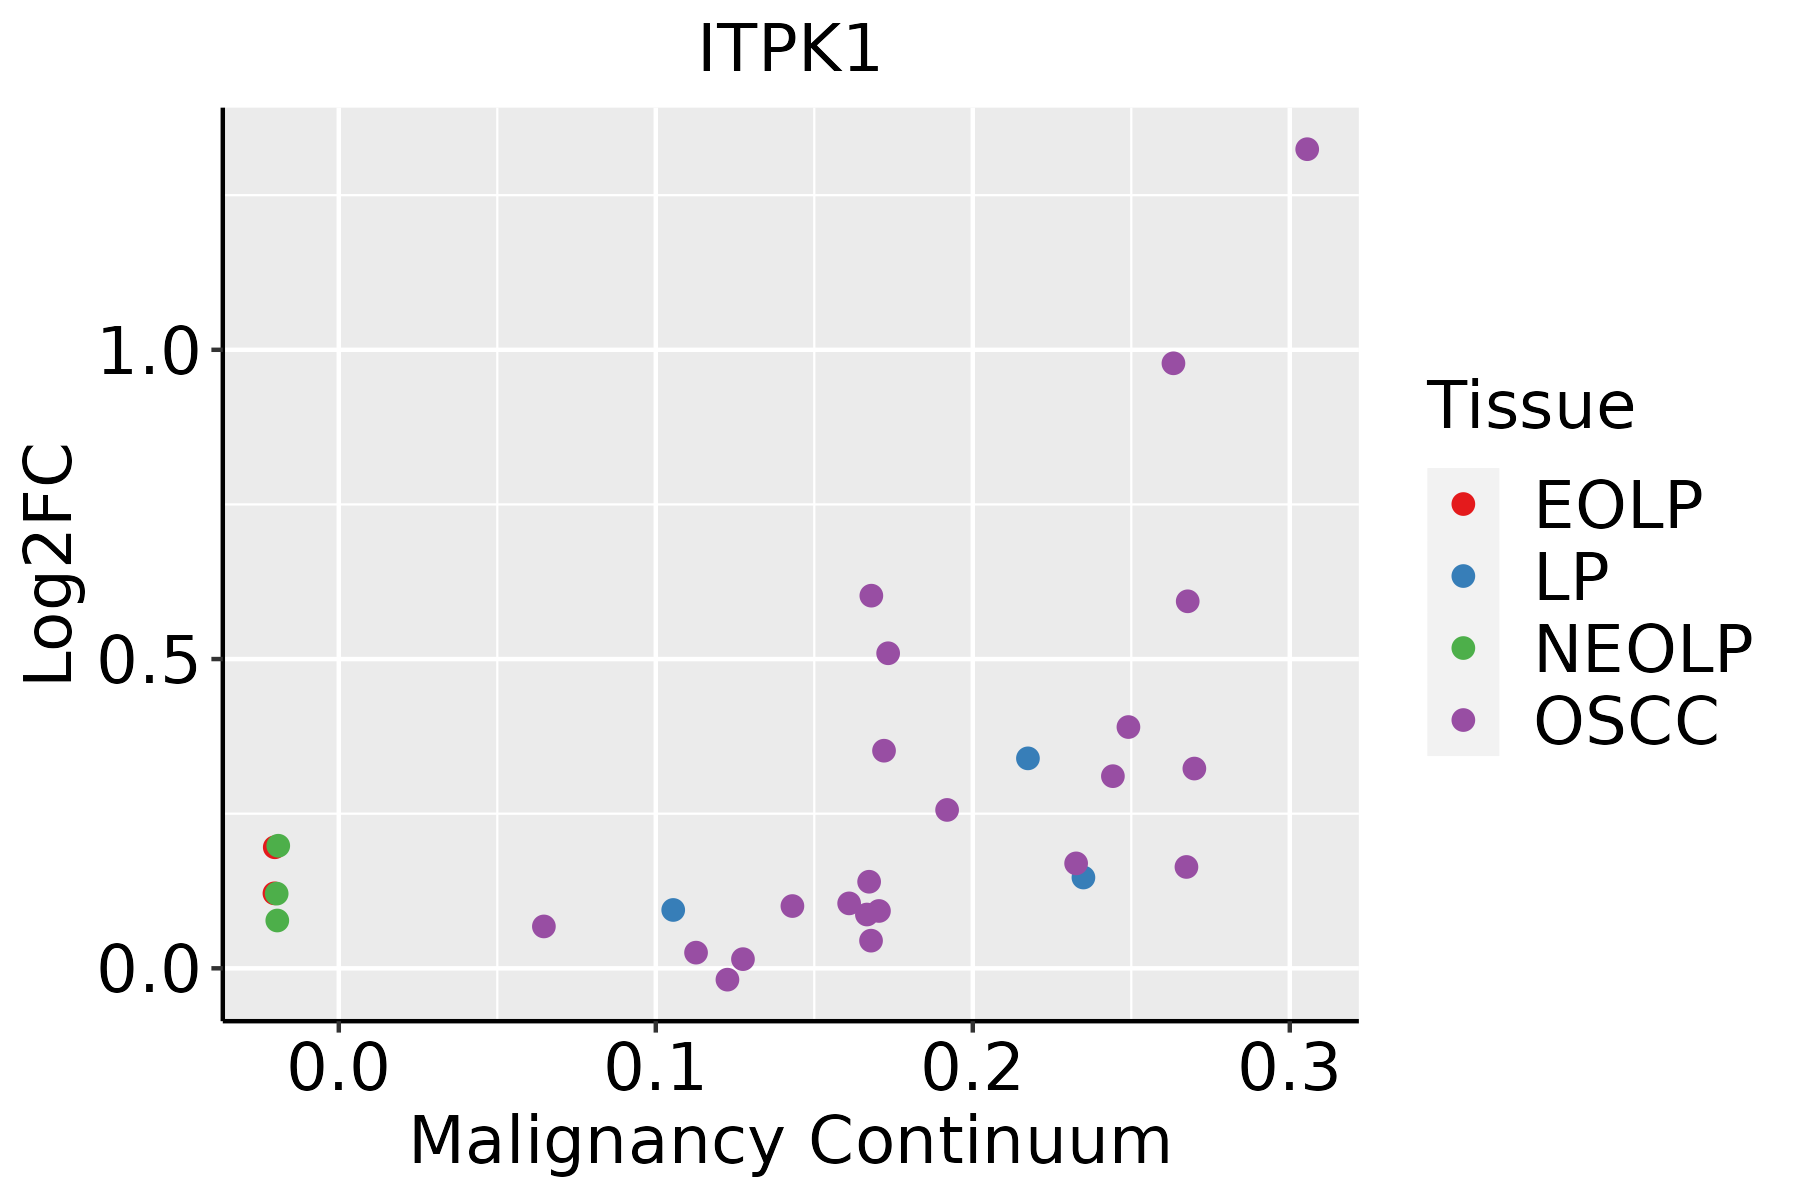 | EOLP: Erosive Oral lichen planus |
| LP: leukoplakia | ||
| NEOLP: Non-erosive oral lichen planus | ||
| OSCC: Oral squamous cell carcinoma |
| ∗log2FC in expression of this searched gene in stem-like cells from each diseased tissue sample relative to stem-like cells in normal samples in each tissue plotted against the malignancy continuum. Samples are colored based on if they are from different disease stage. |
Top |
Malignant transformation related pathway analysis |
| Find out the enriched GO biological processes and KEGG pathways involved in transition from healthy to precancer to cancer |
| Tissue | Disease Stage | Enriched GO biological Processes |
| Colorectum | AD |  |
| Colorectum | SER |  |
| Colorectum | MSS |  |
| Colorectum | MSI-H |  |
| Colorectum | FAP |  |
| ∗Top 15 enriched GO BP terms are showed in the bar plot of each disease state in each tissue. Each row represents a significant GO biological process which is colored according to the -log10(p.adjust). |
| Page: 1 2 3 4 5 6 7 8 9 |
| GO ID | Tissue | Disease Stage | Description | Gene Ratio | Bg Ratio | pvalue | p.adjust | Count |
| GO:0042060 | Colorectum | AD | wound healing | 128/3918 | 422/18723 | 2.73e-06 | 7.89e-05 | 128 |
| GO:0006066 | Colorectum | AD | alcohol metabolic process | 106/3918 | 353/18723 | 3.02e-05 | 5.57e-04 | 106 |
| GO:0044262 | Colorectum | AD | cellular carbohydrate metabolic process | 87/3918 | 283/18723 | 6.00e-05 | 1.01e-03 | 87 |
| GO:0050878 | Colorectum | AD | regulation of body fluid levels | 108/3918 | 379/18723 | 2.54e-04 | 3.20e-03 | 108 |
| GO:0021915 | Colorectum | AD | neural tube development | 45/3918 | 152/18723 | 7.05e-03 | 4.31e-02 | 45 |
| GO:00420601 | Colorectum | SER | wound healing | 97/2897 | 422/18723 | 2.69e-05 | 7.30e-04 | 97 |
| GO:00060661 | Colorectum | SER | alcohol metabolic process | 79/2897 | 353/18723 | 3.50e-04 | 5.50e-03 | 79 |
| GO:00508781 | Colorectum | SER | regulation of body fluid levels | 81/2897 | 379/18723 | 1.28e-03 | 1.43e-02 | 81 |
| GO:00420604 | Colorectum | FAP | wound healing | 99/2622 | 422/18723 | 9.50e-08 | 6.33e-06 | 99 |
| GO:00442621 | Colorectum | FAP | cellular carbohydrate metabolic process | 66/2622 | 283/18723 | 1.53e-05 | 4.01e-04 | 66 |
| GO:00508784 | Colorectum | FAP | regulation of body fluid levels | 79/2622 | 379/18723 | 1.52e-04 | 2.35e-03 | 79 |
| GO:00219152 | Colorectum | FAP | neural tube development | 36/2622 | 152/18723 | 9.05e-04 | 9.17e-03 | 36 |
| GO:00060663 | Colorectum | FAP | alcohol metabolic process | 69/2622 | 353/18723 | 2.29e-03 | 1.85e-02 | 69 |
| GO:00420605 | Colorectum | CRC | wound healing | 80/2078 | 422/18723 | 1.06e-06 | 6.54e-05 | 80 |
| GO:00508785 | Colorectum | CRC | regulation of body fluid levels | 65/2078 | 379/18723 | 2.38e-04 | 3.96e-03 | 65 |
| GO:00442622 | Colorectum | CRC | cellular carbohydrate metabolic process | 49/2078 | 283/18723 | 1.06e-03 | 1.24e-02 | 49 |
| GO:00219153 | Colorectum | CRC | neural tube development | 30/2078 | 152/18723 | 1.21e-03 | 1.38e-02 | 30 |
| GO:00060664 | Colorectum | CRC | alcohol metabolic process | 57/2078 | 353/18723 | 2.37e-03 | 2.27e-02 | 57 |
| GO:0019751 | Colorectum | CRC | polyol metabolic process | 22/2078 | 114/18723 | 6.73e-03 | 4.77e-02 | 22 |
| GO:00219159 | Esophagus | ESCC | neural tube development | 101/8552 | 152/18723 | 1.78e-07 | 2.79e-06 | 101 |
| Page: 1 2 3 |
| Pathway ID | Tissue | Disease Stage | Description | Gene Ratio | Bg Ratio | pvalue | p.adjust | qvalue | Count |
| hsa04070 | Colorectum | CRC | Phosphatidylinositol signaling system | 25/1091 | 97/8465 | 4.27e-04 | 4.60e-03 | 3.12e-03 | 25 |
| hsa00562 | Colorectum | CRC | Inositol phosphate metabolism | 18/1091 | 73/8465 | 4.38e-03 | 2.52e-02 | 1.71e-02 | 18 |
| hsa040701 | Colorectum | CRC | Phosphatidylinositol signaling system | 25/1091 | 97/8465 | 4.27e-04 | 4.60e-03 | 3.12e-03 | 25 |
| hsa005621 | Colorectum | CRC | Inositol phosphate metabolism | 18/1091 | 73/8465 | 4.38e-03 | 2.52e-02 | 1.71e-02 | 18 |
| Page: 1 |
Top |
Cell-cell communication analysis |
| Identification of potential cell-cell interactions between two cell types and their ligand-receptor pairs for different disease states |
| Ligand | Receptor | LRpair | Pathway | Tissue | Disease Stage |
| Page: 1 |
Top |
Single-cell gene regulatory network inference analysis |
| Find out the significant the regulons (TFs) and the target genes of each regulon across cell types for different disease states |
| TF | Cell Type | Tissue | Disease Stage | Target Gene | RSS | Regulon Activity |
| ∗The dot plots of a searched regulon are shown for all cell subpopulations in each disease state of each tissue based on the regulon specific score inferred using pySCENIC and by calculating the average expression. |
| Page: 1 |
Top |
Somatic mutation of malignant transformation related genes |
| Annotation of somatic variants for genes involved in malignant transformation |
| Hugo Symbol | Variant Class | Variant Classification | dbSNP RS | HGVSc | HGVSp | HGVSp Short | SWISSPROT | BIOTYPE | SIFT | PolyPhen | Tumor Sample Barcode | Tissue | Histology | Sex | Age | Stage | Therapy Types | Drugs | Outcome |
| ITPK1 | SNV | Missense_Mutation | rs767945252 | c.778N>A | p.Glu260Lys | p.E260K | Q13572 | protein_coding | tolerated(0.08) | benign(0.392) | TCGA-3C-AALI-01 | Breast | breast invasive carcinoma | Female | <65 | I/II | Unspecific | Poly E | Complete Response |
| ITPK1 | SNV | Missense_Mutation | rs750906842 | c.604N>A | p.Val202Met | p.V202M | Q13572 | protein_coding | deleterious(0.02) | possibly_damaging(0.764) | TCGA-EK-A2GZ-01 | Cervix | cervical & endocervical cancer | Female | <65 | III/IV | Unknown | Unknown | SD |
| ITPK1 | SNV | Missense_Mutation | c.202N>A | p.Asp68Asn | p.D68N | Q13572 | protein_coding | tolerated(0.11) | probably_damaging(0.998) | TCGA-AA-A010-01 | Colorectum | colon adenocarcinoma | Female | <65 | I/II | Chemotherapy | folinic | CR | |
| ITPK1 | SNV | Missense_Mutation | rs757596570 | c.187G>A | p.Val63Ile | p.V63I | Q13572 | protein_coding | tolerated(0.38) | benign(0.17) | TCGA-AA-A022-01 | Colorectum | colon adenocarcinoma | Female | >=65 | I/II | Unknown | Unknown | SD |
| ITPK1 | SNV | Missense_Mutation | c.848N>C | p.Ile283Thr | p.I283T | Q13572 | protein_coding | deleterious(0) | probably_damaging(1) | TCGA-CK-5916-01 | Colorectum | colon adenocarcinoma | Female | >=65 | I/II | Unknown | Unknown | PD | |
| ITPK1 | SNV | Missense_Mutation | rs766724738 | c.101N>A | p.Arg34Gln | p.R34Q | Q13572 | protein_coding | tolerated(0.14) | benign(0.006) | TCGA-AP-A054-01 | Endometrium | uterine corpus endometrioid carcinoma | Female | <65 | III/IV | Chemotherapy | carboplatin | PD |
| ITPK1 | SNV | Missense_Mutation | c.433N>A | p.Leu145Met | p.L145M | Q13572 | protein_coding | tolerated(0.11) | possibly_damaging(0.797) | TCGA-AP-A059-01 | Endometrium | uterine corpus endometrioid carcinoma | Female | >=65 | I/II | Unknown | Unknown | SD | |
| ITPK1 | SNV | Missense_Mutation | rs763407778 | c.427N>T | p.Arg143Trp | p.R143W | Q13572 | protein_coding | deleterious(0.01) | possibly_damaging(0.764) | TCGA-AX-A2HD-01 | Endometrium | uterine corpus endometrioid carcinoma | Female | >=65 | III/IV | Unknown | Unknown | SD |
| ITPK1 | SNV | Missense_Mutation | c.346N>G | p.Ile116Val | p.I116V | Q13572 | protein_coding | tolerated(0.09) | benign(0.18) | TCGA-B5-A1MR-01 | Endometrium | uterine corpus endometrioid carcinoma | Female | >=65 | III/IV | Unknown | Unknown | SD | |
| ITPK1 | SNV | Missense_Mutation | rs777045448 | c.316N>T | p.Arg106Cys | p.R106C | Q13572 | protein_coding | deleterious(0) | probably_damaging(1) | TCGA-D1-A17Q-01 | Endometrium | uterine corpus endometrioid carcinoma | Female | <65 | I/II | Unknown | Unknown | SD |
| Page: 1 2 3 4 |
Top |
Related drugs of malignant transformation related genes |
| Identification of chemicals and drugs interact with genes involved in malignant transfromation |
| (DGIdb 4.0) |
| Entrez ID | Symbol | Category | Interaction Types | Drug Claim Name | Drug Name | PMIDs |
| Page: 1 |

Copyright 2023-Present -The University of Texas Health Science Center at Houston |