
|
|||||
|
 | |
| |
| |
| |
| |
| |
|
Gene: ITM2A |
Gene summary for ITM2A |
| Gene information | Species | Human | Gene symbol | ITM2A | Gene ID | 9452 |
| Gene name | integral membrane protein 2A | |
| Gene Alias | BRICD2A | |
| Cytomap | Xq21.1 | |
| Gene Type | protein-coding | GO ID | GO:0001775 | UniProtAcc | O43736 |
Top |
Malignant transformation analysis |
| Identification of the aberrant gene expression in precancerous and cancerous lesions by comparing the gene expression of stem-like cells in diseased tissues with normal stem cells |
| Entrez ID | Symbol | Replicates | Species | Organ | Tissue | Adj P-value | Log2FC | Malignancy |
| 9452 | ITM2A | LZE2D | Human | Esophagus | HGIN | 1.58e-03 | 2.29e-01 | 0.0642 |
| 9452 | ITM2A | LZE6T | Human | Esophagus | ESCC | 1.99e-05 | 5.79e-01 | 0.0845 |
| 9452 | ITM2A | P10T-E | Human | Esophagus | ESCC | 8.17e-71 | 1.84e+00 | 0.116 |
| 9452 | ITM2A | P20T-E | Human | Esophagus | ESCC | 3.58e-03 | -1.95e-01 | 0.1124 |
| 9452 | ITM2A | P26T-E | Human | Esophagus | ESCC | 7.32e-15 | 4.22e-01 | 0.1276 |
| 9452 | ITM2A | P62T-E | Human | Esophagus | ESCC | 4.17e-03 | -2.47e-01 | 0.1302 |
| 9452 | ITM2A | P75T-E | Human | Esophagus | ESCC | 1.66e-02 | -2.57e-01 | 0.1125 |
| 9452 | ITM2A | P76T-E | Human | Esophagus | ESCC | 9.23e-06 | -1.51e-02 | 0.1207 |
| 9452 | ITM2A | P127T-E | Human | Esophagus | ESCC | 2.89e-02 | -2.42e-01 | 0.0826 |
| 9452 | ITM2A | C38 | Human | Oral cavity | OSCC | 1.30e-09 | 1.53e+00 | 0.172 |
| 9452 | ITM2A | LN38 | Human | Oral cavity | OSCC | 4.67e-02 | 1.31e+00 | 0.168 |
| 9452 | ITM2A | LP17 | Human | Oral cavity | LP | 8.57e-11 | 1.86e+00 | 0.2349 |
| 9452 | ITM2A | SYSMH1 | Human | Oral cavity | OSCC | 1.77e-03 | -2.08e-01 | 0.1127 |
| 9452 | ITM2A | SYSMH4 | Human | Oral cavity | OSCC | 2.62e-08 | 3.22e-01 | 0.1226 |
| 9452 | ITM2A | P3_S6_AK | Human | Skin | AK | 1.33e-05 | -4.04e-01 | -0.3256 |
| 9452 | ITM2A | P4_S8_cSCC | Human | Skin | cSCC | 2.03e-09 | -1.47e-01 | -0.3095 |
| 9452 | ITM2A | P5_S10_cSCC | Human | Skin | cSCC | 1.65e-18 | -5.68e-01 | -0.299 |
| 9452 | ITM2A | cSCC_p10 | Human | Skin | cSCC | 5.87e-18 | -5.55e-01 | -0.2095 |
| 9452 | ITM2A | cSCC_p11 | Human | Skin | cSCC | 1.13e-09 | -5.05e-01 | -0.2102 |
| 9452 | ITM2A | cSCC_p3 | Human | Skin | cSCC | 8.98e-04 | -4.22e-01 | -0.2085 |
| Page: 1 2 |
| Tissue | Expression Dynamics | Abbreviation |
| Esophagus | 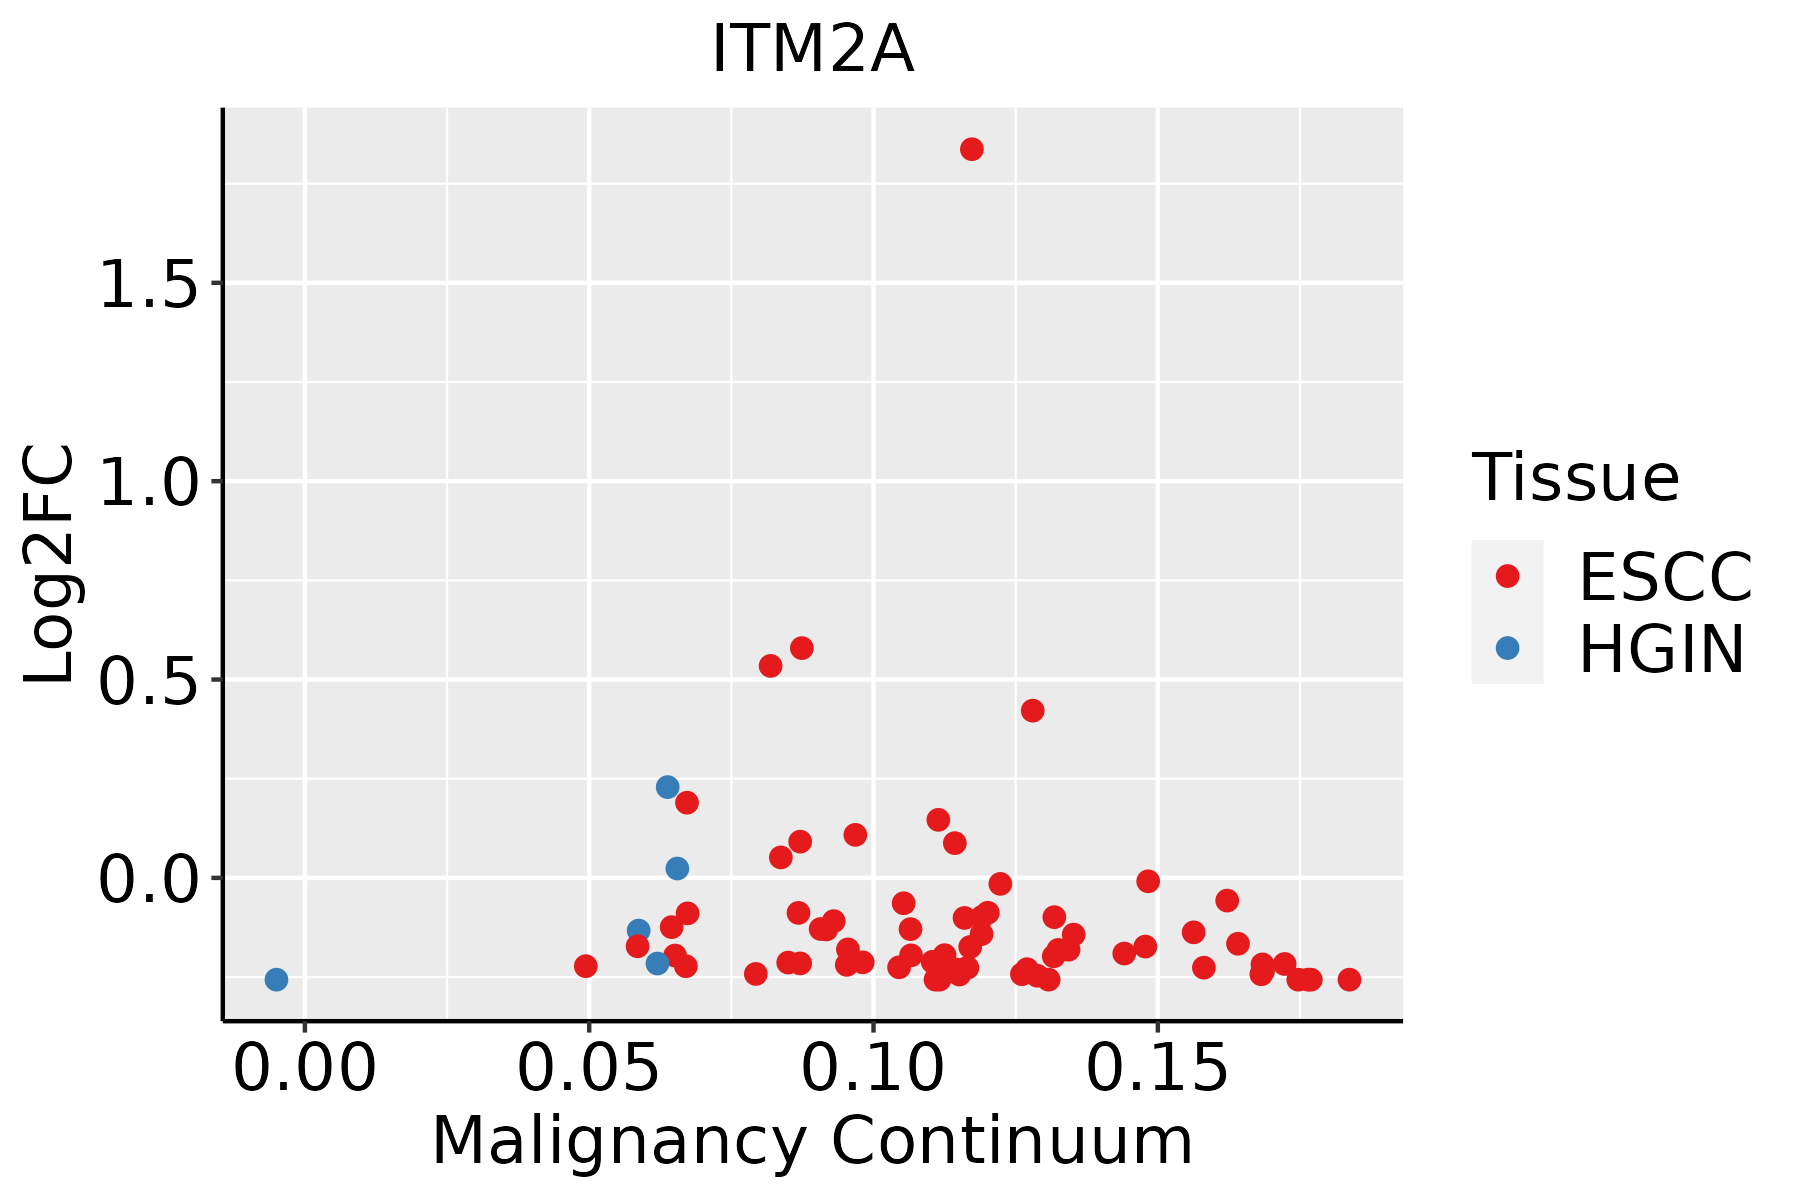 | ESCC: Esophageal squamous cell carcinoma |
| HGIN: High-grade intraepithelial neoplasias | ||
| LGIN: Low-grade intraepithelial neoplasias | ||
| Oral Cavity | 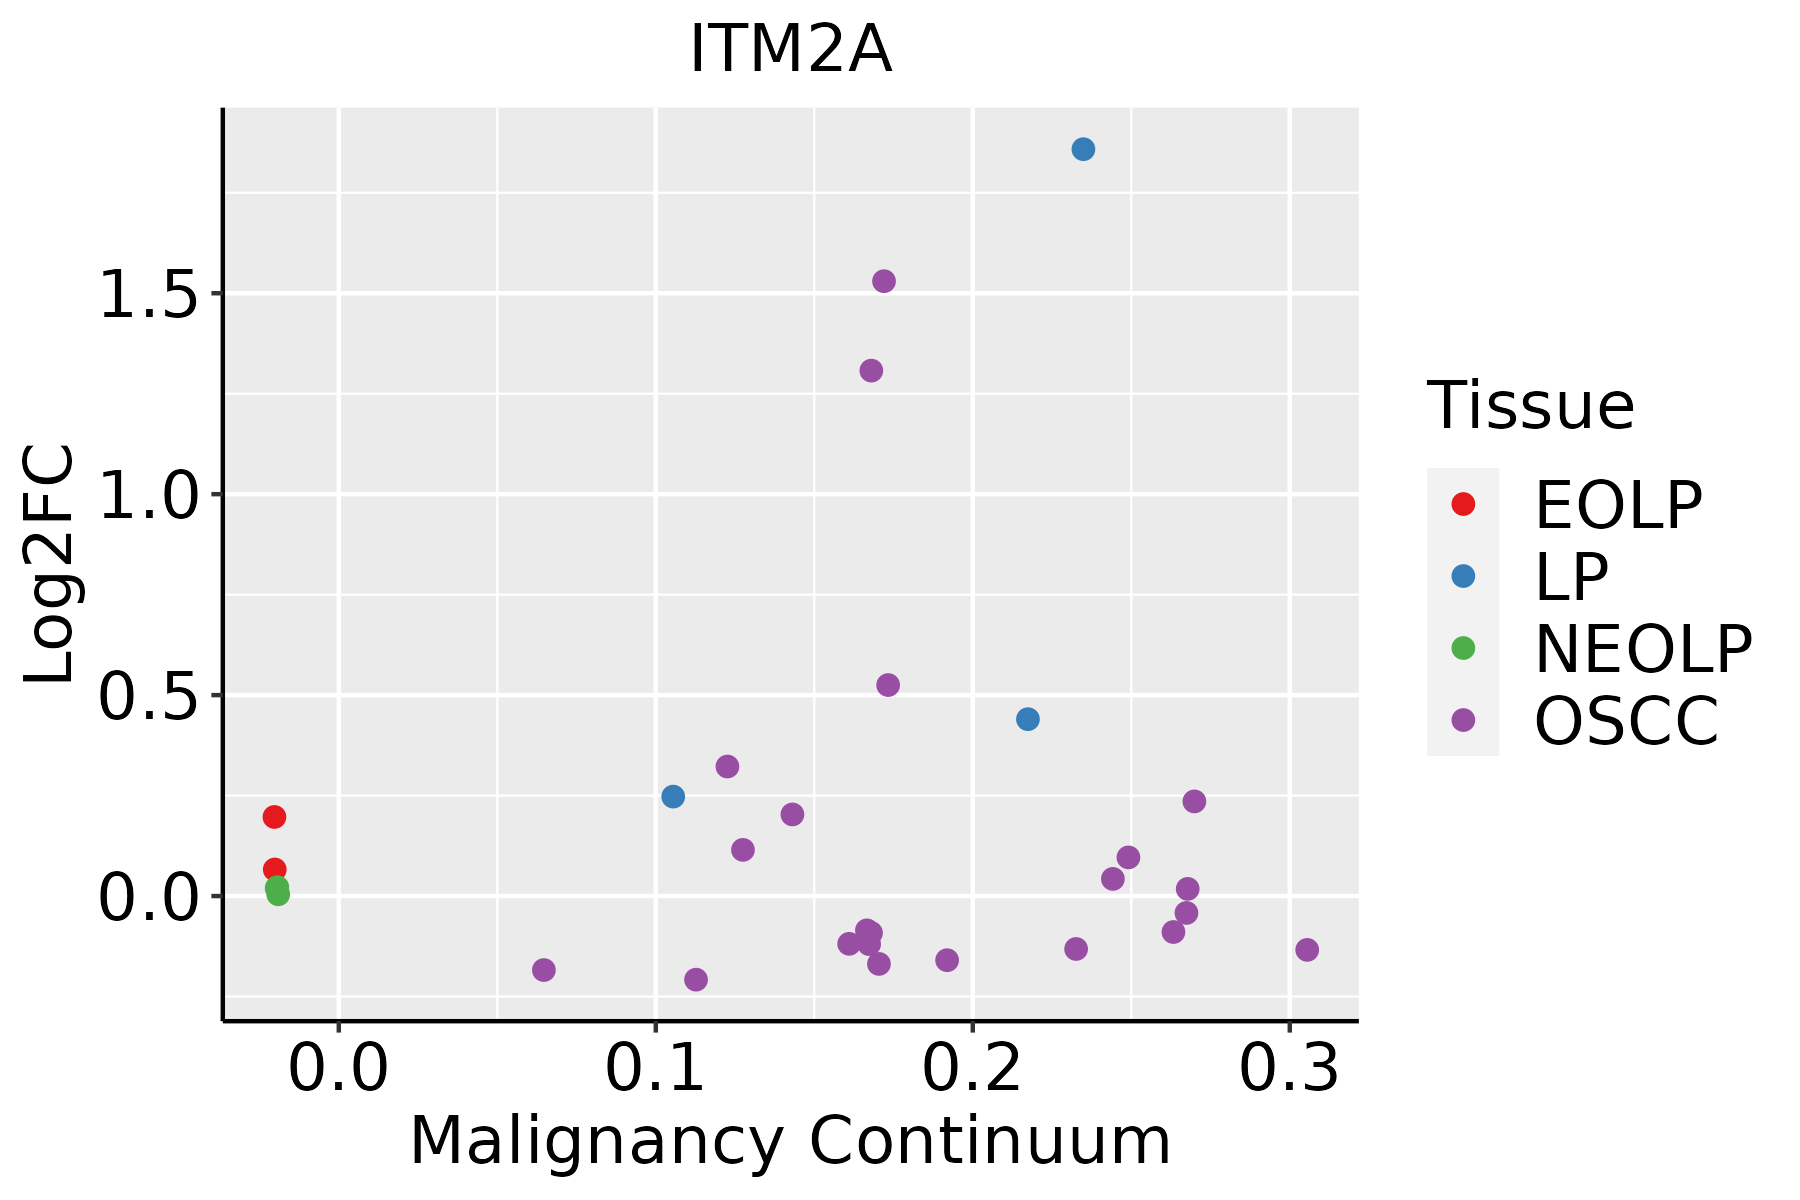 | EOLP: Erosive Oral lichen planus |
| LP: leukoplakia | ||
| NEOLP: Non-erosive oral lichen planus | ||
| OSCC: Oral squamous cell carcinoma | ||
| Skin | 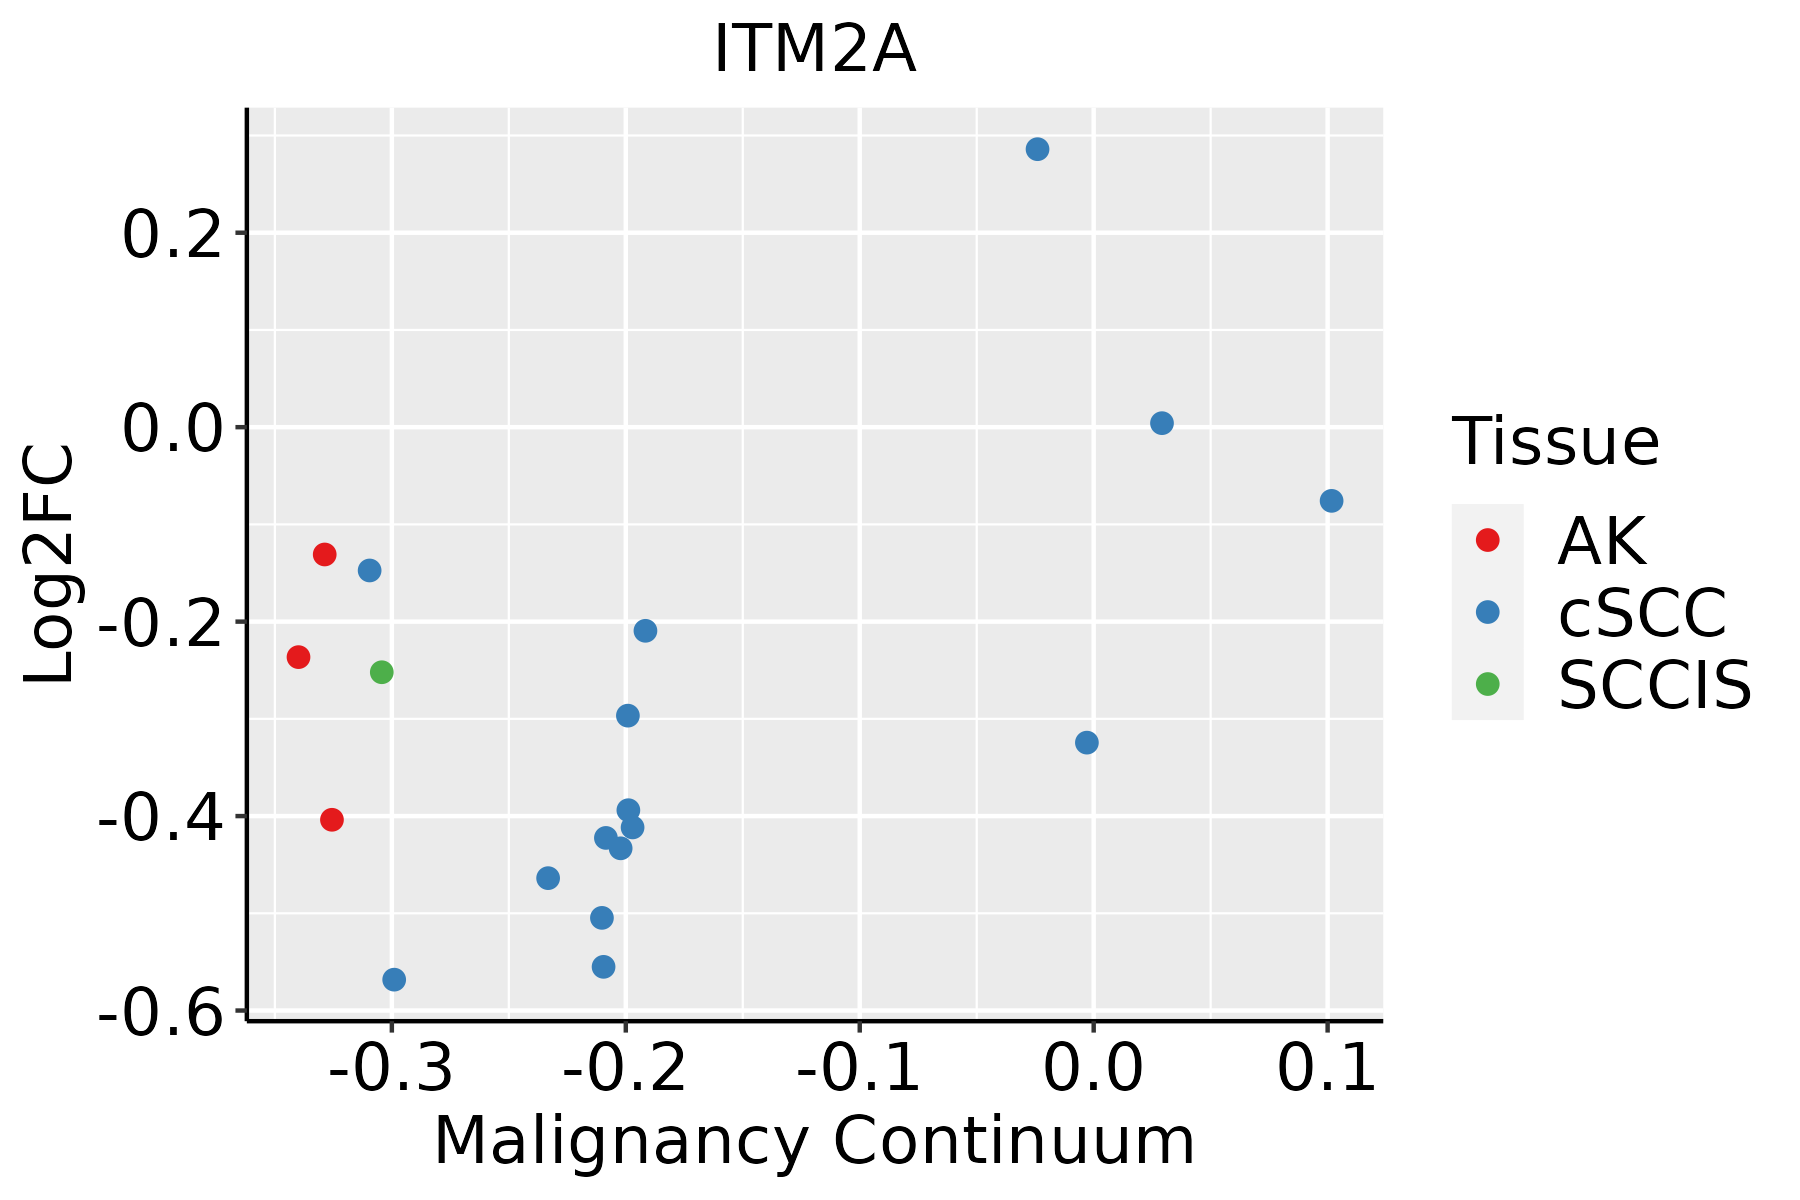 | AK: Actinic keratosis |
| cSCC: Cutaneous squamous cell carcinoma | ||
| SCCIS:squamous cell carcinoma in situ |
| ∗log2FC in expression of this searched gene in stem-like cells from each diseased tissue sample relative to stem-like cells in normal samples in each tissue plotted against the malignancy continuum. Samples are colored based on if they are from different disease stage. |
Top |
Malignant transformation related pathway analysis |
| Find out the enriched GO biological processes and KEGG pathways involved in transition from healthy to precancer to cancer |
| Tissue | Disease Stage | Enriched GO biological Processes |
| Colorectum | AD |  |
| Colorectum | SER |  |
| Colorectum | MSS |  |
| Colorectum | MSI-H |  |
| Colorectum | FAP |  |
| ∗Top 15 enriched GO BP terms are showed in the bar plot of each disease state in each tissue. Each row represents a significant GO biological process which is colored according to the -log10(p.adjust). |
| Page: 1 2 3 4 5 6 7 8 9 |
| GO ID | Tissue | Disease Stage | Description | Gene Ratio | Bg Ratio | pvalue | p.adjust | Count |
| GO:00091002 | Esophagus | ESCC | glycoprotein metabolic process | 226/8552 | 387/18723 | 2.64e-07 | 3.94e-06 | 226 |
| GO:00091012 | Esophagus | ESCC | glycoprotein biosynthetic process | 181/8552 | 317/18723 | 2.54e-05 | 2.15e-04 | 181 |
| GO:19031317 | Esophagus | ESCC | mononuclear cell differentiation | 226/8552 | 426/18723 | 1.20e-03 | 5.88e-03 | 226 |
| GO:00300984 | Esophagus | ESCC | lymphocyte differentiation | 192/8552 | 374/18723 | 1.52e-02 | 4.93e-02 | 192 |
| GO:19031316 | Oral cavity | OSCC | mononuclear cell differentiation | 210/7305 | 426/18723 | 8.44e-06 | 9.02e-05 | 210 |
| GO:00091001 | Oral cavity | OSCC | glycoprotein metabolic process | 185/7305 | 387/18723 | 2.37e-04 | 1.54e-03 | 185 |
| GO:00300983 | Oral cavity | OSCC | lymphocyte differentiation | 179/7305 | 374/18723 | 2.74e-04 | 1.74e-03 | 179 |
| GO:00091011 | Oral cavity | OSCC | glycoprotein biosynthetic process | 151/7305 | 317/18723 | 1.01e-03 | 5.26e-03 | 151 |
| GO:00429823 | Oral cavity | OSCC | amyloid precursor protein metabolic process | 52/7305 | 95/18723 | 1.33e-03 | 6.62e-03 | 52 |
| GO:004298211 | Oral cavity | LP | amyloid precursor protein metabolic process | 37/4623 | 95/18723 | 1.45e-03 | 1.14e-02 | 37 |
| GO:19031318 | Skin | AK | mononuclear cell differentiation | 65/1910 | 426/18723 | 6.24e-04 | 5.45e-03 | 65 |
| GO:00300985 | Skin | AK | lymphocyte differentiation | 57/1910 | 374/18723 | 1.34e-03 | 1.00e-02 | 57 |
| GO:00429824 | Skin | AK | amyloid precursor protein metabolic process | 19/1910 | 95/18723 | 3.08e-03 | 1.92e-02 | 19 |
| Page: 1 |
| Pathway ID | Tissue | Disease Stage | Description | Gene Ratio | Bg Ratio | pvalue | p.adjust | qvalue | Count |
| Page: 1 |
Top |
Cell-cell communication analysis |
| Identification of potential cell-cell interactions between two cell types and their ligand-receptor pairs for different disease states |
| Ligand | Receptor | LRpair | Pathway | Tissue | Disease Stage |
| Page: 1 |
Top |
Single-cell gene regulatory network inference analysis |
| Find out the significant the regulons (TFs) and the target genes of each regulon across cell types for different disease states |
| TF | Cell Type | Tissue | Disease Stage | Target Gene | RSS | Regulon Activity |
| ∗The dot plots of a searched regulon are shown for all cell subpopulations in each disease state of each tissue based on the regulon specific score inferred using pySCENIC and by calculating the average expression. |
| Page: 1 |
Top |
Somatic mutation of malignant transformation related genes |
| Annotation of somatic variants for genes involved in malignant transformation |
| Hugo Symbol | Variant Class | Variant Classification | dbSNP RS | HGVSc | HGVSp | HGVSp Short | SWISSPROT | BIOTYPE | SIFT | PolyPhen | Tumor Sample Barcode | Tissue | Histology | Sex | Age | Stage | Therapy Types | Drugs | Outcome |
| ITM2A | SNV | Missense_Mutation | c.43N>A | p.Glu15Lys | p.E15K | O43736 | protein_coding | tolerated(0.58) | benign(0.001) | TCGA-AC-A23H-01 | Breast | breast invasive carcinoma | Female | >=65 | I/II | Unknown | Unknown | PD | |
| ITM2A | SNV | Missense_Mutation | c.682N>G | p.Arg228Gly | p.R228G | O43736 | protein_coding | deleterious(0.02) | benign(0.088) | TCGA-BH-A0B6-01 | Breast | breast invasive carcinoma | Female | <65 | I/II | Unknown | Unknown | SD | |
| ITM2A | SNV | Missense_Mutation | novel | c.532N>C | p.Glu178Gln | p.E178Q | O43736 | protein_coding | deleterious(0.01) | possibly_damaging(0.492) | TCGA-E2-A570-01 | Breast | breast invasive carcinoma | Female | <65 | I/II | Hormone Therapy | anastrozole | SD |
| ITM2A | SNV | Missense_Mutation | c.140A>T | p.Glu47Val | p.E47V | O43736 | protein_coding | deleterious(0.03) | benign(0.027) | TCGA-E9-A1R4-01 | Breast | breast invasive carcinoma | Female | >=65 | I/II | Chemotherapy | 5-fluorouracil | SD | |
| ITM2A | SNV | Missense_Mutation | rs776653962 | c.617G>A | p.Arg206His | p.R206H | O43736 | protein_coding | tolerated(0.11) | benign(0) | TCGA-ZJ-AB0I-01 | Cervix | cervical & endocervical cancer | Female | <65 | I/II | Unknown | Unknown | SD |
| ITM2A | SNV | Missense_Mutation | novel | c.521N>C | p.Lys174Thr | p.K174T | O43736 | protein_coding | deleterious(0.01) | possibly_damaging(0.492) | TCGA-AA-3984-01 | Colorectum | colon adenocarcinoma | Female | <65 | I/II | Unknown | Unknown | SD |
| ITM2A | SNV | Missense_Mutation | c.338A>G | p.Glu113Gly | p.E113G | O43736 | protein_coding | deleterious(0) | probably_damaging(0.997) | TCGA-CM-4746-01 | Colorectum | colon adenocarcinoma | Male | <65 | I/II | Unknown | Unknown | SD | |
| ITM2A | SNV | Missense_Mutation | novel | c.448N>G | p.Thr150Ala | p.T150A | O43736 | protein_coding | deleterious(0) | possibly_damaging(0.61) | TCGA-F5-6814-01 | Colorectum | rectum adenocarcinoma | Male | <65 | I/II | Unknown | Unknown | SD |
| ITM2A | SNV | Missense_Mutation | novel | c.779T>C | p.Ile260Thr | p.I260T | O43736 | protein_coding | deleterious(0) | probably_damaging(0.997) | TCGA-A5-A0G1-01 | Endometrium | uterine corpus endometrioid carcinoma | Female | >=65 | I/II | Unknown | Unknown | SD |
| ITM2A | SNV | Missense_Mutation | novel | c.179T>C | p.Leu60Pro | p.L60P | O43736 | protein_coding | deleterious(0) | probably_damaging(0.972) | TCGA-A5-A0G1-01 | Endometrium | uterine corpus endometrioid carcinoma | Female | >=65 | I/II | Unknown | Unknown | SD |
| Page: 1 2 3 4 5 6 7 |
Top |
Related drugs of malignant transformation related genes |
| Identification of chemicals and drugs interact with genes involved in malignant transfromation |
| (DGIdb 4.0) |
| Entrez ID | Symbol | Category | Interaction Types | Drug Claim Name | Drug Name | PMIDs |
| Page: 1 |

Copyright 2023-Present -The University of Texas Health Science Center at Houston |