
|
|||||
|
 | |
| |
| |
| |
| |
| |
|
Gene: ITIH5 |
Gene summary for ITIH5 |
| Gene information | Species | Human | Gene symbol | ITIH5 | Gene ID | 80760 |
| Gene name | inter-alpha-trypsin inhibitor heavy chain 5 | |
| Gene Alias | ITI-HC5 | |
| Cytomap | 10p14 | |
| Gene Type | protein-coding | GO ID | GO:0006022 | UniProtAcc | G5E9D8 |
Top |
Malignant transformation analysis |
| Identification of the aberrant gene expression in precancerous and cancerous lesions by comparing the gene expression of stem-like cells in diseased tissues with normal stem cells |
| Entrez ID | Symbol | Replicates | Species | Organ | Tissue | Adj P-value | Log2FC | Malignancy |
| 80760 | ITIH5 | P4T-E | Human | Esophagus | ESCC | 2.20e-02 | 1.27e-01 | 0.1323 |
| 80760 | ITIH5 | P9T-E | Human | Esophagus | ESCC | 3.05e-03 | 2.05e-01 | 0.1131 |
| 80760 | ITIH5 | P11T-E | Human | Esophagus | ESCC | 1.13e-06 | 5.28e-01 | 0.1426 |
| 80760 | ITIH5 | P19T-E | Human | Esophagus | ESCC | 3.75e-07 | 8.77e-01 | 0.1662 |
| 80760 | ITIH5 | P21T-E | Human | Esophagus | ESCC | 5.00e-17 | 5.47e-01 | 0.1617 |
| 80760 | ITIH5 | P130T-E | Human | Esophagus | ESCC | 1.45e-13 | 6.12e-01 | 0.1676 |
| 80760 | ITIH5 | S43 | Human | Liver | Cirrhotic | 2.28e-13 | 4.33e-01 | -0.0187 |
| 80760 | ITIH5 | HCC1_Meng | Human | Liver | HCC | 1.77e-02 | -1.75e-01 | 0.0246 |
| 80760 | ITIH5 | cirrhotic1 | Human | Liver | Cirrhotic | 5.45e-07 | 1.13e-01 | 0.0202 |
| 80760 | ITIH5 | cirrhotic2 | Human | Liver | Cirrhotic | 1.54e-05 | 2.49e-01 | 0.0201 |
| 80760 | ITIH5 | HCC1 | Human | Liver | HCC | 4.30e-08 | 3.53e+00 | 0.5336 |
| 80760 | ITIH5 | HCC2 | Human | Liver | HCC | 3.88e-15 | 2.06e+00 | 0.5341 |
| 80760 | ITIH5 | HCC5 | Human | Liver | HCC | 1.51e-08 | 1.61e+00 | 0.4932 |
| 80760 | ITIH5 | Pt13.a | Human | Liver | HCC | 9.14e-03 | -1.73e-01 | 0.021 |
| 80760 | ITIH5 | S014 | Human | Liver | HCC | 1.21e-02 | -1.77e-01 | 0.2254 |
| 80760 | ITIH5 | S015 | Human | Liver | HCC | 2.39e-07 | -1.15e-01 | 0.2375 |
| 80760 | ITIH5 | S016 | Human | Liver | HCC | 5.80e-04 | -1.77e-01 | 0.2243 |
| 80760 | ITIH5 | S027 | Human | Liver | HCC | 1.99e-02 | 1.47e+00 | 0.2446 |
| Page: 1 |
| Tissue | Expression Dynamics | Abbreviation |
| Esophagus | 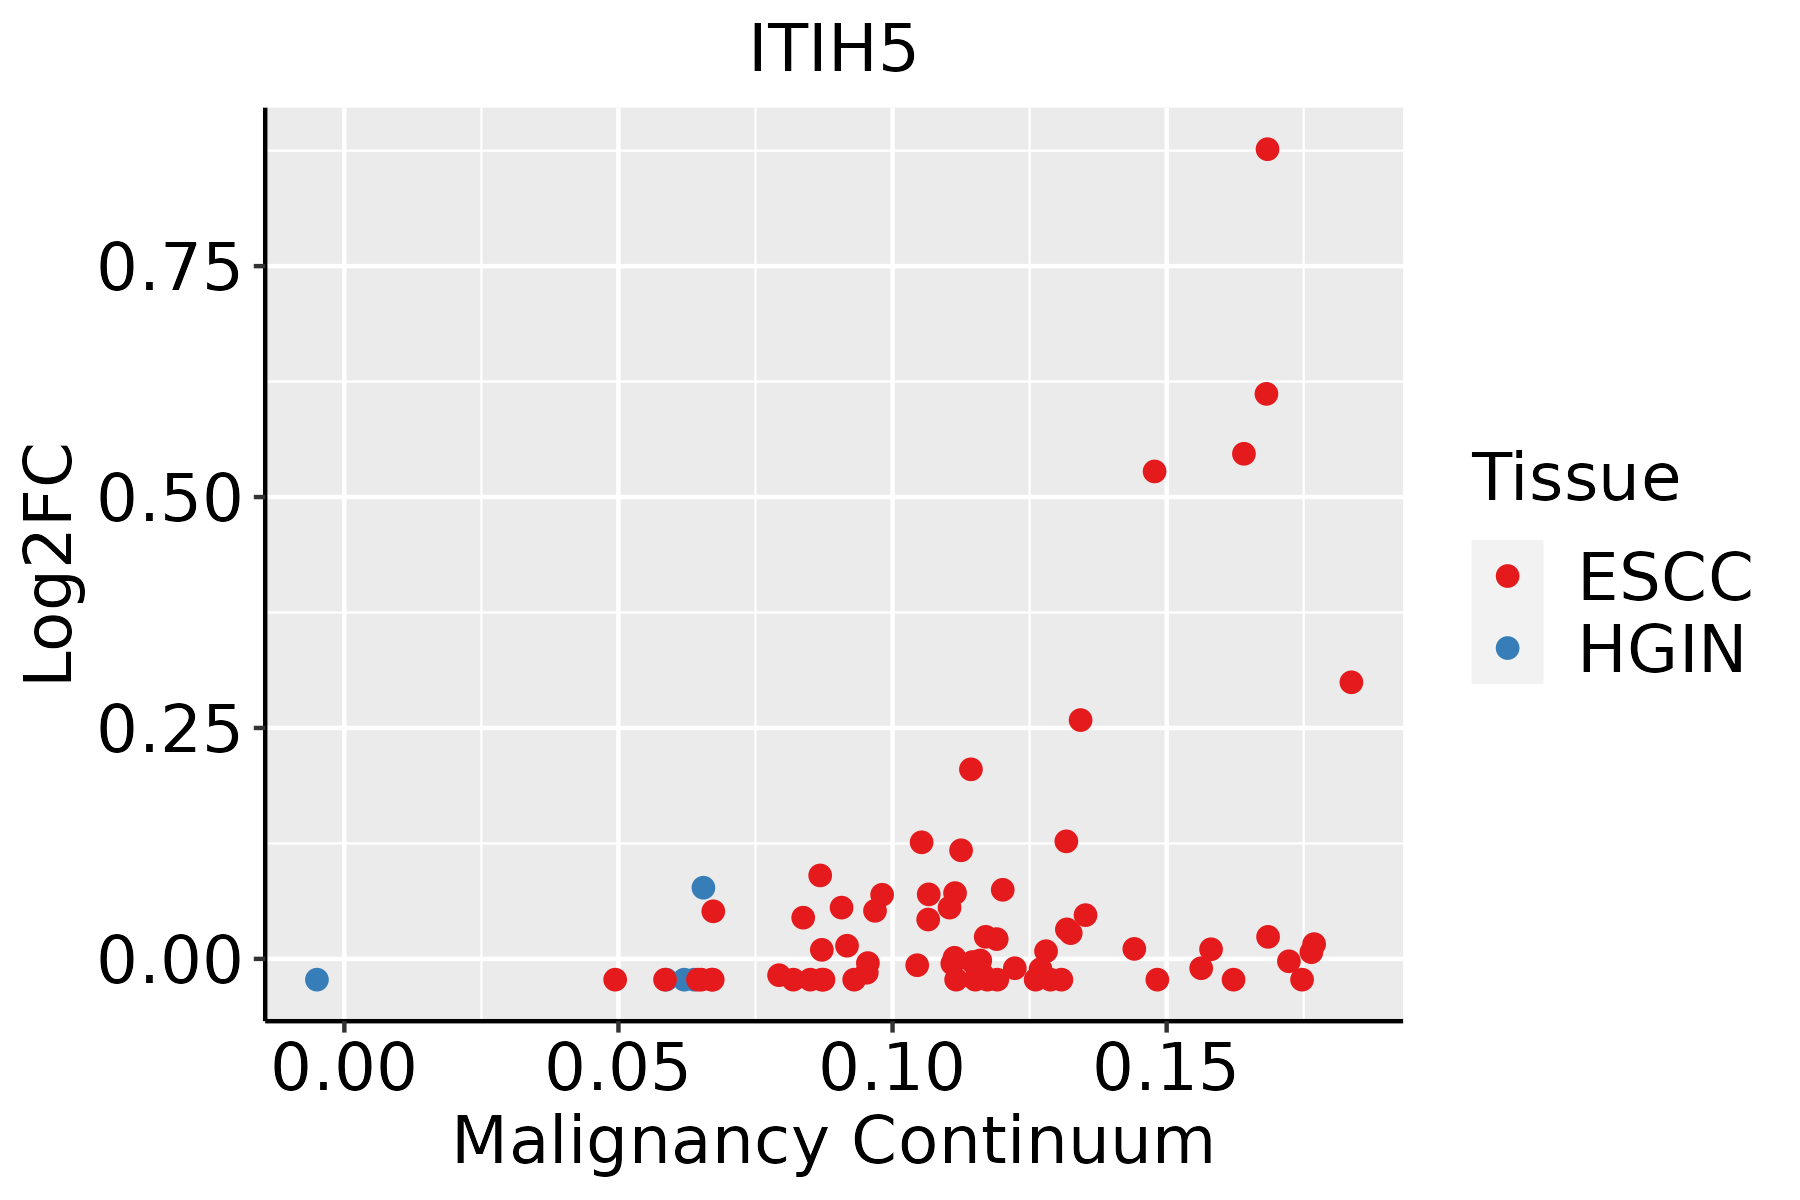 | ESCC: Esophageal squamous cell carcinoma |
| HGIN: High-grade intraepithelial neoplasias | ||
| LGIN: Low-grade intraepithelial neoplasias | ||
| Liver |  | HCC: Hepatocellular carcinoma |
| NAFLD: Non-alcoholic fatty liver disease |
| ∗log2FC in expression of this searched gene in stem-like cells from each diseased tissue sample relative to stem-like cells in normal samples in each tissue plotted against the malignancy continuum. Samples are colored based on if they are from different disease stage. |
Top |
Malignant transformation related pathway analysis |
| Find out the enriched GO biological processes and KEGG pathways involved in transition from healthy to precancer to cancer |
| Tissue | Disease Stage | Enriched GO biological Processes |
| Colorectum | AD |  |
| Colorectum | SER |  |
| Colorectum | MSS |  |
| Colorectum | MSI-H |  |
| Colorectum | FAP |  |
| ∗Top 15 enriched GO BP terms are showed in the bar plot of each disease state in each tissue. Each row represents a significant GO biological process which is colored according to the -log10(p.adjust). |
| Page: 1 2 3 4 5 6 7 8 9 |
| GO ID | Tissue | Disease Stage | Description | Gene Ratio | Bg Ratio | pvalue | p.adjust | Count |
| GO:0052547111 | Esophagus | ESCC | regulation of peptidase activity | 275/8552 | 461/18723 | 7.54e-10 | 1.88e-08 | 275 |
| GO:0052548111 | Esophagus | ESCC | regulation of endopeptidase activity | 253/8552 | 432/18723 | 3.68e-08 | 6.78e-07 | 253 |
| GO:0045861111 | Esophagus | ESCC | negative regulation of proteolysis | 195/8552 | 351/18723 | 1.13e-04 | 7.85e-04 | 195 |
| GO:0051346110 | Esophagus | ESCC | negative regulation of hydrolase activity | 208/8552 | 379/18723 | 1.76e-04 | 1.14e-03 | 208 |
| GO:001046620 | Esophagus | ESCC | negative regulation of peptidase activity | 140/8552 | 262/18723 | 6.73e-03 | 2.46e-02 | 140 |
| GO:001095119 | Esophagus | ESCC | negative regulation of endopeptidase activity | 135/8552 | 252/18723 | 6.86e-03 | 2.51e-02 | 135 |
| GO:005254712 | Liver | Cirrhotic | regulation of peptidase activity | 185/4634 | 461/18723 | 1.32e-13 | 1.09e-11 | 185 |
| GO:005254812 | Liver | Cirrhotic | regulation of endopeptidase activity | 172/4634 | 432/18723 | 2.12e-12 | 1.58e-10 | 172 |
| GO:004586112 | Liver | Cirrhotic | negative regulation of proteolysis | 136/4634 | 351/18723 | 3.46e-09 | 1.42e-07 | 136 |
| GO:005134612 | Liver | Cirrhotic | negative regulation of hydrolase activity | 139/4634 | 379/18723 | 1.24e-07 | 3.42e-06 | 139 |
| GO:001095111 | Liver | Cirrhotic | negative regulation of endopeptidase activity | 98/4634 | 252/18723 | 4.19e-07 | 9.77e-06 | 98 |
| GO:001046612 | Liver | Cirrhotic | negative regulation of peptidase activity | 100/4634 | 262/18723 | 8.90e-07 | 1.84e-05 | 100 |
| GO:005254722 | Liver | HCC | regulation of peptidase activity | 247/7958 | 461/18723 | 8.28e-07 | 1.27e-05 | 247 |
| GO:005254822 | Liver | HCC | regulation of endopeptidase activity | 230/7958 | 432/18723 | 3.58e-06 | 4.68e-05 | 230 |
| GO:004586122 | Liver | HCC | negative regulation of proteolysis | 186/7958 | 351/18723 | 4.19e-05 | 4.11e-04 | 186 |
| GO:005134622 | Liver | HCC | negative regulation of hydrolase activity | 195/7958 | 379/18723 | 2.44e-04 | 1.82e-03 | 195 |
| GO:001095121 | Liver | HCC | negative regulation of endopeptidase activity | 129/7958 | 252/18723 | 3.17e-03 | 1.47e-02 | 129 |
| GO:001046621 | Liver | HCC | negative regulation of peptidase activity | 132/7958 | 262/18723 | 5.82e-03 | 2.42e-02 | 132 |
| Page: 1 |
| Pathway ID | Tissue | Disease Stage | Description | Gene Ratio | Bg Ratio | pvalue | p.adjust | qvalue | Count |
| Page: 1 |
Top |
Cell-cell communication analysis |
| Identification of potential cell-cell interactions between two cell types and their ligand-receptor pairs for different disease states |
| Ligand | Receptor | LRpair | Pathway | Tissue | Disease Stage |
| Page: 1 |
Top |
Single-cell gene regulatory network inference analysis |
| Find out the significant the regulons (TFs) and the target genes of each regulon across cell types for different disease states |
| TF | Cell Type | Tissue | Disease Stage | Target Gene | RSS | Regulon Activity |
| ∗The dot plots of a searched regulon are shown for all cell subpopulations in each disease state of each tissue based on the regulon specific score inferred using pySCENIC and by calculating the average expression. |
| Page: 1 |
Top |
Somatic mutation of malignant transformation related genes |
| Annotation of somatic variants for genes involved in malignant transformation |
| Hugo Symbol | Variant Class | Variant Classification | dbSNP RS | HGVSc | HGVSp | HGVSp Short | SWISSPROT | BIOTYPE | SIFT | PolyPhen | Tumor Sample Barcode | Tissue | Histology | Sex | Age | Stage | Therapy Types | Drugs | Outcome |
| ITIH5 | SNV | Missense_Mutation | novel | c.2104N>A | p.Asp702Asn | p.D702N | protein_coding | deleterious(0.01) | probably_damaging(0.999) | TCGA-A1-A0SH-01 | Breast | breast invasive carcinoma | Female | <65 | I/II | Chemotherapy | tc | SD | |
| ITIH5 | SNV | Missense_Mutation | c.187C>A | p.Arg63Ser | p.R63S | protein_coding | deleterious(0.01) | probably_damaging(0.978) | TCGA-A8-A07B-01 | Breast | breast invasive carcinoma | Female | >=65 | I/II | Unknown | Unknown | SD | ||
| ITIH5 | SNV | Missense_Mutation | novel | c.1607N>T | p.Lys536Met | p.K536M | protein_coding | tolerated(0.08) | probably_damaging(0.914) | TCGA-AN-A03X-01 | Breast | breast invasive carcinoma | Female | >=65 | I/II | Unknown | Unknown | SD | |
| ITIH5 | SNV | Missense_Mutation | rs767409400 | c.1938C>G | p.Ser646Arg | p.S646R | protein_coding | tolerated(0.12) | benign(0.361) | TCGA-AN-A0FJ-01 | Breast | breast invasive carcinoma | Female | <65 | III/IV | Unknown | Unknown | SD | |
| ITIH5 | SNV | Missense_Mutation | novel | c.464N>C | p.Gly155Ala | p.G155A | protein_coding | deleterious(0.01) | probably_damaging(0.999) | TCGA-B6-A0I2-01 | Breast | breast invasive carcinoma | Female | <65 | I/II | Unknown | Unknown | SD | |
| ITIH5 | SNV | Missense_Mutation | rs745793204 | c.736C>T | p.Arg246Cys | p.R246C | protein_coding | deleterious(0) | benign(0.16) | TCGA-C8-A12P-01 | Breast | breast invasive carcinoma | Female | <65 | I/II | Unknown | Unknown | SD | |
| ITIH5 | SNV | Missense_Mutation | novel | c.2012A>G | p.Gln671Arg | p.Q671R | protein_coding | tolerated(0.85) | benign(0.003) | TCGA-D8-A1XK-01 | Breast | breast invasive carcinoma | Female | <65 | I/II | Chemotherapy | doxorubicine+cyclophosphamide | SD | |
| ITIH5 | SNV | Missense_Mutation | novel | c.2041N>T | p.Ile681Phe | p.I681F | protein_coding | deleterious(0.01) | probably_damaging(1) | TCGA-E9-A1R2-01 | Breast | breast invasive carcinoma | Female | <65 | III/IV | Chemotherapy | taxotere | CR | |
| ITIH5 | insertion | Frame_Shift_Ins | novel | c.1555_1556insCCAACGCCAATGTCACCGTCACCATCCAGGGCTCCATAGCCTTTGTC | p.Gly519AlafsTer88 | p.G519Afs*88 | protein_coding | TCGA-A2-A0D1-01 | Breast | breast invasive carcinoma | Female | >=65 | I/II | Chemotherapy | taxotere | SD | |||
| ITIH5 | insertion | In_Frame_Ins | novel | c.1593_1594insGTCACCATCCAGGGCTCCATAGCCTTTGTC | p.Thr531_Ile532insValThrIleGlnGlySerIleAlaPheVal | p.T531_I532insVTIQGSIAFV | protein_coding | TCGA-A8-A07R-01 | Breast | breast invasive carcinoma | Female | >=65 | III/IV | Ancillary | zoledronic | SD |
| Page: 1 2 3 4 5 6 7 8 9 10 11 12 13 14 15 16 17 |
Top |
Related drugs of malignant transformation related genes |
| Identification of chemicals and drugs interact with genes involved in malignant transfromation |
| (DGIdb 4.0) |
| Entrez ID | Symbol | Category | Interaction Types | Drug Claim Name | Drug Name | PMIDs |
| Page: 1 |

Copyright 2023-Present -The University of Texas Health Science Center at Houston |