
|
|||||
|
 | |
| |
| |
| |
| |
| |
|
Gene: ITIH4 |
Gene summary for ITIH4 |
| Gene information | Species | Human | Gene symbol | ITIH4 | Gene ID | 3700 |
| Gene name | inter-alpha-trypsin inhibitor heavy chain 4 | |
| Gene Alias | GP120 | |
| Cytomap | 3p21.1 | |
| Gene Type | protein-coding | GO ID | GO:0002526 | UniProtAcc | B7ZKJ8 |
Top |
Malignant transformation analysis |
| Identification of the aberrant gene expression in precancerous and cancerous lesions by comparing the gene expression of stem-like cells in diseased tissues with normal stem cells |
| Entrez ID | Symbol | Replicates | Species | Organ | Tissue | Adj P-value | Log2FC | Malignancy |
| 3700 | ITIH4 | S41 | Human | Liver | Cirrhotic | 3.35e-15 | 1.04e+00 | -0.0343 |
| 3700 | ITIH4 | S43 | Human | Liver | Cirrhotic | 6.61e-04 | 2.18e-01 | -0.0187 |
| 3700 | ITIH4 | HCC1_Meng | Human | Liver | HCC | 2.41e-26 | 4.31e-02 | 0.0246 |
| 3700 | ITIH4 | HCC1 | Human | Liver | HCC | 6.47e-16 | 3.32e+00 | 0.5336 |
| 3700 | ITIH4 | HCC2 | Human | Liver | HCC | 1.45e-08 | 3.83e+00 | 0.5341 |
| 3700 | ITIH4 | HCC5 | Human | Liver | HCC | 2.61e-15 | 4.60e+00 | 0.4932 |
| 3700 | ITIH4 | S027 | Human | Liver | HCC | 2.50e-09 | 1.15e+00 | 0.2446 |
| 3700 | ITIH4 | S028 | Human | Liver | HCC | 2.08e-18 | 9.54e-01 | 0.2503 |
| 3700 | ITIH4 | S029 | Human | Liver | HCC | 2.33e-25 | 1.33e+00 | 0.2581 |
| Page: 1 |
| Tissue | Expression Dynamics | Abbreviation |
| Liver | 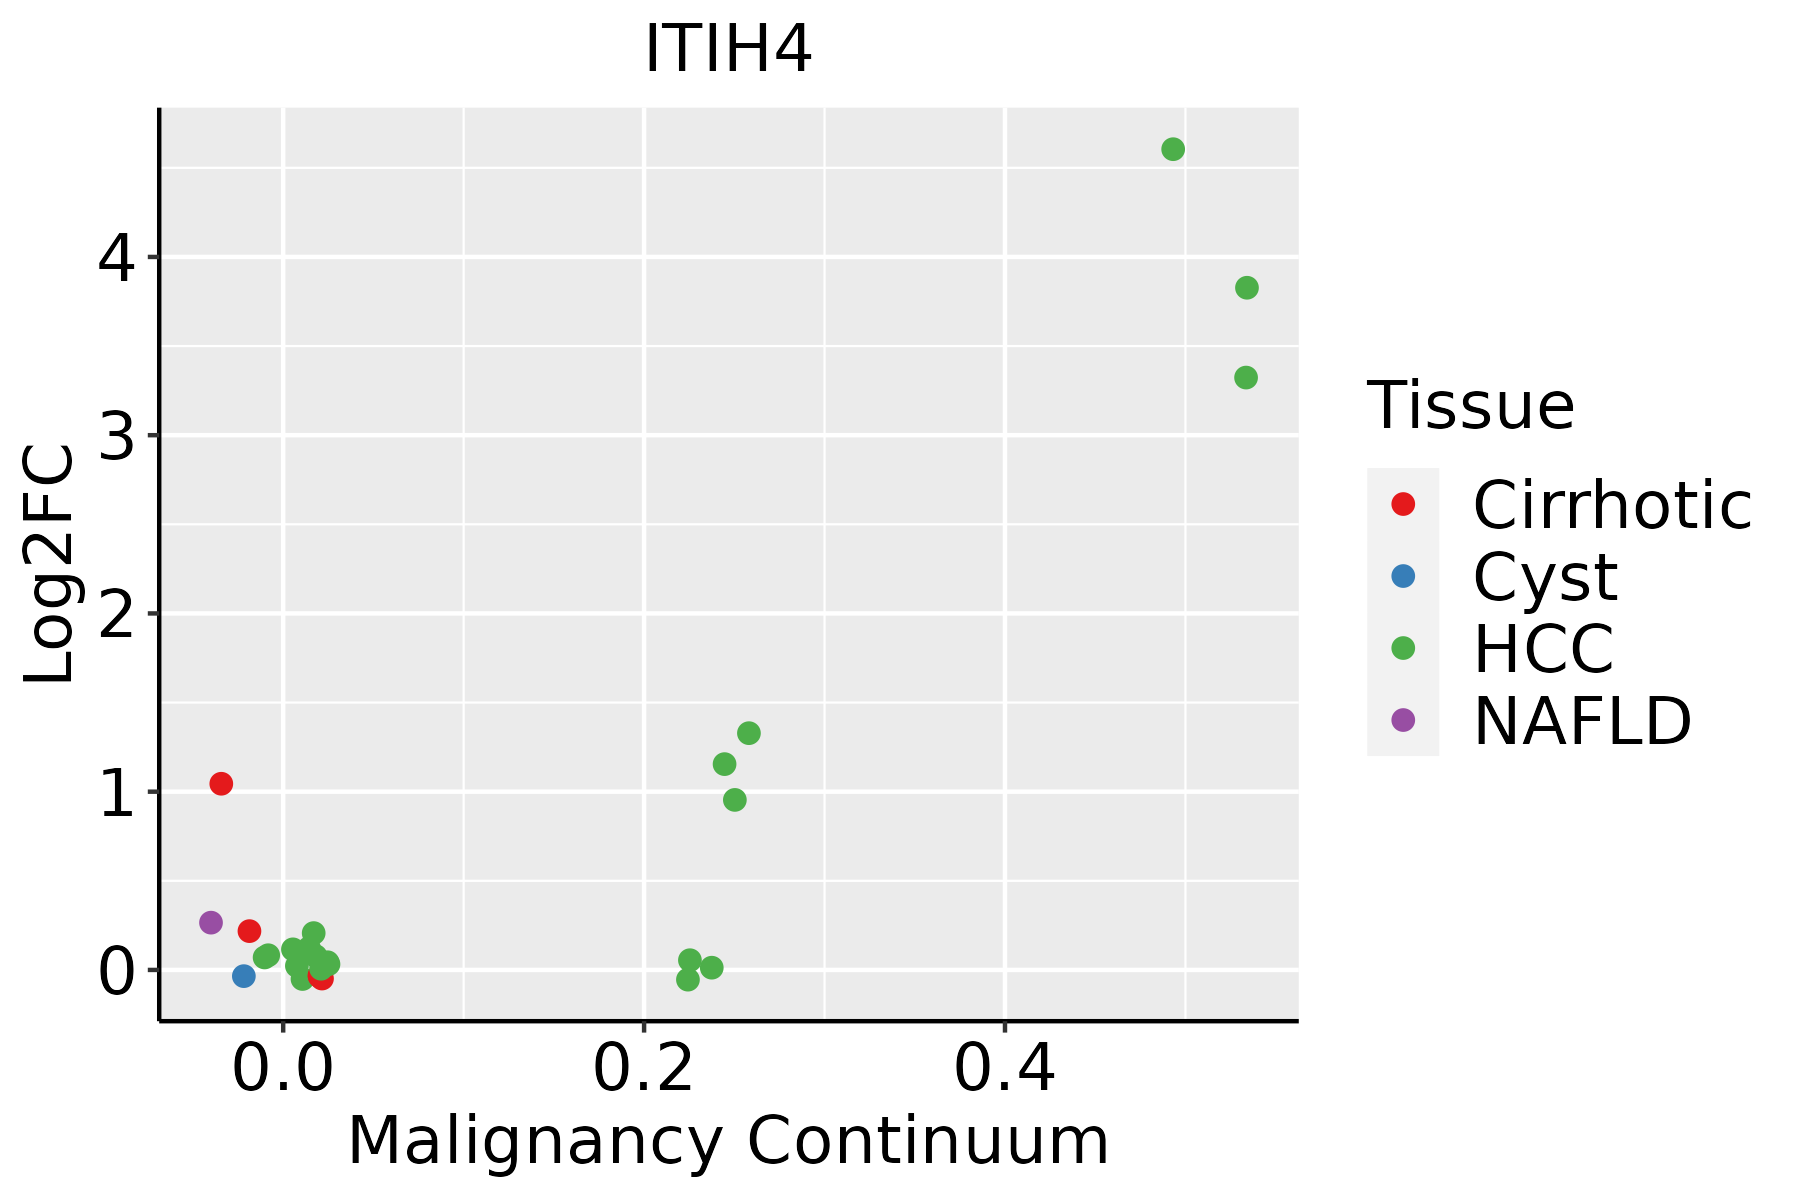 | HCC: Hepatocellular carcinoma |
| NAFLD: Non-alcoholic fatty liver disease |
| ∗log2FC in expression of this searched gene in stem-like cells from each diseased tissue sample relative to stem-like cells in normal samples in each tissue plotted against the malignancy continuum. Samples are colored based on if they are from different disease stage. |
Top |
Malignant transformation related pathway analysis |
| Find out the enriched GO biological processes and KEGG pathways involved in transition from healthy to precancer to cancer |
| Tissue | Disease Stage | Enriched GO biological Processes |
| Colorectum | AD |  |
| Colorectum | SER |  |
| Colorectum | MSS |  |
| Colorectum | MSI-H |  |
| Colorectum | FAP |  |
| ∗Top 15 enriched GO BP terms are showed in the bar plot of each disease state in each tissue. Each row represents a significant GO biological process which is colored according to the -log10(p.adjust). |
| Page: 1 2 3 4 5 6 7 8 9 |
| GO ID | Tissue | Disease Stage | Description | Gene Ratio | Bg Ratio | pvalue | p.adjust | Count |
| GO:005254712 | Liver | Cirrhotic | regulation of peptidase activity | 185/4634 | 461/18723 | 1.32e-13 | 1.09e-11 | 185 |
| GO:005254812 | Liver | Cirrhotic | regulation of endopeptidase activity | 172/4634 | 432/18723 | 2.12e-12 | 1.58e-10 | 172 |
| GO:004586112 | Liver | Cirrhotic | negative regulation of proteolysis | 136/4634 | 351/18723 | 3.46e-09 | 1.42e-07 | 136 |
| GO:005134612 | Liver | Cirrhotic | negative regulation of hydrolase activity | 139/4634 | 379/18723 | 1.24e-07 | 3.42e-06 | 139 |
| GO:001095111 | Liver | Cirrhotic | negative regulation of endopeptidase activity | 98/4634 | 252/18723 | 4.19e-07 | 9.77e-06 | 98 |
| GO:001046612 | Liver | Cirrhotic | negative regulation of peptidase activity | 100/4634 | 262/18723 | 8.90e-07 | 1.84e-05 | 100 |
| GO:00069531 | Liver | Cirrhotic | acute-phase response | 23/4634 | 49/18723 | 6.06e-04 | 4.67e-03 | 23 |
| GO:00025261 | Liver | Cirrhotic | acute inflammatory response | 40/4634 | 112/18723 | 6.16e-03 | 3.06e-02 | 40 |
| GO:005254722 | Liver | HCC | regulation of peptidase activity | 247/7958 | 461/18723 | 8.28e-07 | 1.27e-05 | 247 |
| GO:005254822 | Liver | HCC | regulation of endopeptidase activity | 230/7958 | 432/18723 | 3.58e-06 | 4.68e-05 | 230 |
| GO:004586122 | Liver | HCC | negative regulation of proteolysis | 186/7958 | 351/18723 | 4.19e-05 | 4.11e-04 | 186 |
| GO:005134622 | Liver | HCC | negative regulation of hydrolase activity | 195/7958 | 379/18723 | 2.44e-04 | 1.82e-03 | 195 |
| GO:001095121 | Liver | HCC | negative regulation of endopeptidase activity | 129/7958 | 252/18723 | 3.17e-03 | 1.47e-02 | 129 |
| GO:00025262 | Liver | HCC | acute inflammatory response | 62/7958 | 112/18723 | 4.06e-03 | 1.77e-02 | 62 |
| GO:001046621 | Liver | HCC | negative regulation of peptidase activity | 132/7958 | 262/18723 | 5.82e-03 | 2.42e-02 | 132 |
| GO:00069532 | Liver | HCC | acute-phase response | 30/7958 | 49/18723 | 6.31e-03 | 2.57e-02 | 30 |
| Page: 1 |
| Pathway ID | Tissue | Disease Stage | Description | Gene Ratio | Bg Ratio | pvalue | p.adjust | qvalue | Count |
| Page: 1 |
Top |
Cell-cell communication analysis |
| Identification of potential cell-cell interactions between two cell types and their ligand-receptor pairs for different disease states |
| Ligand | Receptor | LRpair | Pathway | Tissue | Disease Stage |
| Page: 1 |
Top |
Single-cell gene regulatory network inference analysis |
| Find out the significant the regulons (TFs) and the target genes of each regulon across cell types for different disease states |
| TF | Cell Type | Tissue | Disease Stage | Target Gene | RSS | Regulon Activity |
| ∗The dot plots of a searched regulon are shown for all cell subpopulations in each disease state of each tissue based on the regulon specific score inferred using pySCENIC and by calculating the average expression. |
| Page: 1 |
Top |
Somatic mutation of malignant transformation related genes |
| Annotation of somatic variants for genes involved in malignant transformation |
| Hugo Symbol | Variant Class | Variant Classification | dbSNP RS | HGVSc | HGVSp | HGVSp Short | SWISSPROT | BIOTYPE | SIFT | PolyPhen | Tumor Sample Barcode | Tissue | Histology | Sex | Age | Stage | Therapy Types | Drugs | Outcome |
| ITIH4 | SNV | Missense_Mutation | novel | c.2005N>A | p.Gln669Lys | p.Q669K | Q14624 | protein_coding | tolerated(0.94) | benign(0) | TCGA-A7-A6VX-01 | Breast | breast invasive carcinoma | Female | >=65 | I/II | Chemotherapy | docetaxel | CR |
| ITIH4 | SNV | Missense_Mutation | c.444N>T | p.Glu148Asp | p.E148D | Q14624 | protein_coding | deleterious(0) | probably_damaging(0.999) | TCGA-AR-A1AR-01 | Breast | breast invasive carcinoma | Female | <65 | III/IV | Unspecific | Docetaxel | PD | |
| ITIH4 | SNV | Missense_Mutation | novel | c.928T>C | p.Phe310Leu | p.F310L | Q14624 | protein_coding | tolerated(0.2) | possibly_damaging(0.452) | TCGA-LD-A66U-01 | Breast | breast invasive carcinoma | Female | <65 | I/II | Chemotherapy | adriamycin | SD |
| ITIH4 | insertion | Frame_Shift_Ins | novel | c.67_68insGGAGCAGAGAGGAAGATTCCCAACTCTCAGAG | p.His23ArgfsTer73 | p.H23Rfs*73 | Q14624 | protein_coding | TCGA-A8-A08H-01 | Breast | breast invasive carcinoma | Female | >=65 | I/II | Unknown | Unknown | SD | ||
| ITIH4 | deletion | Frame_Shift_Del | novel | c.2792delN | p.Ter931CysfsTer39 | p.*931Cfs*39 | Q14624 | protein_coding | TCGA-EW-A2FV-01 | Breast | breast invasive carcinoma | Female | <65 | III/IV | Chemotherapy | docetaxel | SD | ||
| ITIH4 | SNV | Missense_Mutation | c.2725N>A | p.Glu909Lys | p.E909K | Q14624 | protein_coding | tolerated(0.64) | benign(0.015) | TCGA-C5-A7CL-01 | Cervix | cervical & endocervical cancer | Female | <65 | III/IV | Chemotherapy | cisplatin | PD | |
| ITIH4 | SNV | Missense_Mutation | rs200028476 | c.2728C>T | p.Arg910Cys | p.R910C | Q14624 | protein_coding | tolerated(0.12) | possibly_damaging(0.756) | TCGA-AA-3966-01 | Colorectum | colon adenocarcinoma | Female | >=65 | I/II | Unknown | Unknown | SD |
| ITIH4 | SNV | Missense_Mutation | rs769039012 | c.2063N>A | p.Arg688His | p.R688H | Q14624 | protein_coding | tolerated(0.2) | benign(0.151) | TCGA-AA-A00N-01 | Colorectum | colon adenocarcinoma | Male | >=65 | I/II | Unknown | Unknown | PD |
| ITIH4 | SNV | Missense_Mutation | novel | c.2062N>A | p.Arg688Ser | p.R688S | Q14624 | protein_coding | tolerated(0.54) | benign(0.027) | TCGA-AA-A00N-01 | Colorectum | colon adenocarcinoma | Male | >=65 | I/II | Unknown | Unknown | PD |
| ITIH4 | SNV | Missense_Mutation | c.971N>A | p.Pro324Gln | p.P324Q | Q14624 | protein_coding | tolerated(0.09) | benign(0.281) | TCGA-AM-5821-01 | Colorectum | colon adenocarcinoma | Female | >=65 | I/II | Unknown | Unknown | SD |
| Page: 1 2 3 4 5 6 7 8 |
Top |
Related drugs of malignant transformation related genes |
| Identification of chemicals and drugs interact with genes involved in malignant transfromation |
| (DGIdb 4.0) |
| Entrez ID | Symbol | Category | Interaction Types | Drug Claim Name | Drug Name | PMIDs |
| Page: 1 |

Copyright 2023-Present -The University of Texas Health Science Center at Houston |