
|
|||||
|
 | |
| |
| |
| |
| |
| |
|
Gene: ITIH1 |
Gene summary for ITIH1 |
| Gene information | Species | Human | Gene symbol | ITIH1 | Gene ID | 3697 |
| Gene name | inter-alpha-trypsin inhibitor heavy chain 1 | |
| Gene Alias | H1P | |
| Cytomap | 3p21.1 | |
| Gene Type | protein-coding | GO ID | GO:0006022 | UniProtAcc | P19827 |
Top |
Malignant transformation analysis |
| Identification of the aberrant gene expression in precancerous and cancerous lesions by comparing the gene expression of stem-like cells in diseased tissues with normal stem cells |
| Entrez ID | Symbol | Replicates | Species | Organ | Tissue | Adj P-value | Log2FC | Malignancy |
| 3697 | ITIH1 | NAFLD1 | Human | Liver | NAFLD | 8.78e-05 | 4.89e-01 | -0.04 |
| 3697 | ITIH1 | S43 | Human | Liver | Cirrhotic | 4.07e-05 | -5.03e-02 | -0.0187 |
| 3697 | ITIH1 | HCC1_Meng | Human | Liver | HCC | 4.39e-55 | 2.28e-02 | 0.0246 |
| 3697 | ITIH1 | HCC2_Meng | Human | Liver | HCC | 2.32e-08 | -2.42e-01 | 0.0107 |
| 3697 | ITIH1 | HCC1 | Human | Liver | HCC | 2.01e-19 | 4.63e+00 | 0.5336 |
| 3697 | ITIH1 | HCC2 | Human | Liver | HCC | 4.16e-57 | 6.79e+00 | 0.5341 |
| 3697 | ITIH1 | HCC5 | Human | Liver | HCC | 5.36e-03 | 4.34e+00 | 0.4932 |
| 3697 | ITIH1 | Pt13.b | Human | Liver | HCC | 3.13e-23 | 2.88e-01 | 0.0251 |
| 3697 | ITIH1 | Pt13.c | Human | Liver | HCC | 1.60e-06 | 5.22e-01 | 0.0076 |
| 3697 | ITIH1 | Pt14.a | Human | Liver | HCC | 3.20e-13 | 6.34e-01 | 0.0169 |
| 3697 | ITIH1 | Pt14.b | Human | Liver | HCC | 2.86e-21 | 7.96e-01 | 0.018 |
| 3697 | ITIH1 | Pt14.c | Human | Liver | HCC | 1.40e-06 | 7.48e-01 | 0.0054 |
| 3697 | ITIH1 | Pt14.d | Human | Liver | HCC | 7.88e-06 | 4.45e-01 | 0.0143 |
| 3697 | ITIH1 | S027 | Human | Liver | HCC | 6.85e-24 | 2.82e+00 | 0.2446 |
| 3697 | ITIH1 | S028 | Human | Liver | HCC | 5.78e-61 | 3.01e+00 | 0.2503 |
| 3697 | ITIH1 | S029 | Human | Liver | HCC | 8.04e-62 | 3.35e+00 | 0.2581 |
| Page: 1 |
| Tissue | Expression Dynamics | Abbreviation |
| Liver | 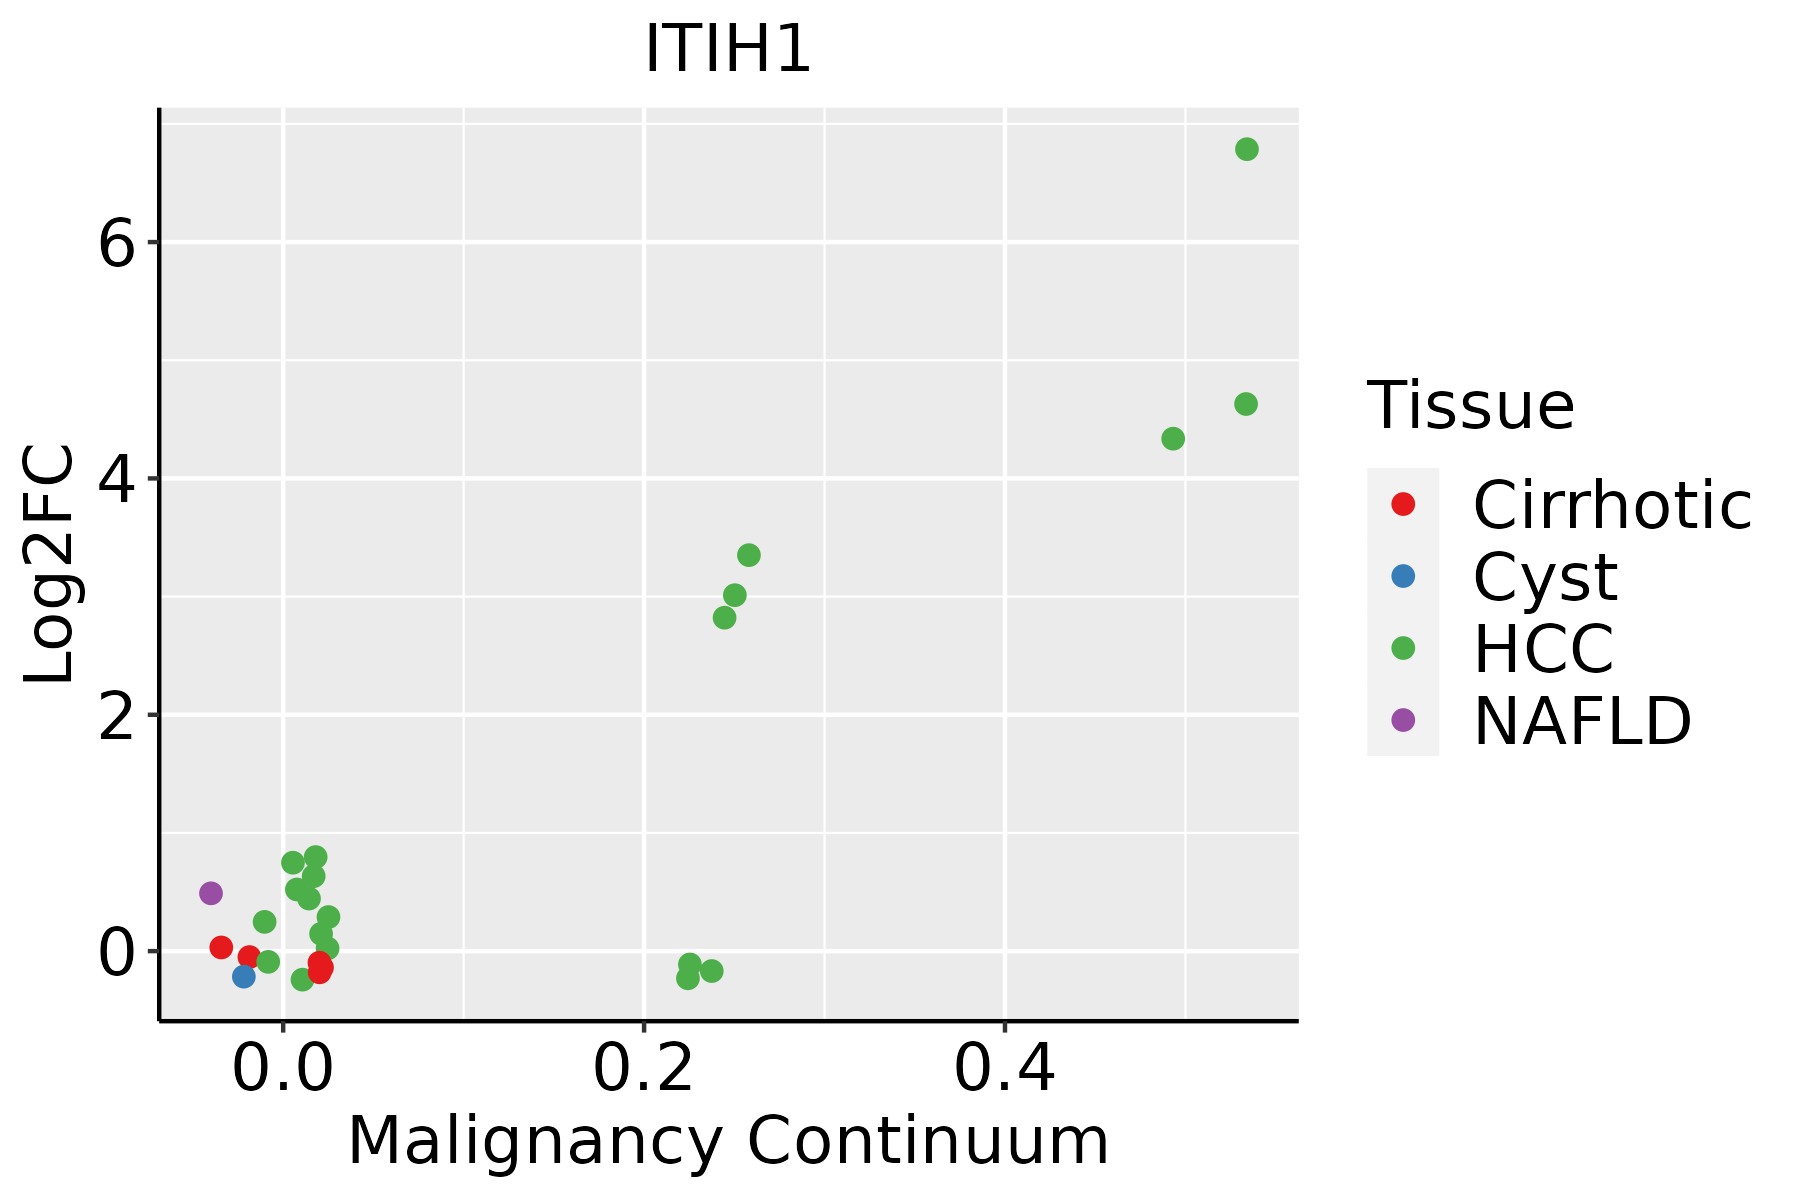 | HCC: Hepatocellular carcinoma |
| NAFLD: Non-alcoholic fatty liver disease |
| ∗log2FC in expression of this searched gene in stem-like cells from each diseased tissue sample relative to stem-like cells in normal samples in each tissue plotted against the malignancy continuum. Samples are colored based on if they are from different disease stage. |
Top |
Malignant transformation related pathway analysis |
| Find out the enriched GO biological processes and KEGG pathways involved in transition from healthy to precancer to cancer |
| Tissue | Disease Stage | Enriched GO biological Processes |
| Colorectum | AD |  |
| Colorectum | SER |  |
| Colorectum | MSS |  |
| Colorectum | MSI-H |  |
| Colorectum | FAP |  |
| ∗Top 15 enriched GO BP terms are showed in the bar plot of each disease state in each tissue. Each row represents a significant GO biological process which is colored according to the -log10(p.adjust). |
| Page: 1 2 3 4 5 6 7 8 9 |
| GO ID | Tissue | Disease Stage | Description | Gene Ratio | Bg Ratio | pvalue | p.adjust | Count |
| GO:00458617 | Liver | NAFLD | negative regulation of proteolysis | 66/1882 | 351/18723 | 4.02e-07 | 2.58e-05 | 66 |
| GO:00513467 | Liver | NAFLD | negative regulation of hydrolase activity | 62/1882 | 379/18723 | 8.11e-05 | 1.66e-03 | 62 |
| GO:00525477 | Liver | NAFLD | regulation of peptidase activity | 72/1882 | 461/18723 | 1.03e-04 | 2.03e-03 | 72 |
| GO:00525487 | Liver | NAFLD | regulation of endopeptidase activity | 67/1882 | 432/18723 | 2.17e-04 | 3.70e-03 | 67 |
| GO:00109517 | Liver | NAFLD | negative regulation of endopeptidase activity | 42/1882 | 252/18723 | 7.29e-04 | 9.29e-03 | 42 |
| GO:00104667 | Liver | NAFLD | negative regulation of peptidase activity | 43/1882 | 262/18723 | 8.76e-04 | 1.07e-02 | 43 |
| GO:005254712 | Liver | Cirrhotic | regulation of peptidase activity | 185/4634 | 461/18723 | 1.32e-13 | 1.09e-11 | 185 |
| GO:005254812 | Liver | Cirrhotic | regulation of endopeptidase activity | 172/4634 | 432/18723 | 2.12e-12 | 1.58e-10 | 172 |
| GO:004586112 | Liver | Cirrhotic | negative regulation of proteolysis | 136/4634 | 351/18723 | 3.46e-09 | 1.42e-07 | 136 |
| GO:005134612 | Liver | Cirrhotic | negative regulation of hydrolase activity | 139/4634 | 379/18723 | 1.24e-07 | 3.42e-06 | 139 |
| GO:001095111 | Liver | Cirrhotic | negative regulation of endopeptidase activity | 98/4634 | 252/18723 | 4.19e-07 | 9.77e-06 | 98 |
| GO:001046612 | Liver | Cirrhotic | negative regulation of peptidase activity | 100/4634 | 262/18723 | 8.90e-07 | 1.84e-05 | 100 |
| GO:005254722 | Liver | HCC | regulation of peptidase activity | 247/7958 | 461/18723 | 8.28e-07 | 1.27e-05 | 247 |
| GO:005254822 | Liver | HCC | regulation of endopeptidase activity | 230/7958 | 432/18723 | 3.58e-06 | 4.68e-05 | 230 |
| GO:004586122 | Liver | HCC | negative regulation of proteolysis | 186/7958 | 351/18723 | 4.19e-05 | 4.11e-04 | 186 |
| GO:005134622 | Liver | HCC | negative regulation of hydrolase activity | 195/7958 | 379/18723 | 2.44e-04 | 1.82e-03 | 195 |
| GO:001095121 | Liver | HCC | negative regulation of endopeptidase activity | 129/7958 | 252/18723 | 3.17e-03 | 1.47e-02 | 129 |
| GO:001046621 | Liver | HCC | negative regulation of peptidase activity | 132/7958 | 262/18723 | 5.82e-03 | 2.42e-02 | 132 |
| Page: 1 |
| Pathway ID | Tissue | Disease Stage | Description | Gene Ratio | Bg Ratio | pvalue | p.adjust | qvalue | Count |
| Page: 1 |
Top |
Cell-cell communication analysis |
| Identification of potential cell-cell interactions between two cell types and their ligand-receptor pairs for different disease states |
| Ligand | Receptor | LRpair | Pathway | Tissue | Disease Stage |
| Page: 1 |
Top |
Single-cell gene regulatory network inference analysis |
| Find out the significant the regulons (TFs) and the target genes of each regulon across cell types for different disease states |
| TF | Cell Type | Tissue | Disease Stage | Target Gene | RSS | Regulon Activity |
| ∗The dot plots of a searched regulon are shown for all cell subpopulations in each disease state of each tissue based on the regulon specific score inferred using pySCENIC and by calculating the average expression. |
| Page: 1 |
Top |
Somatic mutation of malignant transformation related genes |
| Annotation of somatic variants for genes involved in malignant transformation |
| Hugo Symbol | Variant Class | Variant Classification | dbSNP RS | HGVSc | HGVSp | HGVSp Short | SWISSPROT | BIOTYPE | SIFT | PolyPhen | Tumor Sample Barcode | Tissue | Histology | Sex | Age | Stage | Therapy Types | Drugs | Outcome |
| ITIH1 | SNV | Missense_Mutation | c.1705N>G | p.Leu569Val | p.L569V | P19827 | protein_coding | deleterious(0) | probably_damaging(0.992) | TCGA-A2-A0T0-01 | Breast | breast invasive carcinoma | Female | <65 | I/II | Chemotherapy | taxotere | SD | |
| ITIH1 | SNV | Missense_Mutation | novel | c.1879C>T | p.Pro627Ser | p.P627S | P19827 | protein_coding | tolerated(0.1) | benign(0.057) | TCGA-A7-A4SE-01 | Breast | breast invasive carcinoma | Female | <65 | I/II | Chemotherapy | adriamycin | CR |
| ITIH1 | SNV | Missense_Mutation | rs148028644 | c.199N>A | p.Ala67Thr | p.A67T | P19827 | protein_coding | deleterious(0) | probably_damaging(0.992) | TCGA-A8-A09Q-01 | Breast | breast invasive carcinoma | Female | >=65 | III/IV | Hormone Therapy | anastrozole | SD |
| ITIH1 | SNV | Missense_Mutation | rs777237459 | c.2016N>A | p.Asp672Glu | p.D672E | P19827 | protein_coding | deleterious(0.03) | probably_damaging(0.999) | TCGA-AR-A256-01 | Breast | breast invasive carcinoma | Female | <65 | I/II | Chemotherapy | doxorubicin | PD |
| ITIH1 | SNV | Missense_Mutation | c.663N>G | p.Ile221Met | p.I221M | P19827 | protein_coding | deleterious(0) | possibly_damaging(0.714) | TCGA-C8-A1HJ-01 | Breast | breast invasive carcinoma | Female | <65 | I/II | Unknown | Unknown | SD | |
| ITIH1 | SNV | Missense_Mutation | c.1916N>A | p.Pro639His | p.P639H | P19827 | protein_coding | tolerated(0.17) | benign(0.003) | TCGA-D8-A1X9-01 | Breast | breast invasive carcinoma | Female | >=65 | I/II | Chemotherapy | adriamycin+cyclophosphamide | SD | |
| ITIH1 | SNV | Missense_Mutation | rs763101480 | c.1541G>A | p.Arg514His | p.R514H | P19827 | protein_coding | tolerated(0.06) | benign(0.189) | TCGA-2W-A8YY-01 | Cervix | cervical & endocervical cancer | Female | <65 | I/II | Chemotherapy | cisplatin | CR |
| ITIH1 | SNV | Missense_Mutation | novel | c.2156C>T | p.Ala719Val | p.A719V | P19827 | protein_coding | tolerated(0.28) | benign(0.1) | TCGA-2W-A8YY-01 | Cervix | cervical & endocervical cancer | Female | <65 | I/II | Chemotherapy | cisplatin | CR |
| ITIH1 | SNV | Missense_Mutation | c.1238N>A | p.Arg413His | p.R413H | P19827 | protein_coding | tolerated(0.55) | probably_damaging(0.915) | TCGA-A6-2686-01 | Colorectum | colon adenocarcinoma | Female | >=65 | I/II | Unknown | Unknown | SD | |
| ITIH1 | SNV | Missense_Mutation | rs142551669 | c.2191N>A | p.Gly731Arg | p.G731R | P19827 | protein_coding | deleterious(0.02) | probably_damaging(1) | TCGA-A6-6142-01 | Colorectum | colon adenocarcinoma | Female | <65 | I/II | Chemotherapy | fluorouracil | PD |
| Page: 1 2 3 4 5 6 7 8 9 10 11 |
Top |
Related drugs of malignant transformation related genes |
| Identification of chemicals and drugs interact with genes involved in malignant transfromation |
| (DGIdb 4.0) |
| Entrez ID | Symbol | Category | Interaction Types | Drug Claim Name | Drug Name | PMIDs |
| Page: 1 |

Copyright 2023-Present -The University of Texas Health Science Center at Houston |