
|
|||||
|
 | |
| |
| |
| |
| |
| |
|
Gene: ITGBL1 |
Gene summary for ITGBL1 |
| Gene information | Species | Human | Gene symbol | ITGBL1 | Gene ID | 9358 |
| Gene name | integrin subunit beta like 1 | |
| Gene Alias | OSCP | |
| Cytomap | 13q33.1 | |
| Gene Type | protein-coding | GO ID | GO:0006928 | UniProtAcc | B4DN32 |
Top |
Malignant transformation analysis |
| Identification of the aberrant gene expression in precancerous and cancerous lesions by comparing the gene expression of stem-like cells in diseased tissues with normal stem cells |
| Entrez ID | Symbol | Replicates | Species | Organ | Tissue | Adj P-value | Log2FC | Malignancy |
| 9358 | ITGBL1 | ATC11 | Human | Thyroid | ATC | 8.25e-07 | 6.50e-01 | 0.3386 |
| 9358 | ITGBL1 | ATC12 | Human | Thyroid | ATC | 4.18e-08 | 2.93e-01 | 0.34 |
| 9358 | ITGBL1 | ATC2 | Human | Thyroid | ATC | 1.02e-12 | 1.01e+00 | 0.34 |
| 9358 | ITGBL1 | ATC3 | Human | Thyroid | ATC | 4.28e-09 | 5.96e-01 | 0.338 |
| 9358 | ITGBL1 | ATC4 | Human | Thyroid | ATC | 4.08e-11 | 2.97e-01 | 0.34 |
| Page: 1 |
| Tissue | Expression Dynamics | Abbreviation |
| Thyroid | 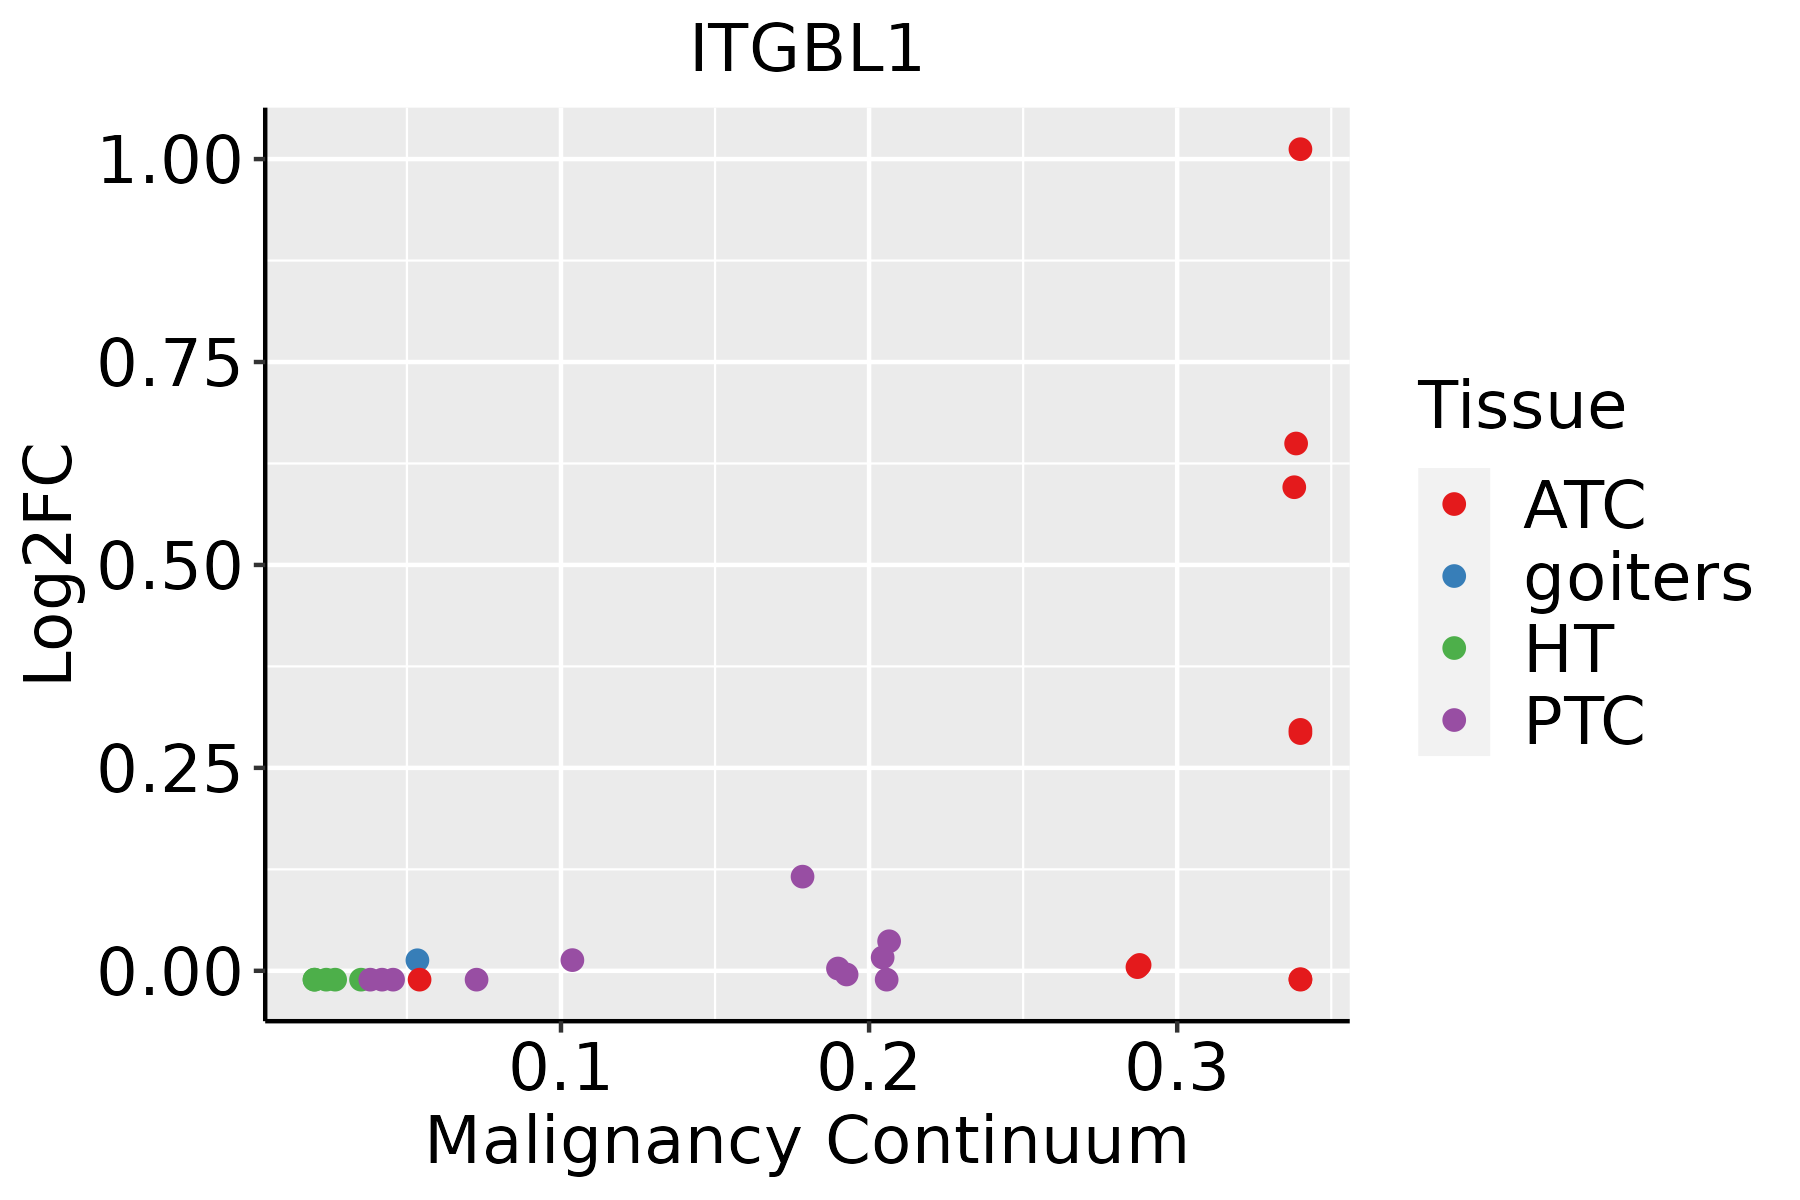 | ATC: Anaplastic thyroid cancer |
| HT: Hashimoto's thyroiditis | ||
| PTC: Papillary thyroid cancer |
| ∗log2FC in expression of this searched gene in stem-like cells from each diseased tissue sample relative to stem-like cells in normal samples in each tissue plotted against the malignancy continuum. Samples are colored based on if they are from different disease stage. |
Top |
Malignant transformation related pathway analysis |
| Find out the enriched GO biological processes and KEGG pathways involved in transition from healthy to precancer to cancer |
| Tissue | Disease Stage | Enriched GO biological Processes |
| Colorectum | AD |  |
| Colorectum | SER |  |
| Colorectum | MSS |  |
| Colorectum | MSI-H |  |
| Colorectum | FAP |  |
| ∗Top 15 enriched GO BP terms are showed in the bar plot of each disease state in each tissue. Each row represents a significant GO biological process which is colored according to the -log10(p.adjust). |
| Page: 1 2 3 4 5 6 7 8 9 |
| GO ID | Tissue | Disease Stage | Description | Gene Ratio | Bg Ratio | pvalue | p.adjust | Count |
| GO:003158928 | Thyroid | ATC | cell-substrate adhesion | 195/6293 | 363/18723 | 1.58e-15 | 1.17e-13 | 195 |
| GO:0007160111 | Thyroid | ATC | cell-matrix adhesion | 128/6293 | 233/18723 | 1.49e-11 | 5.41e-10 | 128 |
| GO:000722919 | Thyroid | ATC | integrin-mediated signaling pathway | 63/6293 | 107/18723 | 7.09e-08 | 1.24e-06 | 63 |
| GO:00336277 | Thyroid | ATC | cell adhesion mediated by integrin | 39/6293 | 72/18723 | 2.59e-04 | 1.66e-03 | 39 |
| Page: 1 |
| Pathway ID | Tissue | Disease Stage | Description | Gene Ratio | Bg Ratio | pvalue | p.adjust | qvalue | Count |
| Page: 1 |
Top |
Cell-cell communication analysis |
| Identification of potential cell-cell interactions between two cell types and their ligand-receptor pairs for different disease states |
| Ligand | Receptor | LRpair | Pathway | Tissue | Disease Stage |
| Page: 1 |
Top |
Single-cell gene regulatory network inference analysis |
| Find out the significant the regulons (TFs) and the target genes of each regulon across cell types for different disease states |
| TF | Cell Type | Tissue | Disease Stage | Target Gene | RSS | Regulon Activity |
| ∗The dot plots of a searched regulon are shown for all cell subpopulations in each disease state of each tissue based on the regulon specific score inferred using pySCENIC and by calculating the average expression. |
| Page: 1 |
Top |
Somatic mutation of malignant transformation related genes |
| Annotation of somatic variants for genes involved in malignant transformation |
| Hugo Symbol | Variant Class | Variant Classification | dbSNP RS | HGVSc | HGVSp | HGVSp Short | SWISSPROT | BIOTYPE | SIFT | PolyPhen | Tumor Sample Barcode | Tissue | Histology | Sex | Age | Stage | Therapy Types | Drugs | Outcome |
| ITGBL1 | SNV | Missense_Mutation | rs371167812 | c.889G>A | p.Gly297Arg | p.G297R | O95965 | protein_coding | deleterious(0) | probably_damaging(1) | TCGA-A7-A6VY-01 | Breast | breast invasive carcinoma | Female | <65 | I/II | Chemotherapy | cyclophosphamide | CR |
| ITGBL1 | SNV | Missense_Mutation | c.1054N>A | p.Gly352Arg | p.G352R | O95965 | protein_coding | deleterious(0) | probably_damaging(0.931) | TCGA-EW-A1J6-01 | Breast | breast invasive carcinoma | Female | >=65 | I/II | Hormone Therapy | femara | SD | |
| ITGBL1 | SNV | Missense_Mutation | c.1051N>T | p.Pro351Ser | p.P351S | O95965 | protein_coding | deleterious(0.02) | benign(0.14) | TCGA-C5-A1BI-01 | Cervix | cervical & endocervical cancer | Female | <65 | III/IV | Chemotherapy | cisplatin | SD | |
| ITGBL1 | SNV | Missense_Mutation | novel | c.1103G>T | p.Cys368Phe | p.C368F | O95965 | protein_coding | deleterious_low_confidence(0) | probably_damaging(0.999) | TCGA-C5-A8YR-01 | Cervix | cervical & endocervical cancer | Female | <65 | I/II | Unknown | Unknown | PD |
| ITGBL1 | SNV | Missense_Mutation | rs753390115 | c.1220N>T | p.Thr407Met | p.T407M | O95965 | protein_coding | deleterious(0.02) | probably_damaging(0.931) | TCGA-DS-A1OB-01 | Cervix | cervical & endocervical cancer | Female | <65 | I/II | Chemotherapy | carboplatin | PD |
| ITGBL1 | SNV | Missense_Mutation | c.562N>A | p.Asp188Asn | p.D188N | O95965 | protein_coding | deleterious(0.02) | possibly_damaging(0.511) | TCGA-A6-5661-01 | Colorectum | colon adenocarcinoma | Female | >=65 | I/II | Unknown | Unknown | SD | |
| ITGBL1 | SNV | Missense_Mutation | c.311N>A | p.Cys104Tyr | p.C104Y | O95965 | protein_coding | deleterious(0) | probably_damaging(0.997) | TCGA-AA-3956-01 | Colorectum | colon adenocarcinoma | Male | >=65 | I/II | Unknown | Unknown | SD | |
| ITGBL1 | SNV | Missense_Mutation | rs749949431 | c.1114G>A | p.Asp372Asn | p.D372N | O95965 | protein_coding | tolerated(0.38) | benign(0.013) | TCGA-AD-6895-01 | Colorectum | colon adenocarcinoma | Male | >=65 | III/IV | Unknown | Unknown | SD |
| ITGBL1 | SNV | Missense_Mutation | c.320N>G | p.His107Arg | p.H107R | O95965 | protein_coding | tolerated(0.2) | benign(0.015) | TCGA-AG-3725-01 | Colorectum | rectum adenocarcinoma | Female | >=65 | III/IV | Unknown | Unknown | SD | |
| ITGBL1 | SNV | Missense_Mutation | novel | c.651A>C | p.Glu217Asp | p.E217D | O95965 | protein_coding | deleterious(0) | probably_damaging(0.951) | TCGA-AG-A002-01 | Colorectum | rectum adenocarcinoma | Male | <65 | I/II | Unknown | Unknown | SD |
| Page: 1 2 3 4 5 6 7 |
Top |
Related drugs of malignant transformation related genes |
| Identification of chemicals and drugs interact with genes involved in malignant transfromation |
| (DGIdb 4.0) |
| Entrez ID | Symbol | Category | Interaction Types | Drug Claim Name | Drug Name | PMIDs |
| Page: 1 |

Copyright 2023-Present -The University of Texas Health Science Center at Houston |