
|
|||||
|
 | |
| |
| |
| |
| |
| |
|
Gene: ITGB8 |
Gene summary for ITGB8 |
| Gene information | Species | Human | Gene symbol | ITGB8 | Gene ID | 3696 |
| Gene name | integrin subunit beta 8 | |
| Gene Alias | ITGB8 | |
| Cytomap | 7p21.1 | |
| Gene Type | protein-coding | GO ID | GO:0000003 | UniProtAcc | P26012 |
Top |
Malignant transformation analysis |
| Identification of the aberrant gene expression in precancerous and cancerous lesions by comparing the gene expression of stem-like cells in diseased tissues with normal stem cells |
| Entrez ID | Symbol | Replicates | Species | Organ | Tissue | Adj P-value | Log2FC | Malignancy |
| 3696 | ITGB8 | CA_HPV_1 | Human | Cervix | CC | 3.50e-18 | -5.01e-01 | 0.0264 |
| 3696 | ITGB8 | CA_HPV_2 | Human | Cervix | CC | 2.31e-02 | -2.83e-01 | 0.0391 |
| 3696 | ITGB8 | CA_HPV_3 | Human | Cervix | CC | 2.79e-10 | -1.49e-01 | 0.0414 |
| 3696 | ITGB8 | HSIL_HPV_1 | Human | Cervix | HSIL_HPV | 1.98e-03 | -3.82e-01 | 0.0116 |
| 3696 | ITGB8 | N_HPV_1 | Human | Cervix | N_HPV | 1.86e-11 | -4.36e-01 | 0.0079 |
| 3696 | ITGB8 | CCI_2 | Human | Cervix | CC | 1.43e-03 | 7.54e-01 | 0.5249 |
| 3696 | ITGB8 | sample3 | Human | Cervix | CC | 1.23e-10 | 4.46e-02 | 0.1387 |
| 3696 | ITGB8 | H2 | Human | Cervix | HSIL_HPV | 4.91e-04 | 2.72e-01 | 0.0632 |
| 3696 | ITGB8 | T3 | Human | Cervix | CC | 7.91e-08 | -3.27e-02 | 0.1389 |
| 3696 | ITGB8 | AEH-subject1 | Human | Endometrium | AEH | 9.85e-23 | 8.06e-01 | -0.3059 |
| 3696 | ITGB8 | AEH-subject2 | Human | Endometrium | AEH | 2.25e-26 | 8.08e-01 | -0.2525 |
| 3696 | ITGB8 | AEH-subject3 | Human | Endometrium | AEH | 3.30e-08 | 4.61e-01 | -0.2576 |
| 3696 | ITGB8 | AEH-subject4 | Human | Endometrium | AEH | 2.51e-29 | 9.08e-01 | -0.2657 |
| 3696 | ITGB8 | AEH-subject5 | Human | Endometrium | AEH | 2.66e-96 | 1.49e+00 | -0.2953 |
| 3696 | ITGB8 | EEC-subject1 | Human | Endometrium | EEC | 4.43e-21 | 7.83e-01 | -0.2682 |
| 3696 | ITGB8 | EEC-subject2 | Human | Endometrium | EEC | 7.78e-18 | 7.62e-01 | -0.2607 |
| 3696 | ITGB8 | EEC-subject3 | Human | Endometrium | EEC | 3.61e-30 | 6.79e-01 | -0.2525 |
| 3696 | ITGB8 | EEC-subject4 | Human | Endometrium | EEC | 2.95e-25 | 8.09e-01 | -0.2571 |
| 3696 | ITGB8 | EEC-subject5 | Human | Endometrium | EEC | 1.06e-10 | 5.75e-01 | -0.249 |
| 3696 | ITGB8 | GSM5276934 | Human | Endometrium | EEC | 1.57e-02 | 3.72e-01 | -0.0913 |
| Page: 1 2 3 4 5 6 7 8 |
| Tissue | Expression Dynamics | Abbreviation |
| Cervix | 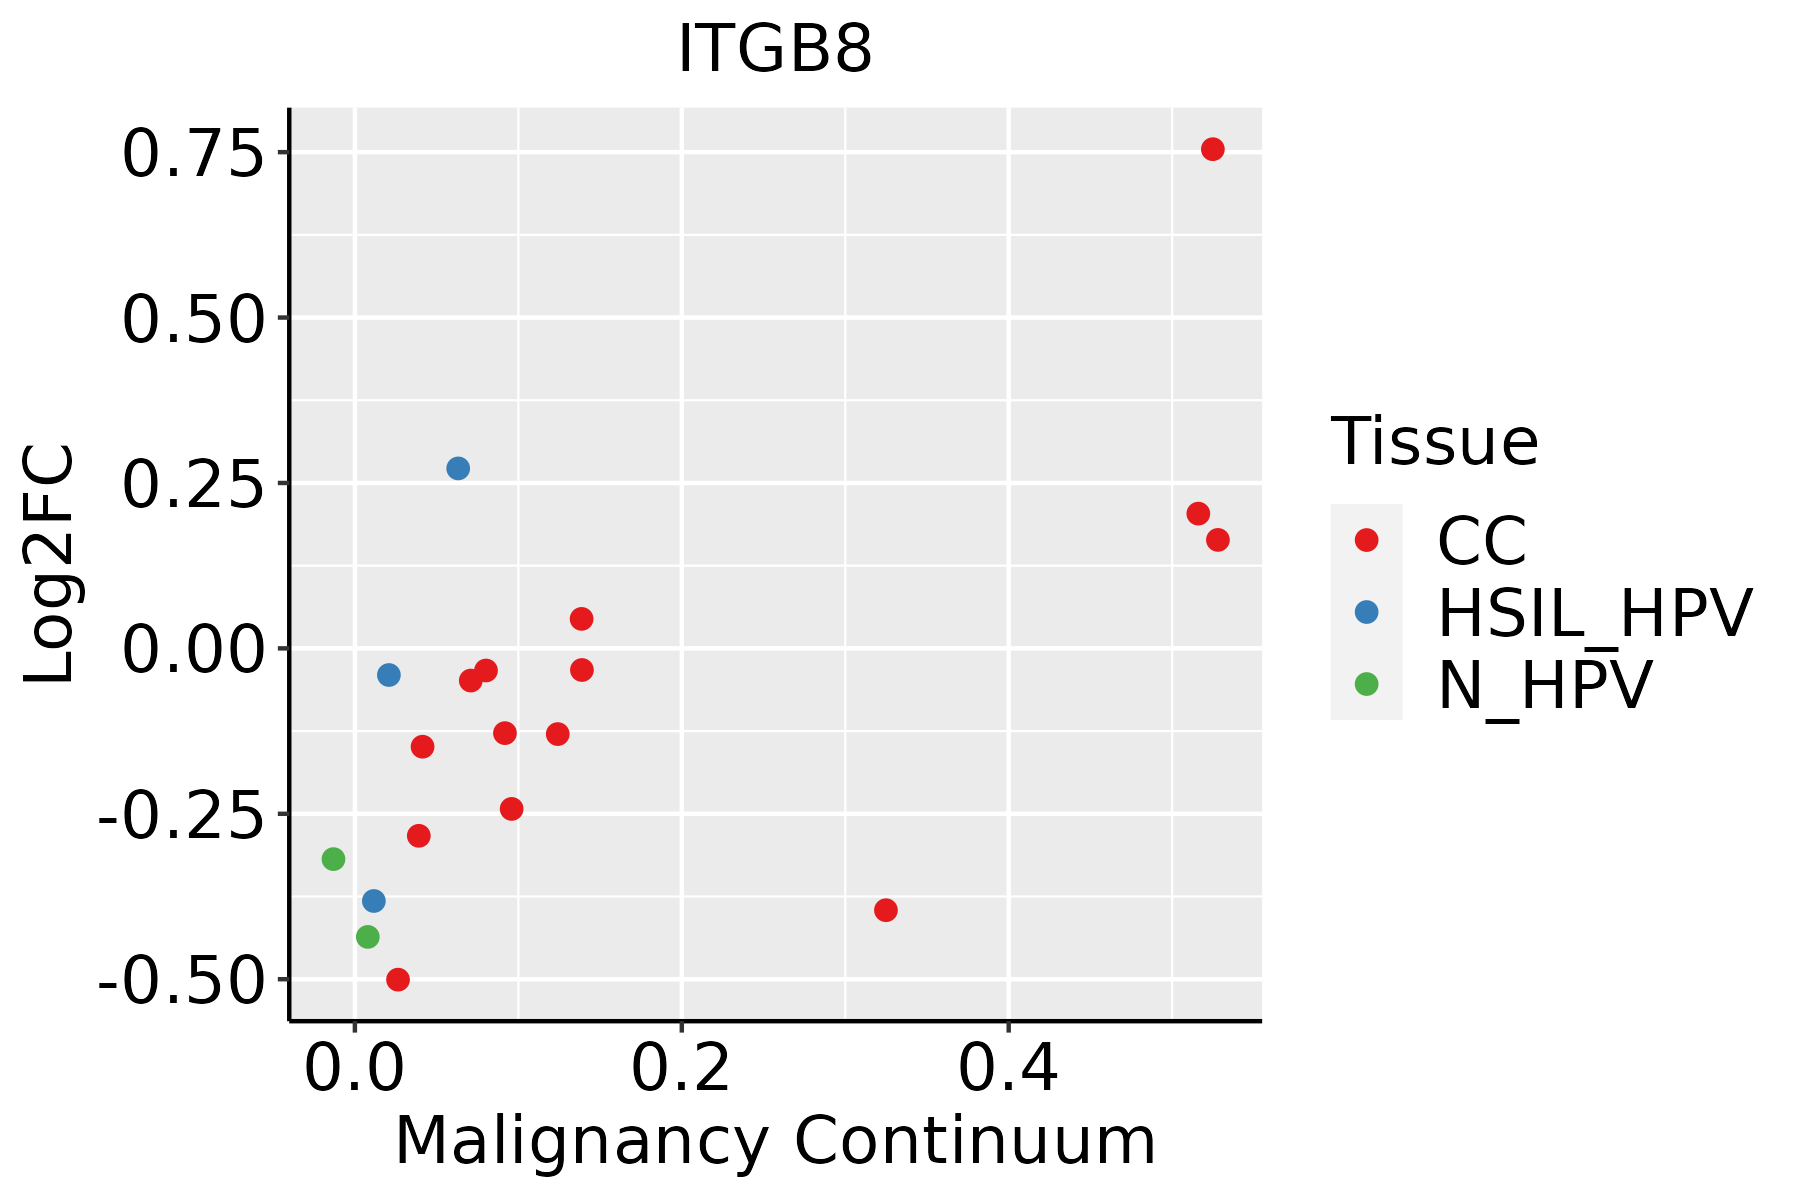 | CC: Cervix cancer |
| HSIL_HPV: HPV-infected high-grade squamous intraepithelial lesions | ||
| N_HPV: HPV-infected normal cervix | ||
| Endometrium |  | AEH: Atypical endometrial hyperplasia |
| EEC: Endometrioid Cancer | ||
| Esophagus | 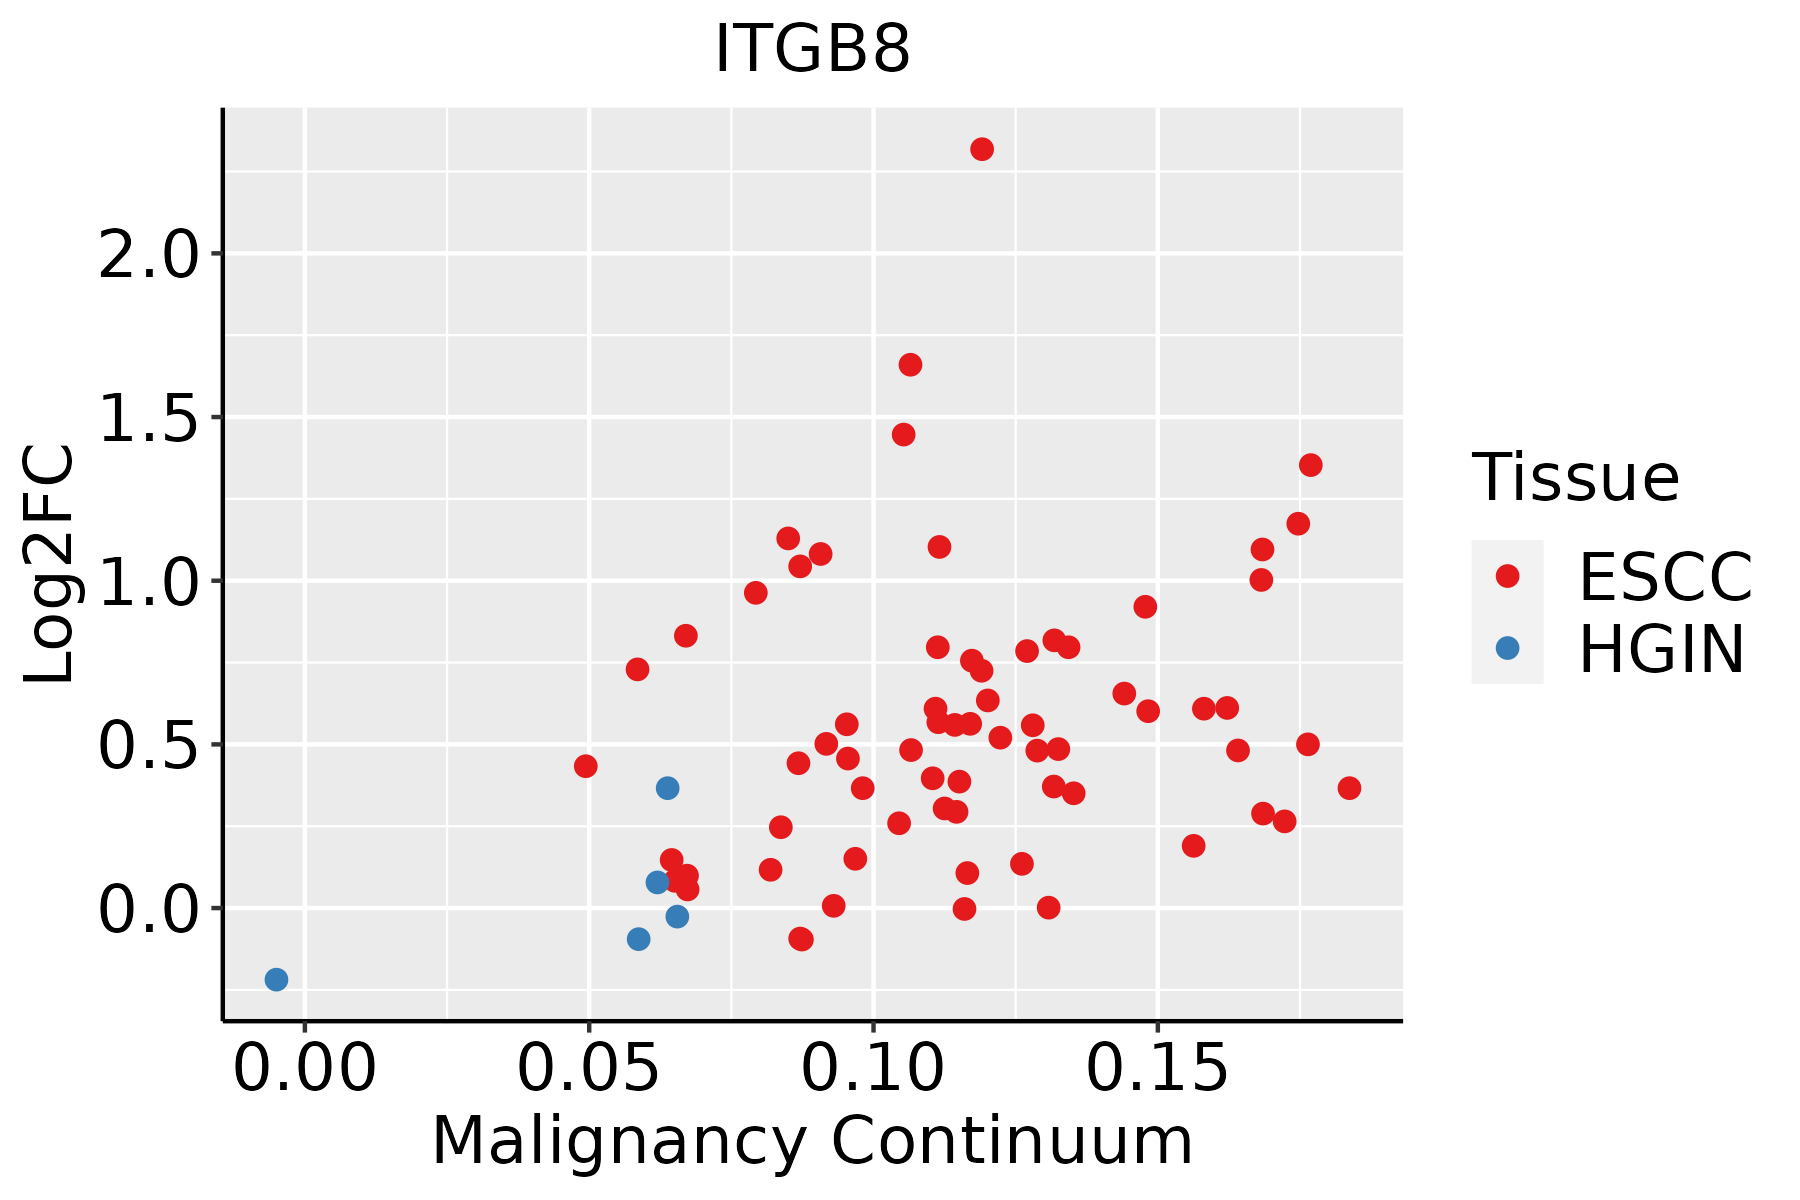 | ESCC: Esophageal squamous cell carcinoma |
| HGIN: High-grade intraepithelial neoplasias | ||
| LGIN: Low-grade intraepithelial neoplasias | ||
| Lung | 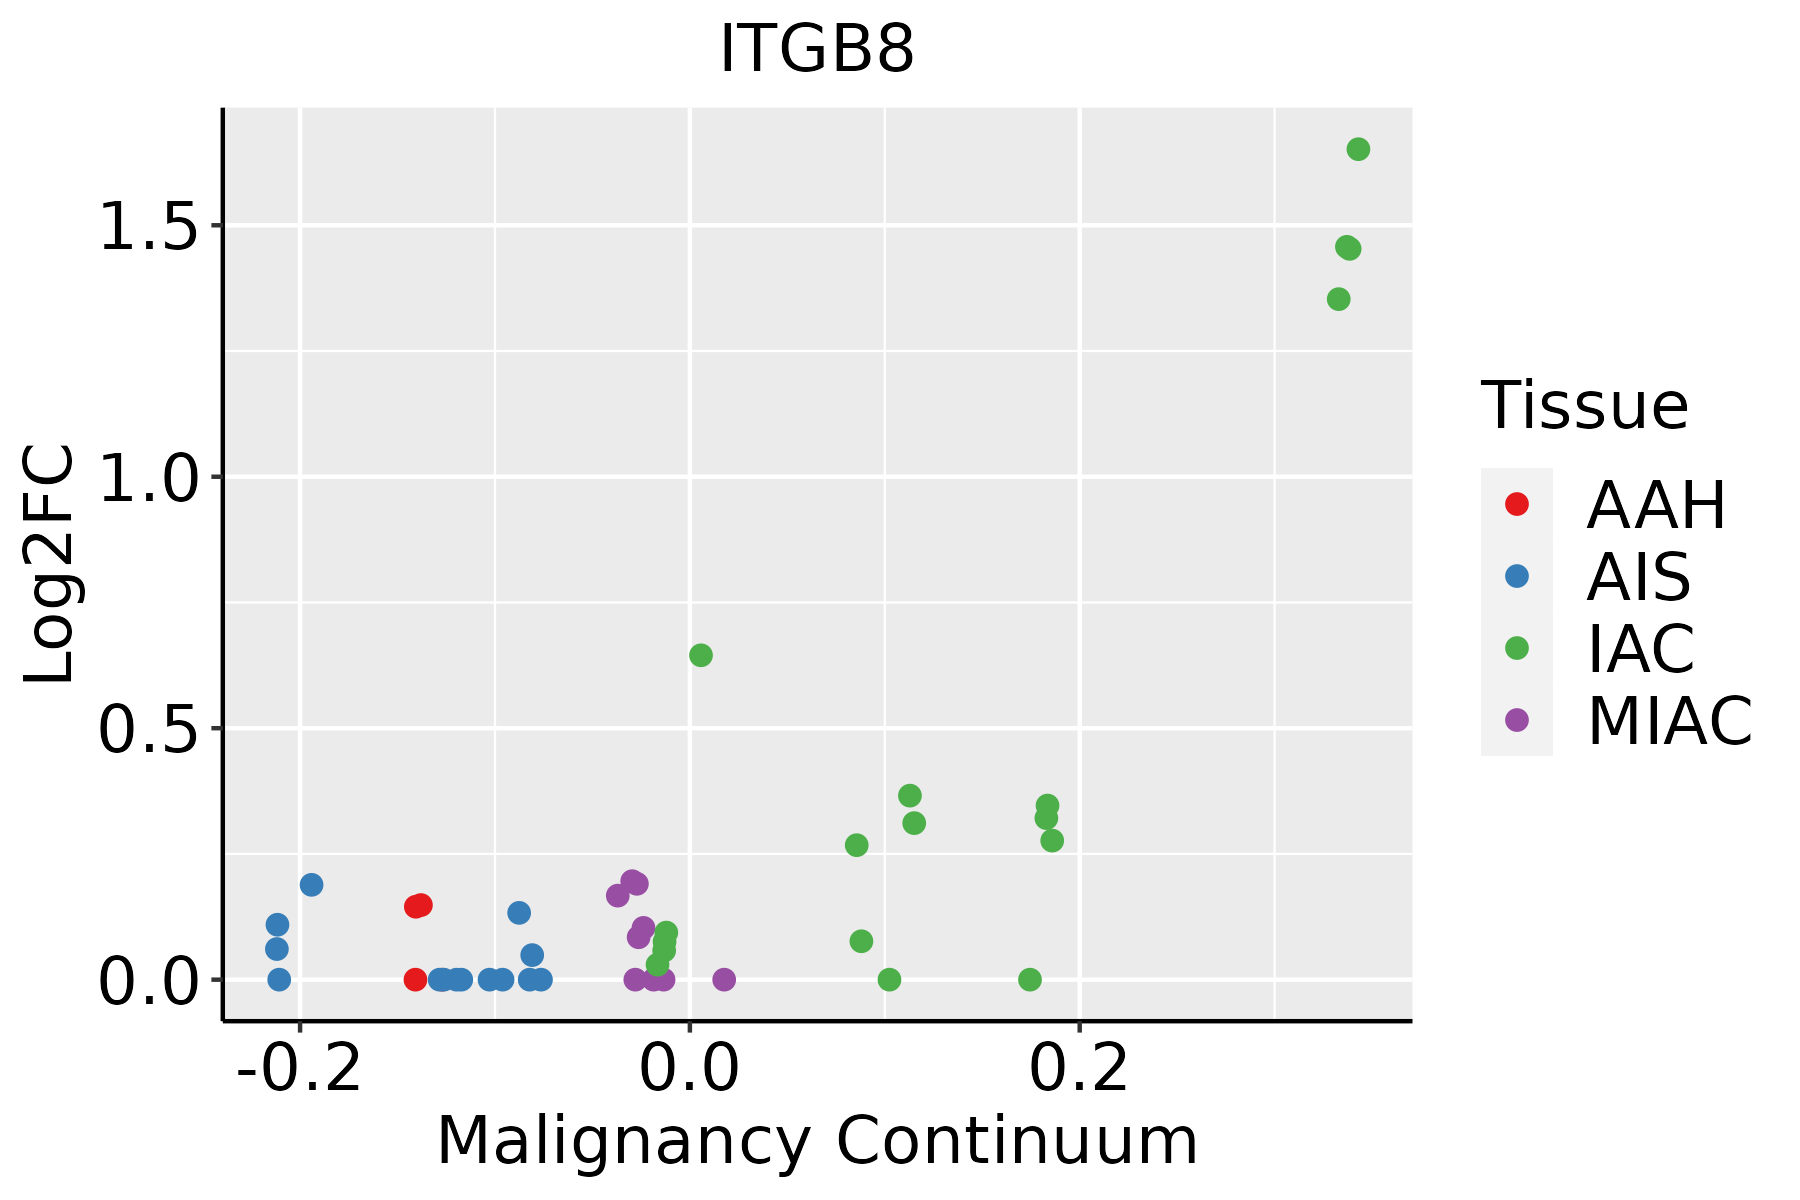 | AAH: Atypical adenomatous hyperplasia |
| AIS: Adenocarcinoma in situ | ||
| IAC: Invasive lung adenocarcinoma | ||
| MIA: Minimally invasive adenocarcinoma | ||
| Oral Cavity | 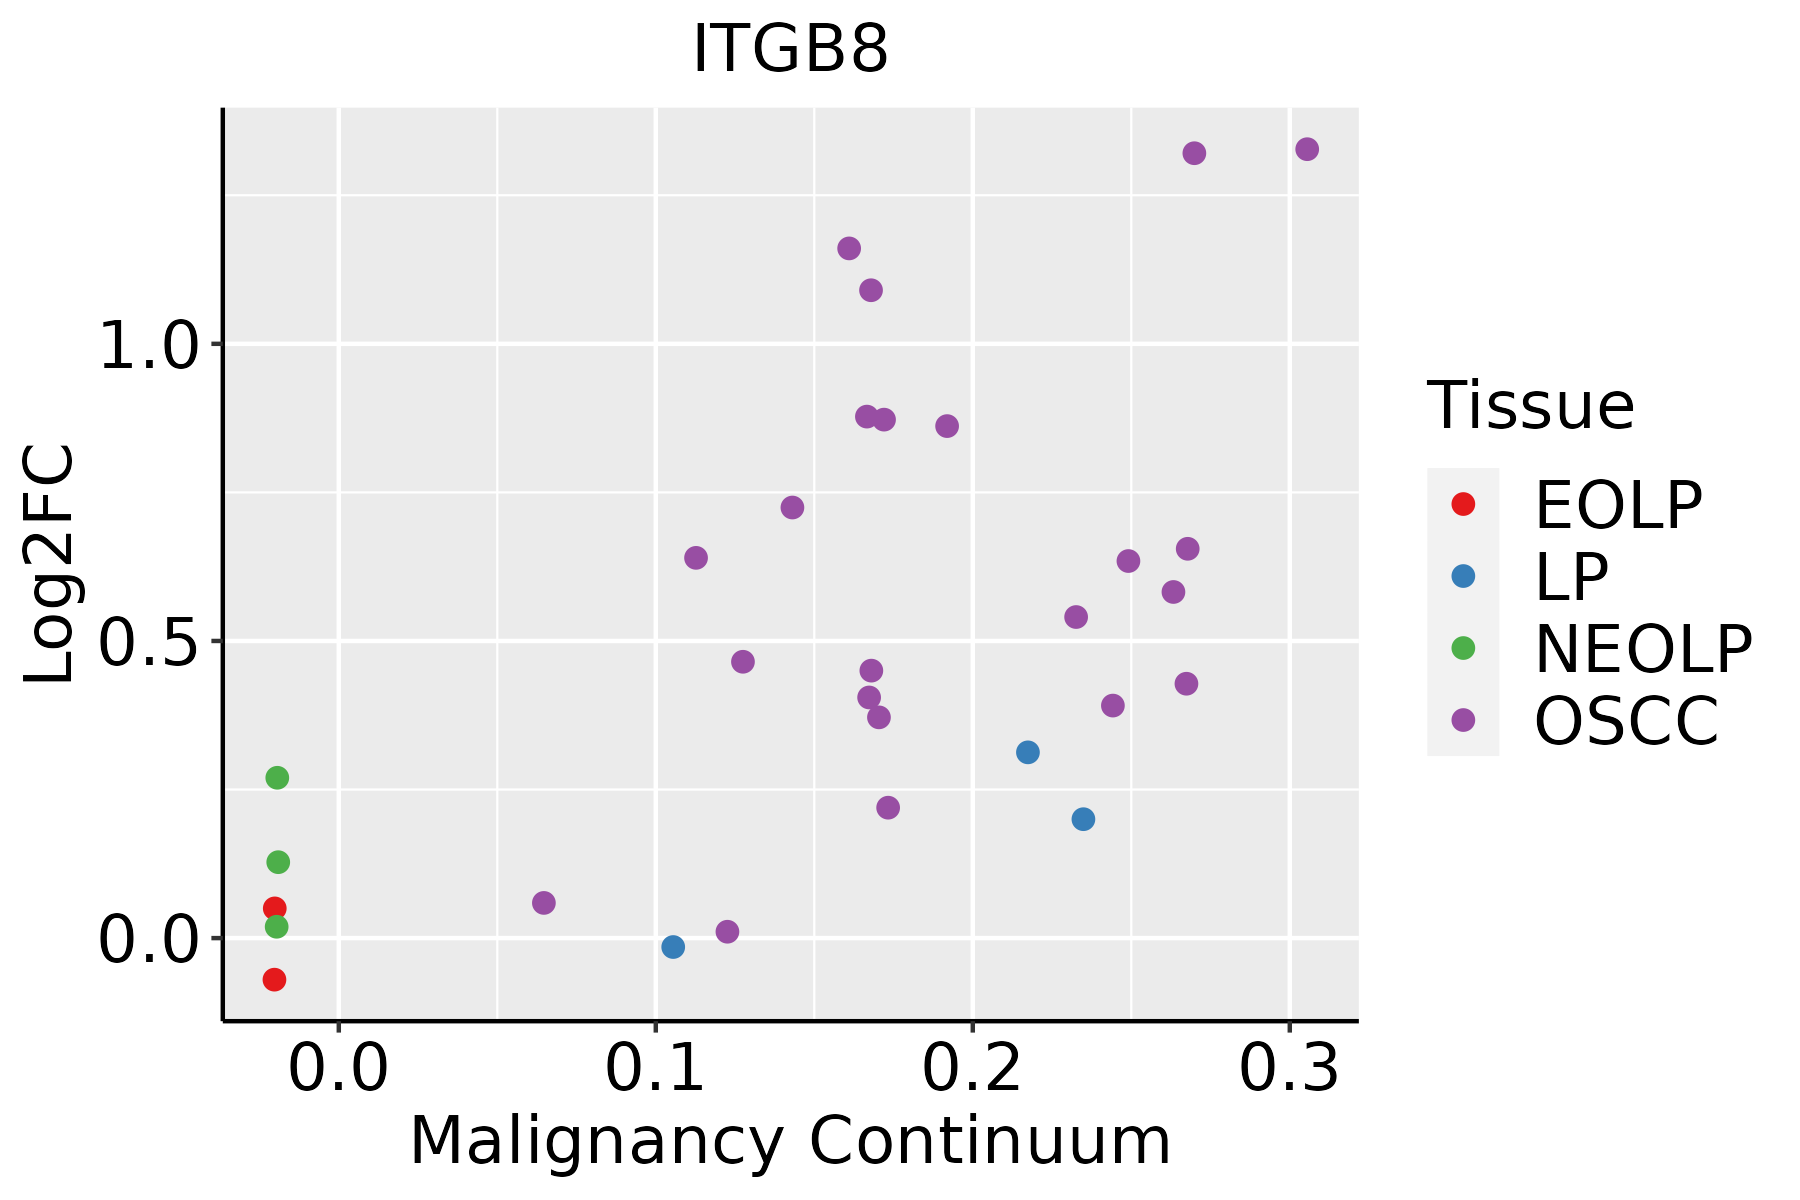 | EOLP: Erosive Oral lichen planus |
| LP: leukoplakia | ||
| NEOLP: Non-erosive oral lichen planus | ||
| OSCC: Oral squamous cell carcinoma | ||
| Prostate | 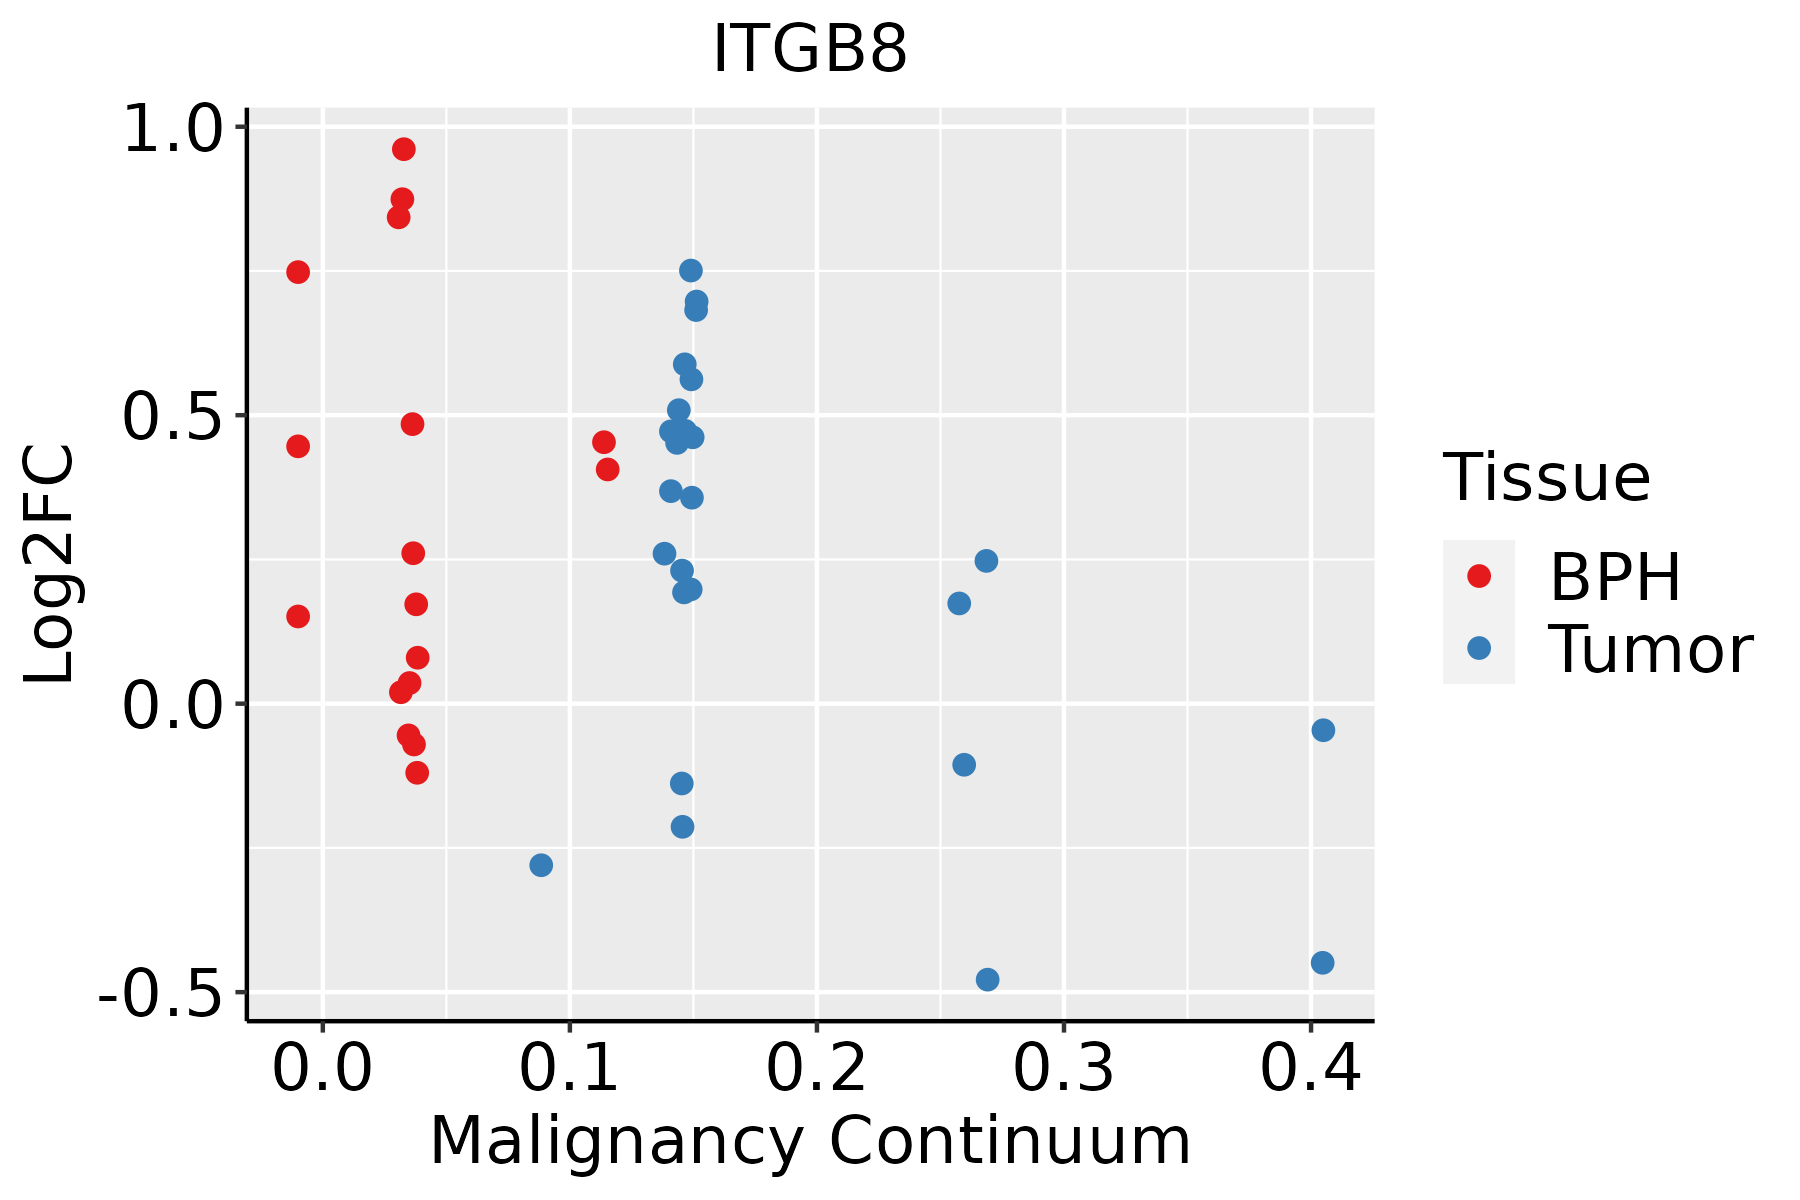 | BPH: Benign Prostatic Hyperplasia |
| Skin | 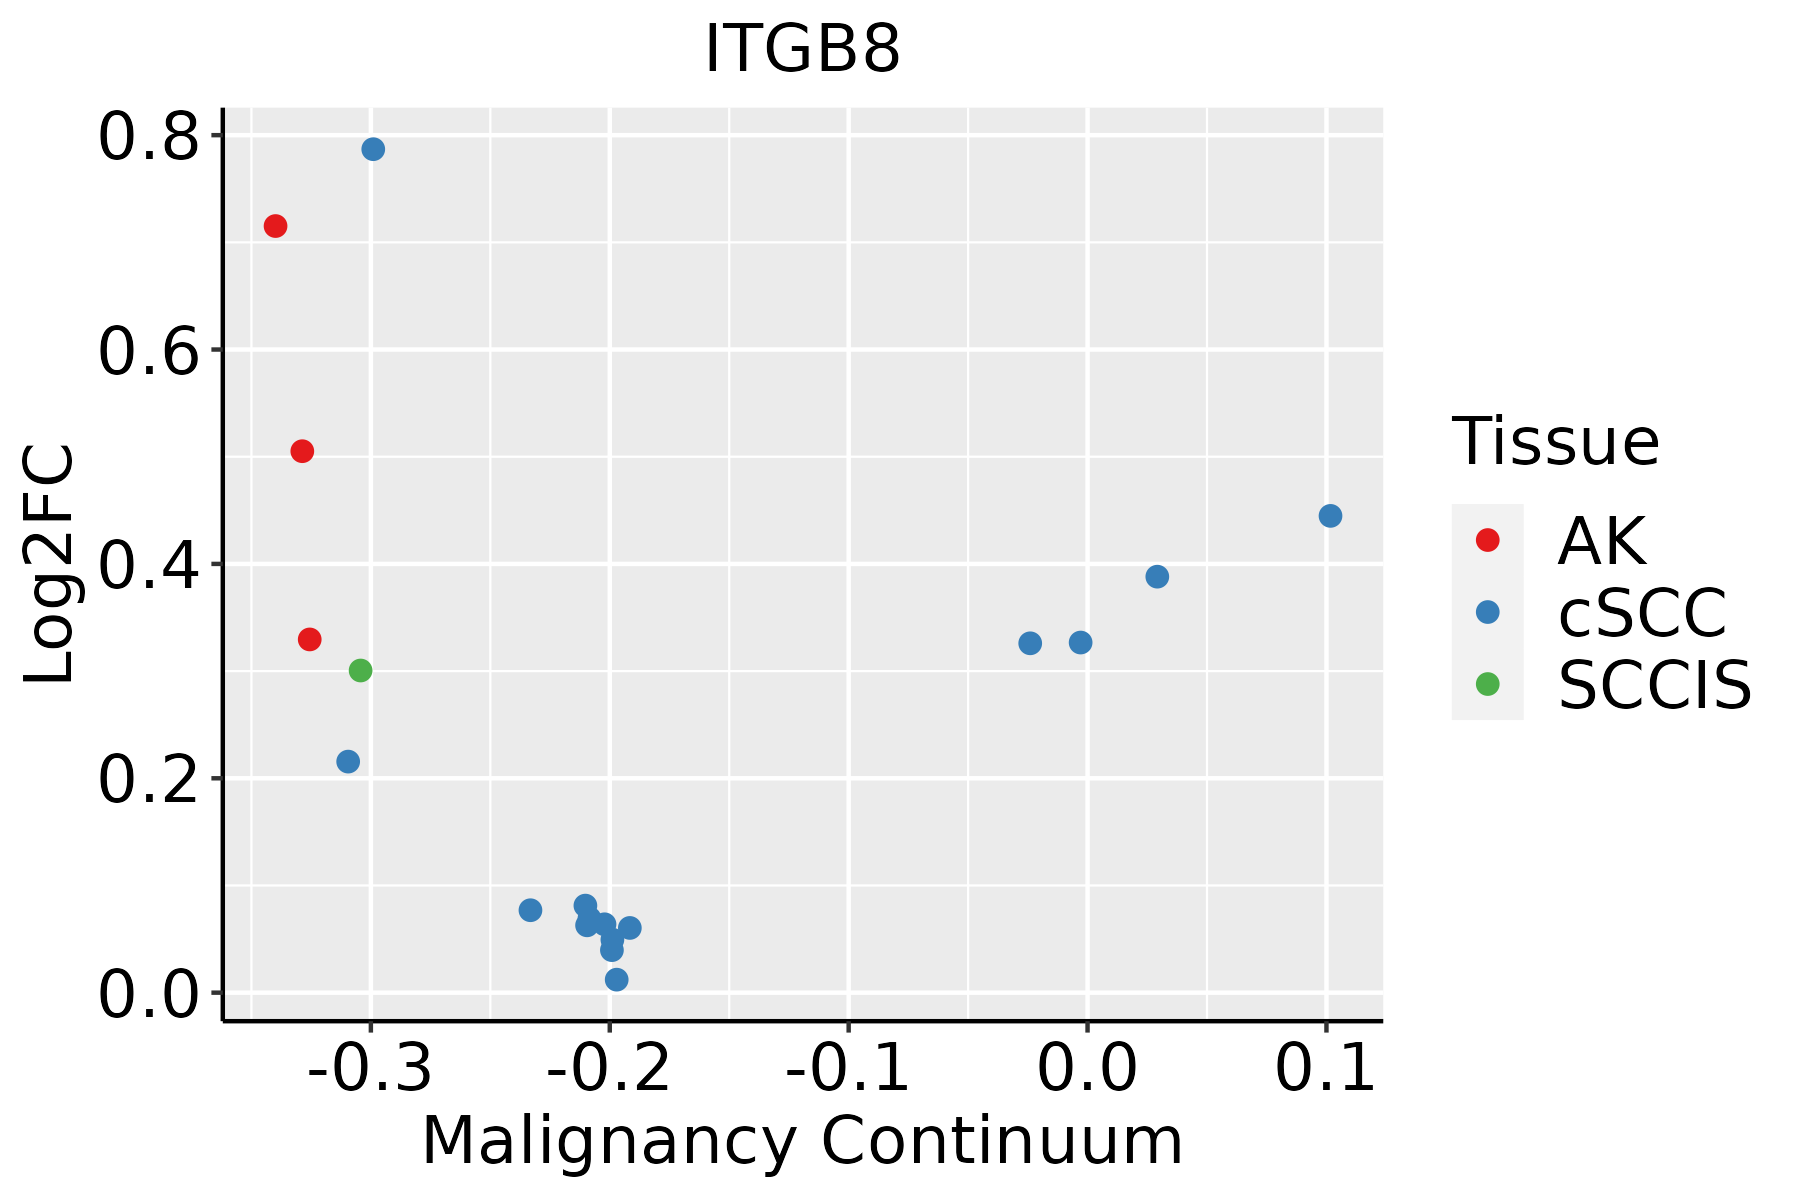 | AK: Actinic keratosis |
| cSCC: Cutaneous squamous cell carcinoma | ||
| SCCIS:squamous cell carcinoma in situ | ||
| Thyroid | 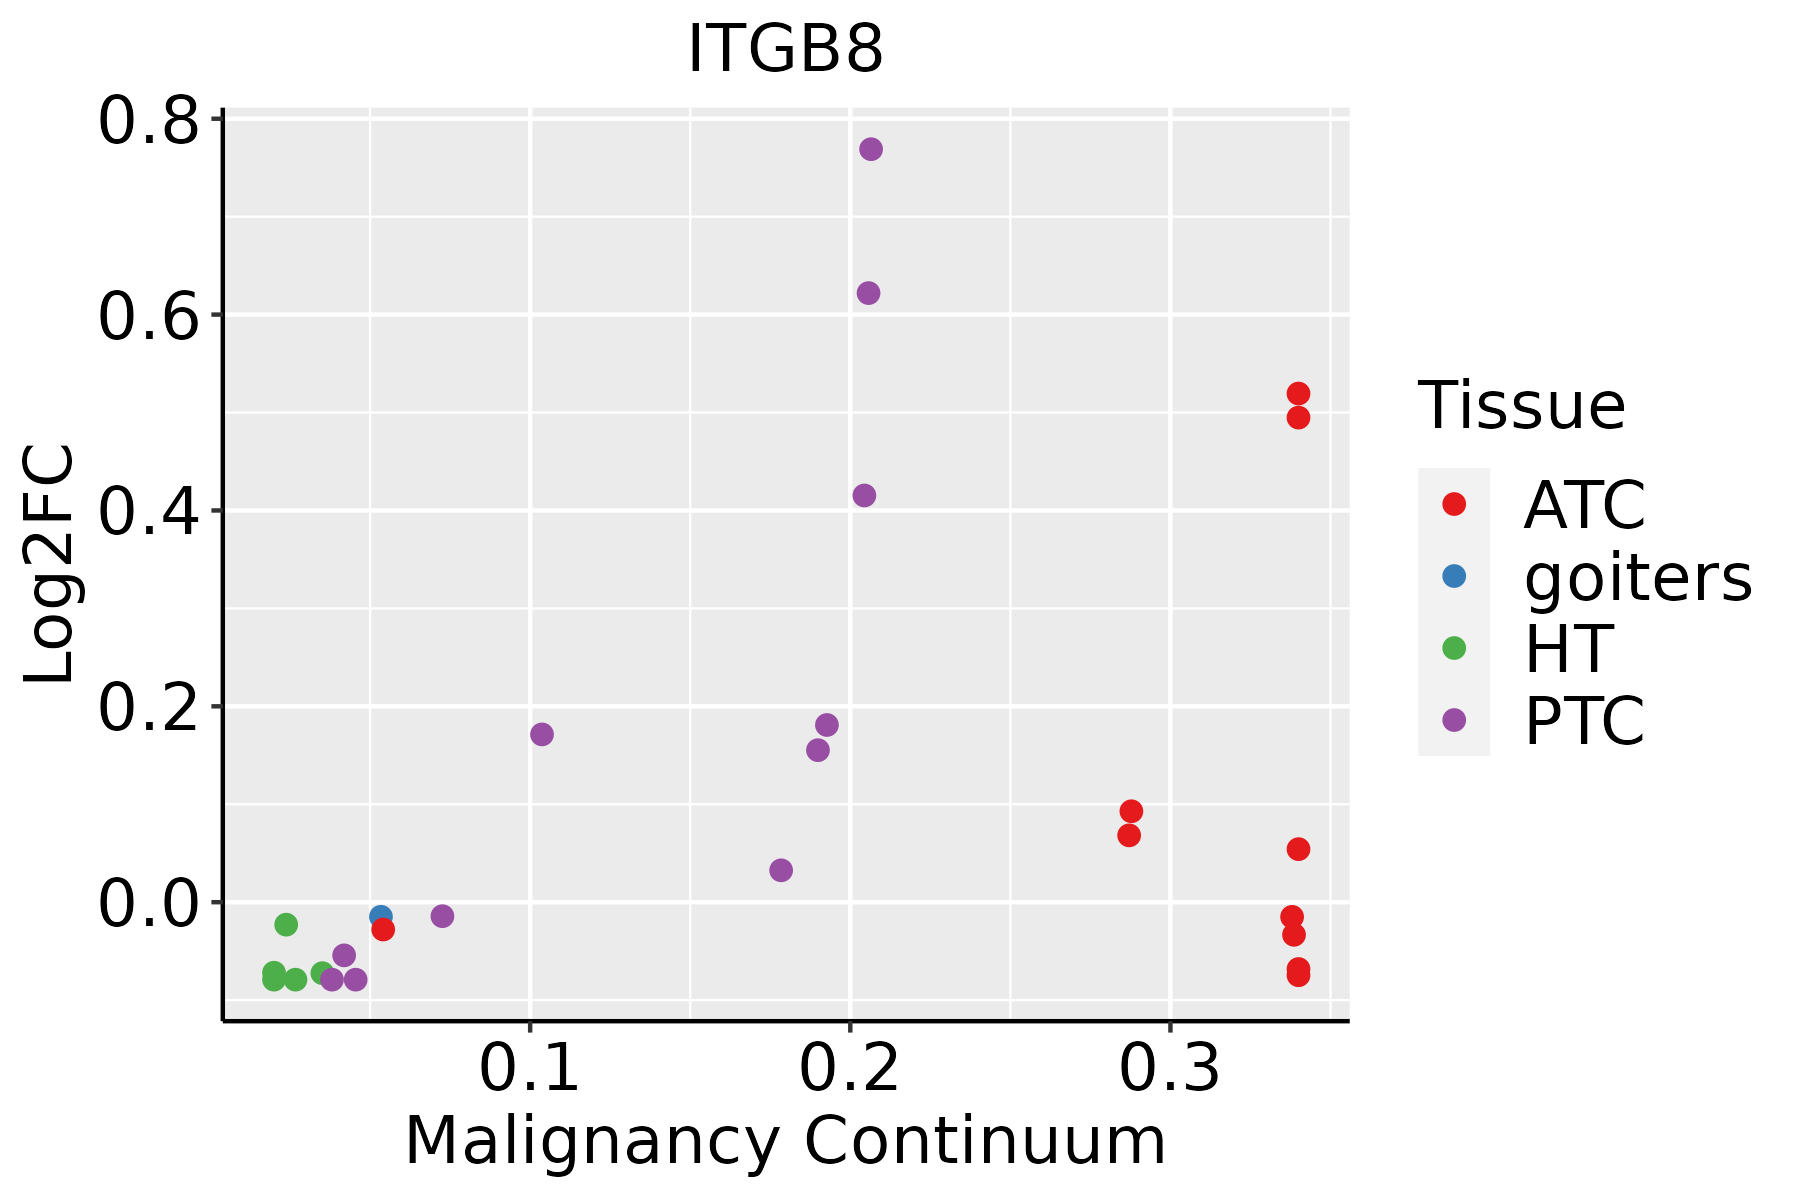 | ATC: Anaplastic thyroid cancer |
| HT: Hashimoto's thyroiditis | ||
| PTC: Papillary thyroid cancer |
| ∗log2FC in expression of this searched gene in stem-like cells from each diseased tissue sample relative to stem-like cells in normal samples in each tissue plotted against the malignancy continuum. Samples are colored based on if they are from different disease stage. |
Top |
Malignant transformation related pathway analysis |
| Find out the enriched GO biological processes and KEGG pathways involved in transition from healthy to precancer to cancer |
| Tissue | Disease Stage | Enriched GO biological Processes |
| Colorectum | AD |  |
| Colorectum | SER |  |
| Colorectum | MSS |  |
| Colorectum | MSI-H |  |
| Colorectum | FAP |  |
| ∗Top 15 enriched GO BP terms are showed in the bar plot of each disease state in each tissue. Each row represents a significant GO biological process which is colored according to the -log10(p.adjust). |
| Page: 1 2 3 4 5 6 7 8 9 |
| GO ID | Tissue | Disease Stage | Description | Gene Ratio | Bg Ratio | pvalue | p.adjust | Count |
| GO:00072295 | Cervix | CC | integrin-mediated signaling pathway | 34/2311 | 107/18723 | 1.01e-07 | 5.25e-06 | 34 |
| GO:003009910 | Cervix | CC | myeloid cell differentiation | 83/2311 | 381/18723 | 1.31e-07 | 6.42e-06 | 83 |
| GO:00018908 | Cervix | CC | placenta development | 40/2311 | 144/18723 | 4.59e-07 | 1.77e-05 | 40 |
| GO:00614588 | Cervix | CC | reproductive system development | 87/2311 | 427/18723 | 1.37e-06 | 4.55e-05 | 87 |
| GO:00486088 | Cervix | CC | reproductive structure development | 86/2311 | 424/18723 | 1.90e-06 | 5.97e-05 | 86 |
| GO:00096158 | Cervix | CC | response to virus | 73/2311 | 367/18723 | 2.22e-05 | 3.95e-04 | 73 |
| GO:00025738 | Cervix | CC | myeloid leukocyte differentiation | 47/2311 | 208/18723 | 2.48e-05 | 4.27e-04 | 47 |
| GO:00015704 | Cervix | CC | vasculogenesis | 22/2311 | 80/18723 | 1.97e-04 | 2.26e-03 | 22 |
| GO:00071786 | Cervix | CC | transmembrane receptor protein serine/threonine kinase signaling pathway | 67/2311 | 355/18723 | 2.39e-04 | 2.67e-03 | 67 |
| GO:00716344 | Cervix | CC | regulation of transforming growth factor beta production | 14/2311 | 41/18723 | 2.49e-04 | 2.77e-03 | 14 |
| GO:00716043 | Cervix | CC | transforming growth factor beta production | 14/2311 | 43/18723 | 4.37e-04 | 4.38e-03 | 14 |
| GO:19031314 | Cervix | CC | mononuclear cell differentiation | 76/2311 | 426/18723 | 5.66e-04 | 5.42e-03 | 76 |
| GO:00715595 | Cervix | CC | response to transforming growth factor beta | 50/2311 | 256/18723 | 6.31e-04 | 5.91e-03 | 50 |
| GO:00715605 | Cervix | CC | cellular response to transforming growth factor beta stimulus | 49/2311 | 250/18723 | 6.55e-04 | 6.05e-03 | 49 |
| GO:00336272 | Cervix | CC | cell adhesion mediated by integrin | 19/2311 | 72/18723 | 9.11e-04 | 7.81e-03 | 19 |
| GO:00071795 | Cervix | CC | transforming growth factor beta receptor signaling pathway | 38/2311 | 198/18723 | 3.62e-03 | 2.31e-02 | 38 |
| GO:19013423 | Cervix | CC | regulation of vasculature development | 60/2311 | 348/18723 | 4.48e-03 | 2.72e-02 | 60 |
| GO:00457653 | Cervix | CC | regulation of angiogenesis | 59/2311 | 342/18723 | 4.73e-03 | 2.83e-02 | 59 |
| GO:00022743 | Cervix | CC | myeloid leukocyte activation | 41/2311 | 223/18723 | 5.66e-03 | 3.25e-02 | 41 |
| GO:000722913 | Cervix | HSIL_HPV | integrin-mediated signaling pathway | 19/737 | 107/18723 | 3.37e-08 | 2.76e-06 | 19 |
| Page: 1 2 3 4 5 6 7 8 9 10 11 12 13 14 15 |
| Pathway ID | Tissue | Disease Stage | Description | Gene Ratio | Bg Ratio | pvalue | p.adjust | qvalue | Count |
| hsa0451010 | Cervix | CC | Focal adhesion | 59/1267 | 203/8465 | 1.53e-07 | 1.84e-06 | 1.09e-06 | 59 |
| hsa0481016 | Cervix | CC | Regulation of actin cytoskeleton | 64/1267 | 229/8465 | 2.24e-07 | 2.59e-06 | 1.53e-06 | 64 |
| hsa051657 | Cervix | CC | Human papillomavirus infection | 74/1267 | 331/8465 | 1.70e-04 | 1.02e-03 | 6.03e-04 | 74 |
| hsa045147 | Cervix | CC | Cell adhesion molecules | 36/1267 | 157/8465 | 4.94e-03 | 1.67e-02 | 9.86e-03 | 36 |
| hsa0451014 | Cervix | CC | Focal adhesion | 59/1267 | 203/8465 | 1.53e-07 | 1.84e-06 | 1.09e-06 | 59 |
| hsa0481017 | Cervix | CC | Regulation of actin cytoskeleton | 64/1267 | 229/8465 | 2.24e-07 | 2.59e-06 | 1.53e-06 | 64 |
| hsa0516512 | Cervix | CC | Human papillomavirus infection | 74/1267 | 331/8465 | 1.70e-04 | 1.02e-03 | 6.03e-04 | 74 |
| hsa0451412 | Cervix | CC | Cell adhesion molecules | 36/1267 | 157/8465 | 4.94e-03 | 1.67e-02 | 9.86e-03 | 36 |
| hsa0451421 | Cervix | HSIL_HPV | Cell adhesion molecules | 20/459 | 157/8465 | 3.03e-04 | 3.06e-03 | 2.47e-03 | 20 |
| hsa045124 | Cervix | HSIL_HPV | ECM-receptor interaction | 12/459 | 89/8465 | 2.95e-03 | 1.88e-02 | 1.52e-02 | 12 |
| hsa0451023 | Cervix | HSIL_HPV | Focal adhesion | 21/459 | 203/8465 | 3.24e-03 | 2.02e-02 | 1.63e-02 | 21 |
| hsa054127 | Cervix | HSIL_HPV | Arrhythmogenic right ventricular cardiomyopathy | 10/459 | 77/8465 | 8.34e-03 | 4.70e-02 | 3.80e-02 | 10 |
| hsa0451431 | Cervix | HSIL_HPV | Cell adhesion molecules | 20/459 | 157/8465 | 3.03e-04 | 3.06e-03 | 2.47e-03 | 20 |
| hsa0451211 | Cervix | HSIL_HPV | ECM-receptor interaction | 12/459 | 89/8465 | 2.95e-03 | 1.88e-02 | 1.52e-02 | 12 |
| hsa0451033 | Cervix | HSIL_HPV | Focal adhesion | 21/459 | 203/8465 | 3.24e-03 | 2.02e-02 | 1.63e-02 | 21 |
| hsa0541212 | Cervix | HSIL_HPV | Arrhythmogenic right ventricular cardiomyopathy | 10/459 | 77/8465 | 8.34e-03 | 4.70e-02 | 3.80e-02 | 10 |
| hsa0451441 | Cervix | N_HPV | Cell adhesion molecules | 18/349 | 157/8465 | 7.71e-05 | 8.06e-04 | 6.30e-04 | 18 |
| hsa0451451 | Cervix | N_HPV | Cell adhesion molecules | 18/349 | 157/8465 | 7.71e-05 | 8.06e-04 | 6.30e-04 | 18 |
| hsa0451015 | Endometrium | AEH | Focal adhesion | 58/1197 | 203/8465 | 4.99e-08 | 7.37e-07 | 5.39e-07 | 58 |
| hsa0481018 | Endometrium | AEH | Regulation of actin cytoskeleton | 50/1197 | 229/8465 | 9.08e-04 | 5.78e-03 | 4.23e-03 | 50 |
| Page: 1 2 3 4 5 |
Top |
Cell-cell communication analysis |
| Identification of potential cell-cell interactions between two cell types and their ligand-receptor pairs for different disease states |
| Ligand | Receptor | LRpair | Pathway | Tissue | Disease Stage |
| COL1A1 | ITGAV_ITGB8 | COL1A1_ITGAV_ITGB8 | COLLAGEN | Breast | Healthy |
| COL1A2 | ITGAV_ITGB8 | COL1A2_ITGAV_ITGB8 | COLLAGEN | Breast | Healthy |
| COL4A1 | ITGAV_ITGB8 | COL4A1_ITGAV_ITGB8 | COLLAGEN | Breast | Healthy |
| COL4A2 | ITGAV_ITGB8 | COL4A2_ITGAV_ITGB8 | COLLAGEN | Breast | Healthy |
| COL6A1 | ITGAV_ITGB8 | COL6A1_ITGAV_ITGB8 | COLLAGEN | Breast | Healthy |
| COL6A2 | ITGAV_ITGB8 | COL6A2_ITGAV_ITGB8 | COLLAGEN | Breast | Healthy |
| COL6A3 | ITGAV_ITGB8 | COL6A3_ITGAV_ITGB8 | COLLAGEN | Breast | Healthy |
| LAMA2 | ITGAV_ITGB8 | LAMA2_ITGAV_ITGB8 | LAMININ | Breast | Healthy |
| LAMA3 | ITGAV_ITGB8 | LAMA3_ITGAV_ITGB8 | LAMININ | Breast | Healthy |
| LAMA4 | ITGAV_ITGB8 | LAMA4_ITGAV_ITGB8 | LAMININ | Breast | Healthy |
| LAMB1 | ITGAV_ITGB8 | LAMB1_ITGAV_ITGB8 | LAMININ | Breast | Healthy |
| LAMB2 | ITGAV_ITGB8 | LAMB2_ITGAV_ITGB8 | LAMININ | Breast | Healthy |
| LAMB3 | ITGAV_ITGB8 | LAMB3_ITGAV_ITGB8 | LAMININ | Breast | Healthy |
| LAMC1 | ITGAV_ITGB8 | LAMC1_ITGAV_ITGB8 | LAMININ | Breast | Healthy |
| LAMC2 | ITGAV_ITGB8 | LAMC2_ITGAV_ITGB8 | LAMININ | Breast | Healthy |
| FN1 | ITGAV_ITGB8 | FN1_ITGAV_ITGB8 | FN1 | Breast | Healthy |
| COL1A1 | ITGAV_ITGB8 | COL1A1_ITGAV_ITGB8 | COLLAGEN | Cervix | ADJ |
| COL1A2 | ITGAV_ITGB8 | COL1A2_ITGAV_ITGB8 | COLLAGEN | Cervix | ADJ |
| COL4A1 | ITGAV_ITGB8 | COL4A1_ITGAV_ITGB8 | COLLAGEN | Cervix | ADJ |
| COL4A2 | ITGAV_ITGB8 | COL4A2_ITGAV_ITGB8 | COLLAGEN | Cervix | ADJ |
| Page: 1 |
Top |
Single-cell gene regulatory network inference analysis |
| Find out the significant the regulons (TFs) and the target genes of each regulon across cell types for different disease states |
| TF | Cell Type | Tissue | Disease Stage | Target Gene | RSS | Regulon Activity |
| ∗The dot plots of a searched regulon are shown for all cell subpopulations in each disease state of each tissue based on the regulon specific score inferred using pySCENIC and by calculating the average expression. |
| Page: 1 |
Top |
Somatic mutation of malignant transformation related genes |
| Annotation of somatic variants for genes involved in malignant transformation |
| Hugo Symbol | Variant Class | Variant Classification | dbSNP RS | HGVSc | HGVSp | HGVSp Short | SWISSPROT | BIOTYPE | SIFT | PolyPhen | Tumor Sample Barcode | Tissue | Histology | Sex | Age | Stage | Therapy Types | Drugs | Outcome |
| ITGB8 | SNV | Missense_Mutation | c.1760N>T | p.Ser587Leu | p.S587L | P26012 | protein_coding | tolerated(0.51) | benign(0) | TCGA-AC-A23H-01 | Breast | breast invasive carcinoma | Female | >=65 | I/II | Unknown | Unknown | PD | |
| ITGB8 | SNV | Missense_Mutation | c.1001N>G | p.Asp334Gly | p.D334G | P26012 | protein_coding | deleterious(0.01) | benign(0.227) | TCGA-AO-A0J2-01 | Breast | breast invasive carcinoma | Female | <65 | I/II | Chemotherapy | cyclophosphamide | SD | |
| ITGB8 | SNV | Missense_Mutation | novel | c.913N>A | p.Gly305Arg | p.G305R | P26012 | protein_coding | deleterious(0) | probably_damaging(0.994) | TCGA-AO-A128-01 | Breast | breast invasive carcinoma | Female | <65 | I/II | Chemotherapy | doxorubicin | SD |
| ITGB8 | SNV | Missense_Mutation | c.1425N>T | p.Arg475Ser | p.R475S | P26012 | protein_coding | tolerated(0.74) | benign(0.003) | TCGA-BH-A1F0-01 | Breast | breast invasive carcinoma | Female | >=65 | I/II | Unknown | Unknown | PD | |
| ITGB8 | SNV | Missense_Mutation | c.575T>C | p.Val192Ala | p.V192A | P26012 | protein_coding | deleterious(0) | probably_damaging(0.995) | TCGA-D8-A1XK-01 | Breast | breast invasive carcinoma | Female | <65 | I/II | Chemotherapy | doxorubicine+cyclophosphamide | SD | |
| ITGB8 | SNV | Missense_Mutation | novel | c.874C>G | p.Leu292Val | p.L292V | P26012 | protein_coding | deleterious(0.01) | probably_damaging(0.999) | TCGA-E9-A3QA-01 | Breast | breast invasive carcinoma | Female | <65 | I/II | Unknown | Unknown | SD |
| ITGB8 | deletion | Frame_Shift_Del | novel | c.1828delN | p.Gly610GlufsTer74 | p.G610Efs*74 | P26012 | protein_coding | TCGA-EW-A2FV-01 | Breast | breast invasive carcinoma | Female | <65 | III/IV | Chemotherapy | docetaxel | SD | ||
| ITGB8 | SNV | Missense_Mutation | novel | c.109N>T | p.Leu37Phe | p.L37F | P26012 | protein_coding | tolerated(0.08) | benign(0.003) | TCGA-C5-A8XJ-01 | Cervix | cervical & endocervical cancer | Female | >=65 | I/II | Chemotherapy | cisplatin | SD |
| ITGB8 | SNV | Missense_Mutation | rs370739263 | c.714G>C | p.Glu238Asp | p.E238D | P26012 | protein_coding | tolerated(0.51) | possibly_damaging(0.475) | TCGA-Q1-A73O-01 | Cervix | cervical & endocervical cancer | Female | <65 | I/II | Chemotherapy | cisplatin | CR |
| ITGB8 | SNV | Missense_Mutation | c.1261N>G | p.Asn421Asp | p.N421D | P26012 | protein_coding | tolerated(0.19) | possibly_damaging(0.555) | TCGA-AA-3715-01 | Colorectum | colon adenocarcinoma | Male | >=65 | I/II | Unknown | Unknown | PD |
| Page: 1 2 3 4 5 6 7 8 9 10 11 |
Top |
Related drugs of malignant transformation related genes |
| Identification of chemicals and drugs interact with genes involved in malignant transfromation |
| (DGIdb 4.0) |
| Entrez ID | Symbol | Category | Interaction Types | Drug Claim Name | Drug Name | PMIDs |
| 3696 | ITGB8 | DRUGGABLE GENOME, CELL SURFACE | US10035778, Example 16 | |||
| 3696 | ITGB8 | DRUGGABLE GENOME, CELL SURFACE | US10035778, Example 12 | |||
| 3696 | ITGB8 | DRUGGABLE GENOME, CELL SURFACE | US10035778, Example 1 | |||
| 3696 | ITGB8 | DRUGGABLE GENOME, CELL SURFACE | inhibitor | 385612210 |
| Page: 1 |

Copyright 2023-Present -The University of Texas Health Science Center at Houston |