
|
|||||
|
 | |
| |
| |
| |
| |
| |
|
Gene: ITGB3 |
Gene summary for ITGB3 |
| Gene information | Species | Human | Gene symbol | ITGB3 | Gene ID | 3690 |
| Gene name | integrin subunit beta 3 | |
| Gene Alias | BDPLT16 | |
| Cytomap | 17q21.32 | |
| Gene Type | protein-coding | GO ID | GO:0000902 | UniProtAcc | P05106 |
Top |
Malignant transformation analysis |
| Identification of the aberrant gene expression in precancerous and cancerous lesions by comparing the gene expression of stem-like cells in diseased tissues with normal stem cells |
| Entrez ID | Symbol | Replicates | Species | Organ | Tissue | Adj P-value | Log2FC | Malignancy |
| 3690 | ITGB3 | male-WTA | Human | Thyroid | PTC | 8.28e-20 | 2.61e-01 | 0.1037 |
| 3690 | ITGB3 | nodule-WTA | Human | Thyroid | goiters | 2.52e-02 | 1.85e-01 | 0.0534 |
| 3690 | ITGB3 | PTC01 | Human | Thyroid | PTC | 2.79e-10 | 2.45e-01 | 0.1899 |
| 3690 | ITGB3 | PTC04 | Human | Thyroid | PTC | 8.44e-14 | 3.76e-01 | 0.1927 |
| 3690 | ITGB3 | PTC05 | Human | Thyroid | PTC | 6.16e-17 | 6.14e-01 | 0.2065 |
| 3690 | ITGB3 | PTC06 | Human | Thyroid | PTC | 1.22e-39 | 8.10e-01 | 0.2057 |
| 3690 | ITGB3 | PTC07 | Human | Thyroid | PTC | 4.59e-16 | 3.12e-01 | 0.2044 |
| 3690 | ITGB3 | ATC2 | Human | Thyroid | ATC | 1.60e-07 | 6.07e-01 | 0.34 |
| 3690 | ITGB3 | ATC4 | Human | Thyroid | ATC | 3.76e-06 | 1.41e-01 | 0.34 |
| Page: 1 |
| Tissue | Expression Dynamics | Abbreviation |
| Thyroid | 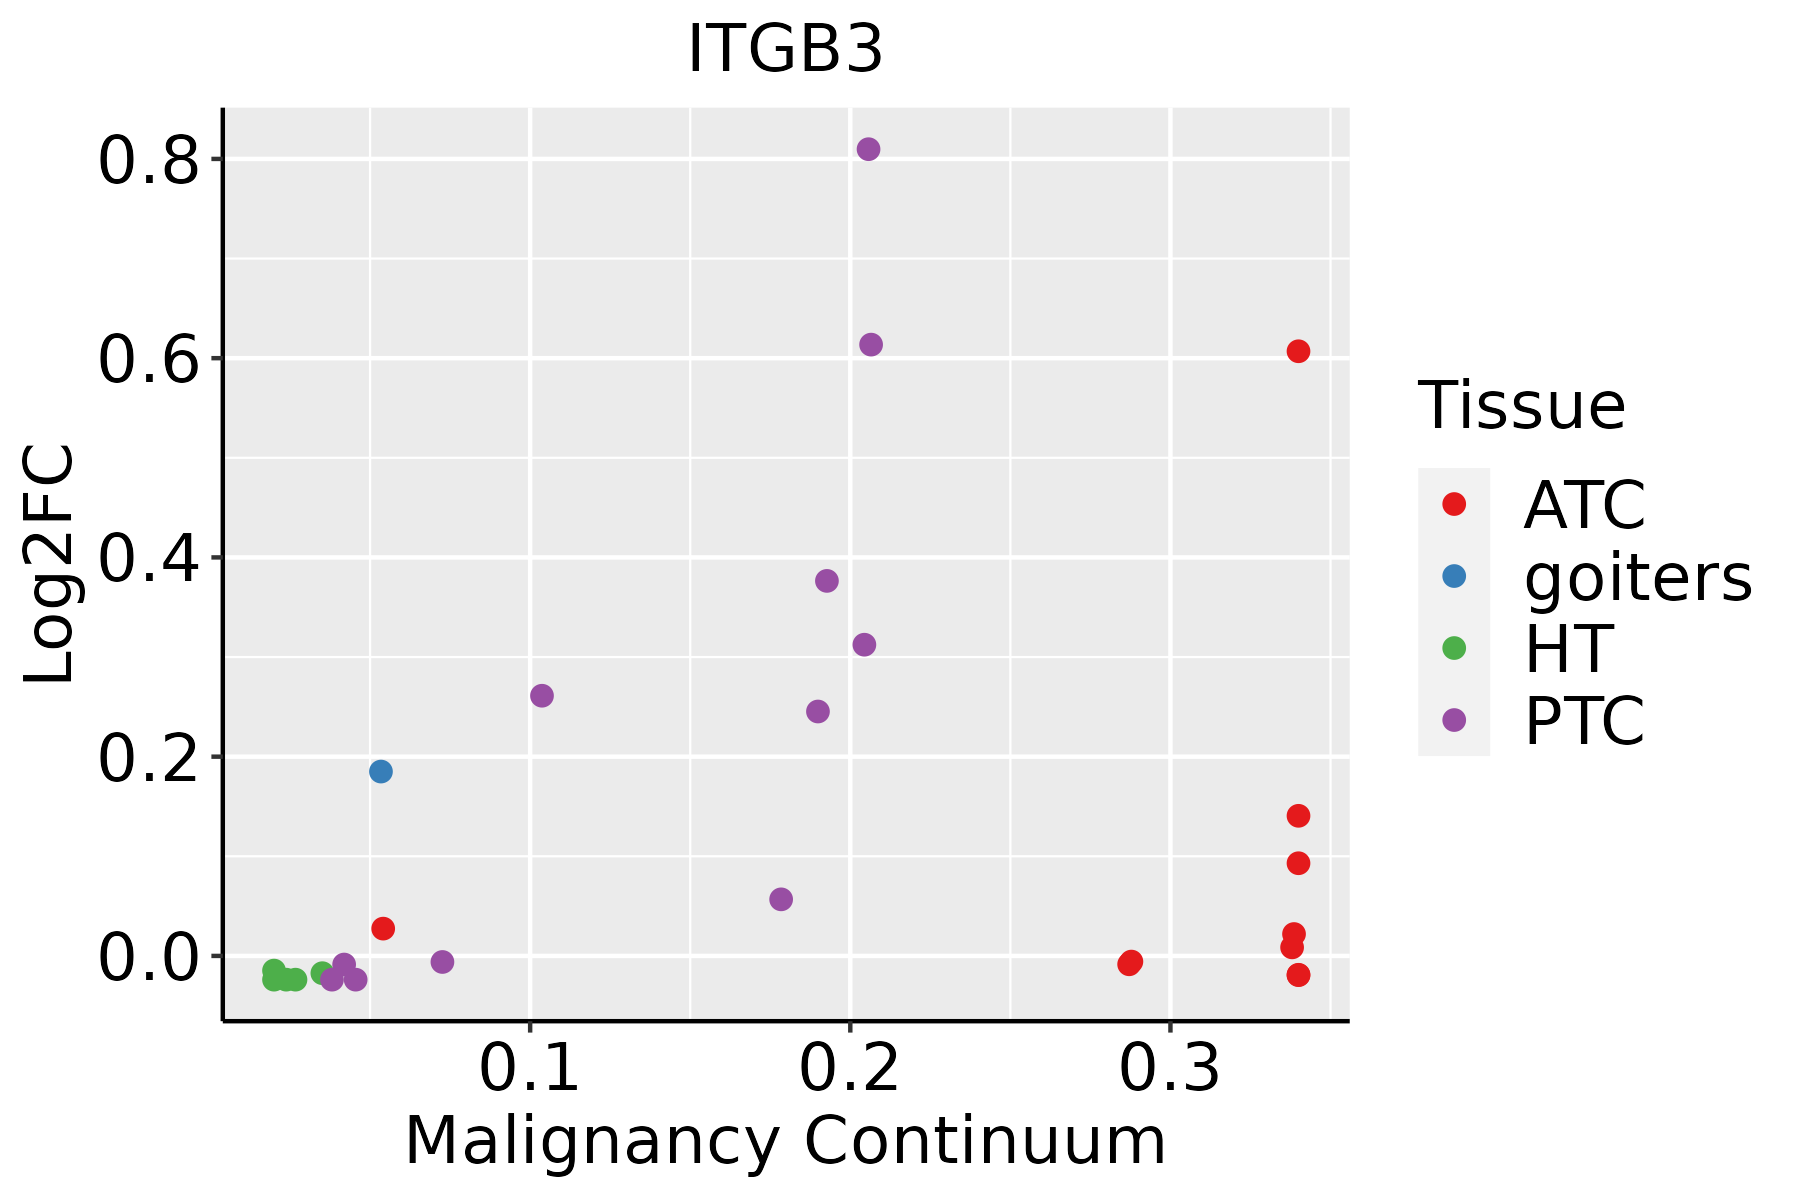 | ATC: Anaplastic thyroid cancer |
| HT: Hashimoto's thyroiditis | ||
| PTC: Papillary thyroid cancer |
| ∗log2FC in expression of this searched gene in stem-like cells from each diseased tissue sample relative to stem-like cells in normal samples in each tissue plotted against the malignancy continuum. Samples are colored based on if they are from different disease stage. |
Top |
Malignant transformation related pathway analysis |
| Find out the enriched GO biological processes and KEGG pathways involved in transition from healthy to precancer to cancer |
| Tissue | Disease Stage | Enriched GO biological Processes |
| Colorectum | AD |  |
| Colorectum | SER |  |
| Colorectum | MSS |  |
| Colorectum | MSI-H |  |
| Colorectum | FAP |  |
| ∗Top 15 enriched GO BP terms are showed in the bar plot of each disease state in each tissue. Each row represents a significant GO biological process which is colored according to the -log10(p.adjust). |
| Page: 1 2 3 4 5 6 7 8 9 |
| GO ID | Tissue | Disease Stage | Description | Gene Ratio | Bg Ratio | pvalue | p.adjust | Count |
| GO:00063257 | Cervix | CC | chromatin organization | 78/2311 | 409/18723 | 5.40e-05 | 8.02e-04 | 78 |
| GO:00063381 | Cervix | CC | chromatin remodeling | 45/2311 | 255/18723 | 8.33e-03 | 4.30e-02 | 45 |
| GO:000632516 | Esophagus | HGIN | chromatin organization | 92/2587 | 409/18723 | 1.05e-06 | 4.16e-05 | 92 |
| GO:000632517 | Esophagus | ESCC | chromatin organization | 240/8552 | 409/18723 | 6.52e-08 | 1.14e-06 | 240 |
| GO:00345081 | Esophagus | ESCC | centromere complex assembly | 25/8552 | 30/18723 | 2.45e-05 | 2.09e-04 | 25 |
| GO:0031055 | Esophagus | ESCC | chromatin remodeling at centromere | 9/8552 | 10/18723 | 5.09e-03 | 1.92e-02 | 9 |
| GO:0043486 | Esophagus | ESCC | histone exchange | 16/8552 | 22/18723 | 9.46e-03 | 3.28e-02 | 16 |
| GO:0034508 | Oral cavity | OSCC | centromere complex assembly | 21/7305 | 30/18723 | 5.75e-04 | 3.30e-03 | 21 |
| GO:000632510 | Oral cavity | OSCC | chromatin organization | 190/7305 | 409/18723 | 1.17e-03 | 5.97e-03 | 190 |
| GO:000632519 | Skin | cSCC | chromatin organization | 147/4864 | 409/18723 | 4.41e-06 | 6.52e-05 | 147 |
| GO:000633812 | Skin | cSCC | chromatin remodeling | 94/4864 | 255/18723 | 7.58e-05 | 7.26e-04 | 94 |
| GO:00718241 | Skin | cSCC | protein-DNA complex subunit organization | 87/4864 | 241/18723 | 3.09e-04 | 2.47e-03 | 87 |
| GO:00345082 | Skin | cSCC | centromere complex assembly | 16/4864 | 30/18723 | 1.27e-03 | 8.19e-03 | 16 |
| GO:00711031 | Skin | cSCC | DNA conformation change | 96/4864 | 290/18723 | 3.87e-03 | 2.07e-02 | 96 |
| GO:00434861 | Skin | cSCC | histone exchange | 12/4864 | 22/18723 | 4.04e-03 | 2.15e-02 | 12 |
| GO:0016032113 | Thyroid | PTC | viral process | 236/5968 | 415/18723 | 2.48e-26 | 8.24e-24 | 236 |
| GO:0019058113 | Thyroid | PTC | viral life cycle | 167/5968 | 317/18723 | 8.87e-15 | 5.89e-13 | 167 |
| GO:0044403113 | Thyroid | PTC | biological process involved in symbiotic interaction | 151/5968 | 290/18723 | 5.83e-13 | 2.85e-11 | 151 |
| GO:0051701113 | Thyroid | PTC | biological process involved in interaction with host | 109/5968 | 203/18723 | 8.64e-11 | 2.99e-09 | 109 |
| GO:0031589111 | Thyroid | PTC | cell-substrate adhesion | 169/5968 | 363/18723 | 2.73e-09 | 7.57e-08 | 169 |
| Page: 1 2 3 4 5 6 7 |
| Pathway ID | Tissue | Disease Stage | Description | Gene Ratio | Bg Ratio | pvalue | p.adjust | qvalue | Count |
| Page: 1 |
Top |
Cell-cell communication analysis |
| Identification of potential cell-cell interactions between two cell types and their ligand-receptor pairs for different disease states |
| Ligand | Receptor | LRpair | Pathway | Tissue | Disease Stage |
| FN1 | ITGAV_ITGB3 | FN1_ITGAV_ITGB3 | FN1 | THCA | ADJ |
| THBS1 | ITGAV_ITGB3 | THBS1_ITGAV_ITGB3 | THBS | THCA | ADJ |
| THBS2 | ITGAV_ITGB3 | THBS2_ITGAV_ITGB3 | THBS | THCA | ADJ |
| SPP1 | ITGAV_ITGB3 | SPP1_ITGAV_ITGB3 | SPP1 | THCA | ADJ |
| TNXB | ITGAV_ITGB3 | TNXB_ITGAV_ITGB3 | TENASCIN | THCA | ADJ |
| PTN | ITGAV_ITGB3 | PTN_ITGAV_ITGB3 | PTN | THCA | ADJ |
| VWF | ITGAV_ITGB3 | VWF_ITGAV_ITGB3 | VWF | THCA | ADJ |
| IGF1 | ITGAV_ITGB3 | IGF1_ITGAV_ITGB3 | IGF | THCA | ADJ |
| Page: 1 |
Top |
Single-cell gene regulatory network inference analysis |
| Find out the significant the regulons (TFs) and the target genes of each regulon across cell types for different disease states |
| TF | Cell Type | Tissue | Disease Stage | Target Gene | RSS | Regulon Activity |
| ∗The dot plots of a searched regulon are shown for all cell subpopulations in each disease state of each tissue based on the regulon specific score inferred using pySCENIC and by calculating the average expression. |
| Page: 1 |
Top |
Somatic mutation of malignant transformation related genes |
| Annotation of somatic variants for genes involved in malignant transformation |
| Hugo Symbol | Variant Class | Variant Classification | dbSNP RS | HGVSc | HGVSp | HGVSp Short | SWISSPROT | BIOTYPE | SIFT | PolyPhen | Tumor Sample Barcode | Tissue | Histology | Sex | Age | Stage | Therapy Types | Drugs | Outcome |
| ITGB3 | SNV | Missense_Mutation | novel | c.230N>A | p.Pro77Gln | p.P77Q | P05106 | protein_coding | tolerated(0.59) | benign(0.003) | TCGA-A7-A6VY-01 | Breast | breast invasive carcinoma | Female | <65 | I/II | Chemotherapy | cyclophosphamide | CR |
| ITGB3 | SNV | Missense_Mutation | c.1789N>G | p.Asn597Asp | p.N597D | P05106 | protein_coding | tolerated(1) | benign(0.029) | TCGA-AR-A24H-01 | Breast | breast invasive carcinoma | Female | >=65 | I/II | Hormone Therapy | tamoxiphen | SD | |
| ITGB3 | SNV | Missense_Mutation | c.1094A>G | p.Asn365Ser | p.N365S | P05106 | protein_coding | deleterious(0.01) | benign(0.122) | TCGA-B6-A0X0-01 | Breast | breast invasive carcinoma | Female | <65 | I/II | Unknown | Unknown | SD | |
| ITGB3 | SNV | Missense_Mutation | c.304N>A | p.Asp102Asn | p.D102N | P05106 | protein_coding | tolerated(0.71) | benign(0.034) | TCGA-BH-A0B8-01 | Breast | breast invasive carcinoma | Female | <65 | I/II | Hormone Therapy | arimidex | SD | |
| ITGB3 | insertion | Frame_Shift_Ins | novel | c.2216_2217insATTT | p.Ile740PhefsTer17 | p.I740Ffs*17 | P05106 | protein_coding | TCGA-A8-A06U-01 | Breast | breast invasive carcinoma | Female | >=65 | I/II | Unknown | Unknown | SD | ||
| ITGB3 | insertion | Nonsense_Mutation | novel | c.2217_2218insTCTCTTTCTTTCTTTTGAG | p.Ile740SerfsTer6 | p.I740Sfs*6 | P05106 | protein_coding | TCGA-A8-A06U-01 | Breast | breast invasive carcinoma | Female | >=65 | I/II | Unknown | Unknown | SD | ||
| ITGB3 | insertion | Frame_Shift_Ins | novel | c.1473_1474insG | p.Trp492ValfsTer7 | p.W492Vfs*7 | P05106 | protein_coding | TCGA-AN-A04A-01 | Breast | breast invasive carcinoma | Female | <65 | III/IV | Unknown | Unknown | SD | ||
| ITGB3 | insertion | Frame_Shift_Ins | novel | c.1476_1477insTGGAAAATAGTGCTTTGTGCATCTTG | p.Leu493TrpfsTer185 | p.L493Wfs*185 | P05106 | protein_coding | TCGA-AN-A04A-01 | Breast | breast invasive carcinoma | Female | <65 | III/IV | Unknown | Unknown | SD | ||
| ITGB3 | deletion | Frame_Shift_Del | novel | c.1782delN | p.Met594IlefsTer75 | p.M594Ifs*75 | P05106 | protein_coding | TCGA-D8-A27V-01 | Breast | breast invasive carcinoma | Female | <65 | I/II | Hormone Therapy | tamoxiphen | SD | ||
| ITGB3 | insertion | Frame_Shift_Ins | novel | c.2352_2355dupGTAC | p.Arg786ValfsTer81 | p.R786Vfs*81 | P05106 | protein_coding | TCGA-E2-A1LE-01 | Breast | breast invasive carcinoma | Female | >=65 | III/IV | Chemotherapy | herceptin | PD |
| Page: 1 2 3 4 5 6 7 8 9 10 |
Top |
Related drugs of malignant transformation related genes |
| Identification of chemicals and drugs interact with genes involved in malignant transfromation |
| (DGIdb 4.0) |
| Entrez ID | Symbol | Category | Interaction Types | Drug Claim Name | Drug Name | PMIDs |
| 3690 | ITGB3 | DRUGGABLE GENOME, CELL SURFACE | abciximab | ABCIXIMAB | 20938371 | |
| 3690 | ITGB3 | DRUGGABLE GENOME, CELL SURFACE | EPTIFIBATIDE | EPTIFIBATIDE | ||
| 3690 | ITGB3 | DRUGGABLE GENOME, CELL SURFACE | antagonist | CHEMBL1743014 | ETARACIZUMAB | |
| 3690 | ITGB3 | DRUGGABLE GENOME, CELL SURFACE | GANTOFIBAN | GANTOFIBAN | ||
| 3690 | ITGB3 | DRUGGABLE GENOME, CELL SURFACE | GLPG0187 | GLPG-0187 | ||
| 3690 | ITGB3 | DRUGGABLE GENOME, CELL SURFACE | aspirin | ASPIRIN | 17184645,16458133,16675000,11723016,16493486,10704169,11054089,15840736,10459913,16153930,23834376,22028352,20138334,16581111 | |
| 3690 | ITGB3 | DRUGGABLE GENOME, CELL SURFACE | TIROFIBAN | TIROFIBAN | ||
| 3690 | ITGB3 | DRUGGABLE GENOME, CELL SURFACE | EPTIFIBATIDE | EPTIFIBATIDE | ||
| 3690 | ITGB3 | DRUGGABLE GENOME, CELL SURFACE | CILENGITIDE | CILENGITIDE | 24095096 | |
| 3690 | ITGB3 | DRUGGABLE GENOME, CELL SURFACE | CILENGITIDE | CILENGITIDE |
| Page: 1 2 3 |

Copyright 2023-Present -The University of Texas Health Science Center at Houston |