
|
|||||
|
 | |
| |
| |
| |
| |
| |
|
Gene: ITGB1 |
Gene summary for ITGB1 |
| Gene information | Species | Human | Gene symbol | ITGB1 | Gene ID | 3688 |
| Gene name | integrin subunit beta 1 | |
| Gene Alias | CD29 | |
| Cytomap | 10p11.22 | |
| Gene Type | protein-coding | GO ID | GO:0000003 | UniProtAcc | P05556 |
Top |
Malignant transformation analysis |
| Identification of the aberrant gene expression in precancerous and cancerous lesions by comparing the gene expression of stem-like cells in diseased tissues with normal stem cells |
| Entrez ID | Symbol | Replicates | Species | Organ | Tissue | Adj P-value | Log2FC | Malignancy |
| 3688 | ITGB1 | GSM4909281 | Human | Breast | IDC | 4.34e-29 | 6.91e-01 | 0.21 |
| 3688 | ITGB1 | GSM4909286 | Human | Breast | IDC | 6.17e-05 | -1.13e-01 | 0.1081 |
| 3688 | ITGB1 | GSM4909293 | Human | Breast | IDC | 6.18e-09 | 3.95e-01 | 0.1581 |
| 3688 | ITGB1 | GSM4909294 | Human | Breast | IDC | 2.40e-05 | -3.46e-01 | 0.2022 |
| 3688 | ITGB1 | GSM4909296 | Human | Breast | IDC | 8.97e-15 | -3.18e-01 | 0.1524 |
| 3688 | ITGB1 | GSM4909297 | Human | Breast | IDC | 5.97e-15 | -3.30e-01 | 0.1517 |
| 3688 | ITGB1 | GSM4909298 | Human | Breast | IDC | 8.01e-04 | -2.71e-01 | 0.1551 |
| 3688 | ITGB1 | GSM4909311 | Human | Breast | IDC | 7.38e-35 | -4.57e-01 | 0.1534 |
| 3688 | ITGB1 | GSM4909312 | Human | Breast | IDC | 1.47e-15 | -3.02e-01 | 0.1552 |
| 3688 | ITGB1 | GSM4909318 | Human | Breast | IDC | 3.64e-04 | -6.36e-01 | 0.2031 |
| 3688 | ITGB1 | GSM4909319 | Human | Breast | IDC | 4.41e-39 | -5.50e-01 | 0.1563 |
| 3688 | ITGB1 | GSM4909320 | Human | Breast | IDC | 1.21e-02 | -2.71e-01 | 0.1575 |
| 3688 | ITGB1 | GSM4909321 | Human | Breast | IDC | 1.89e-20 | -4.32e-01 | 0.1559 |
| 3688 | ITGB1 | brca3 | Human | Breast | Precancer | 1.26e-12 | 3.61e-01 | -0.0263 |
| 3688 | ITGB1 | NCCBC14 | Human | Breast | DCIS | 7.87e-14 | -9.36e-02 | 0.2021 |
| 3688 | ITGB1 | NCCBC5 | Human | Breast | DCIS | 3.33e-19 | -5.30e-01 | 0.2046 |
| 3688 | ITGB1 | P1 | Human | Breast | IDC | 1.28e-16 | -2.56e-01 | 0.1527 |
| 3688 | ITGB1 | P2 | Human | Breast | IDC | 1.55e-02 | -1.89e-01 | 0.21 |
| 3688 | ITGB1 | DCIS2 | Human | Breast | DCIS | 2.53e-43 | 4.79e-01 | 0.0085 |
| 3688 | ITGB1 | AEH-subject2 | Human | Endometrium | AEH | 1.25e-03 | -2.37e-01 | -0.2525 |
| Page: 1 2 3 4 5 6 7 8 9 10 11 12 |
| Tissue | Expression Dynamics | Abbreviation |
| Breast |  | IDC: Invasive ductal carcinoma |
| DCIS: Ductal carcinoma in situ | ||
| Precancer(BRCA1-mut): Precancerous lesion from BRCA1 mutation carriers | ||
| Endometrium | 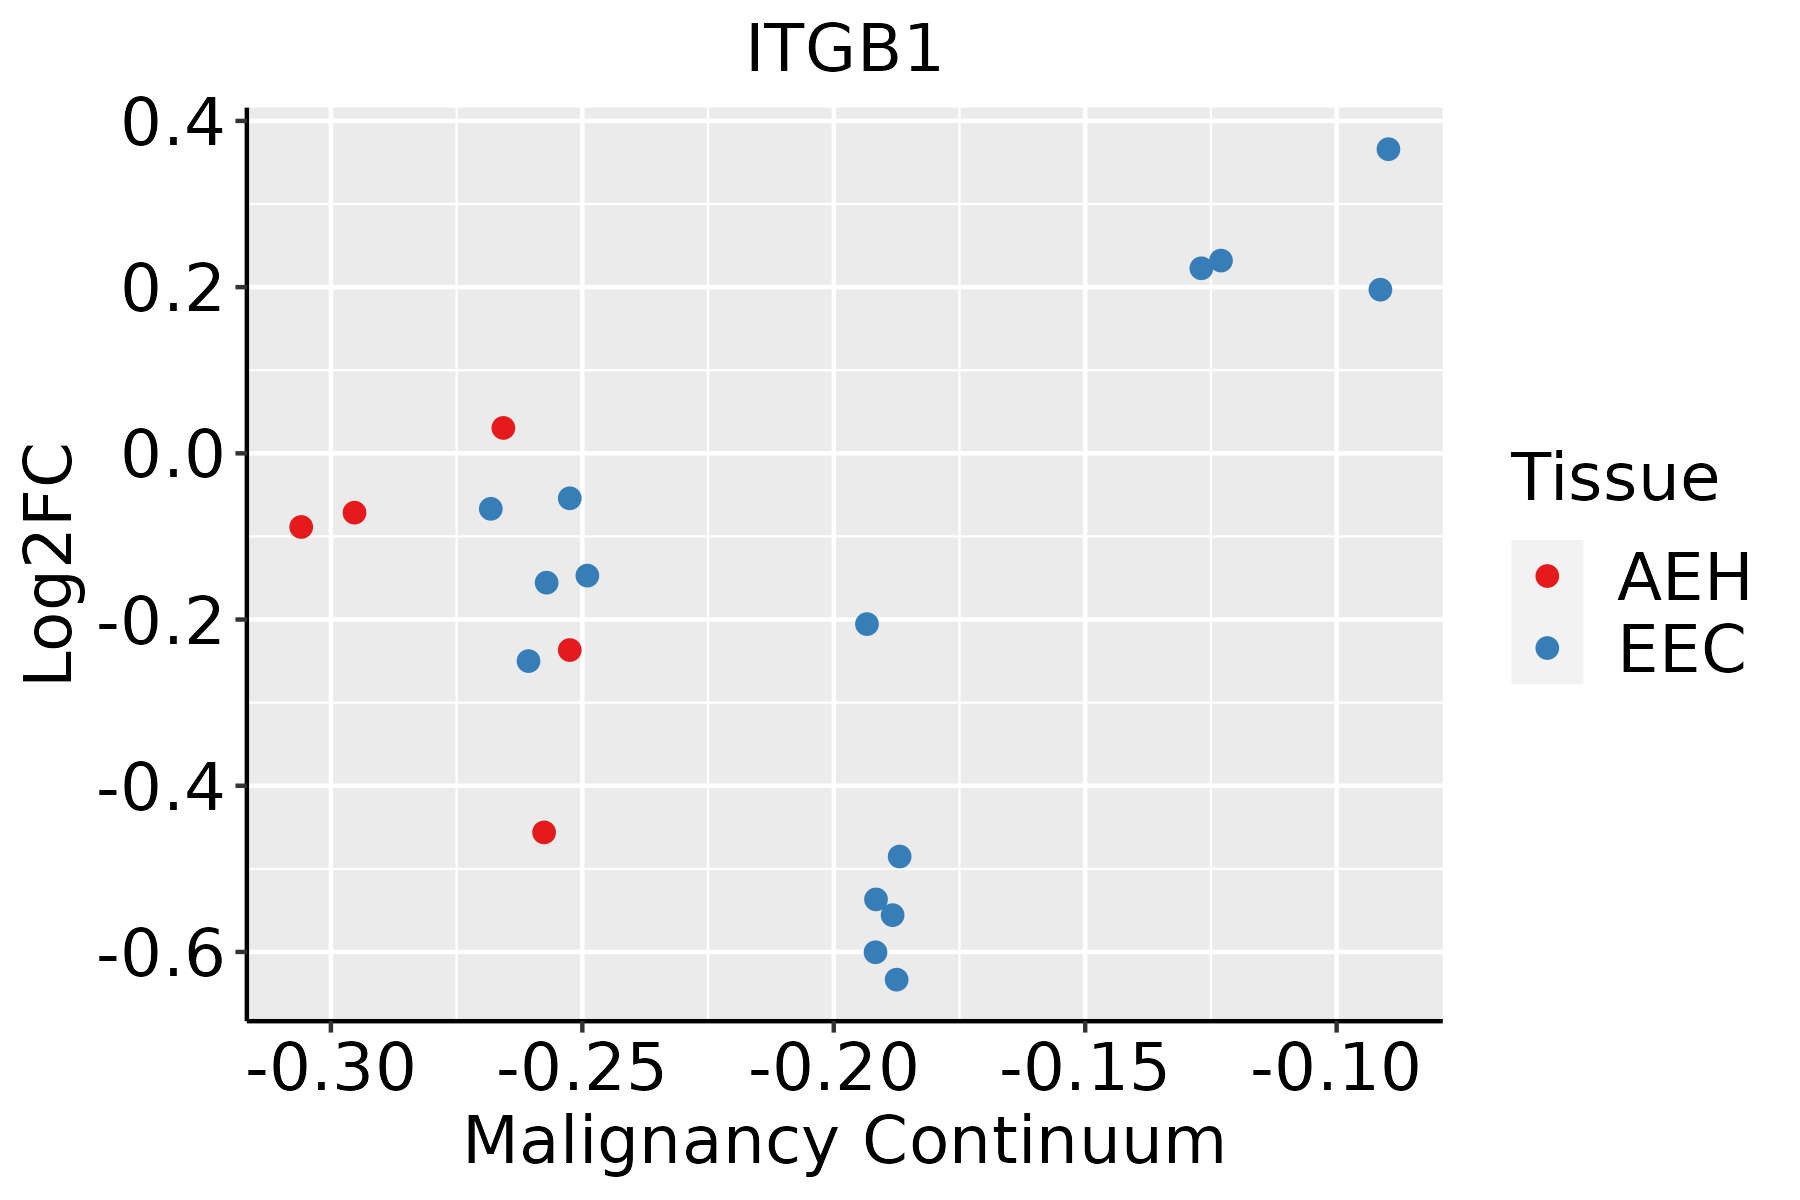 | AEH: Atypical endometrial hyperplasia |
| EEC: Endometrioid Cancer | ||
| Esophagus | 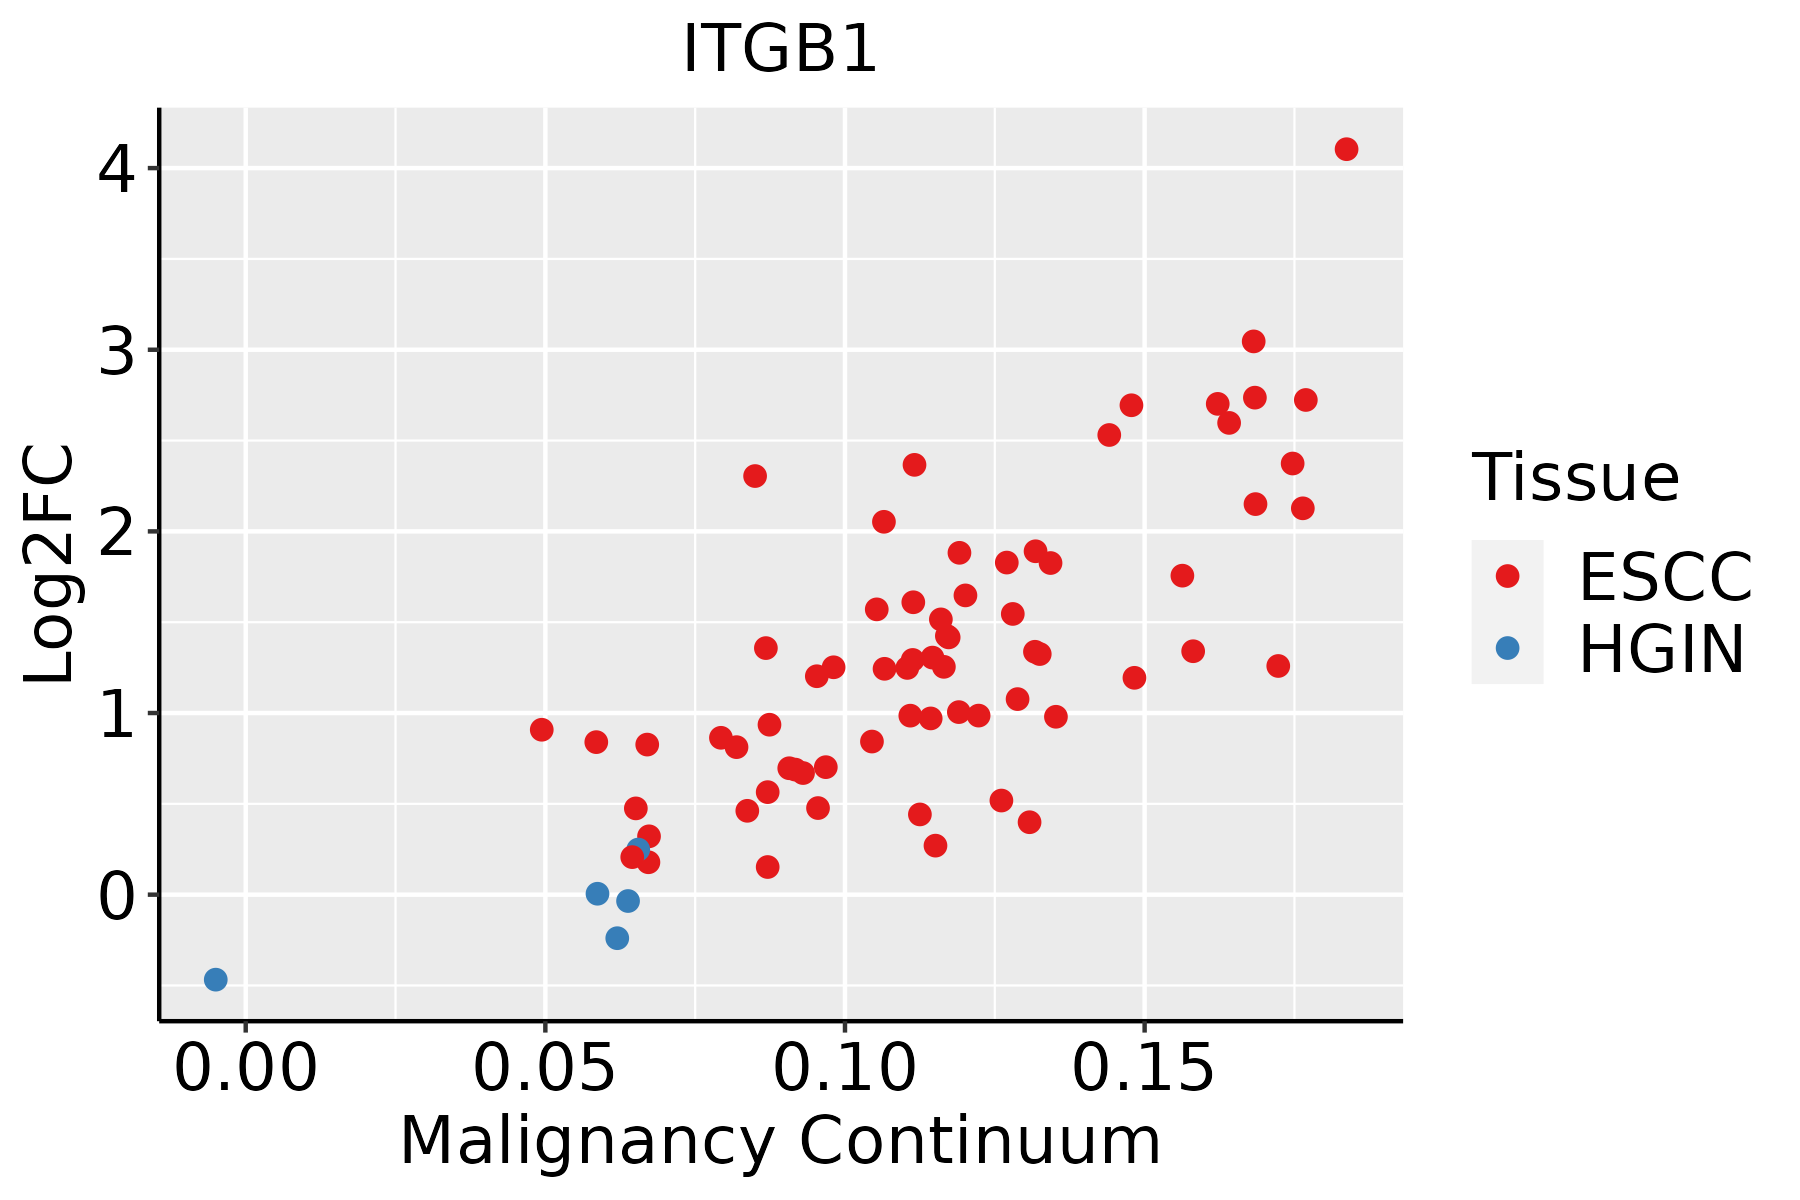 | ESCC: Esophageal squamous cell carcinoma |
| HGIN: High-grade intraepithelial neoplasias | ||
| LGIN: Low-grade intraepithelial neoplasias | ||
| GC | 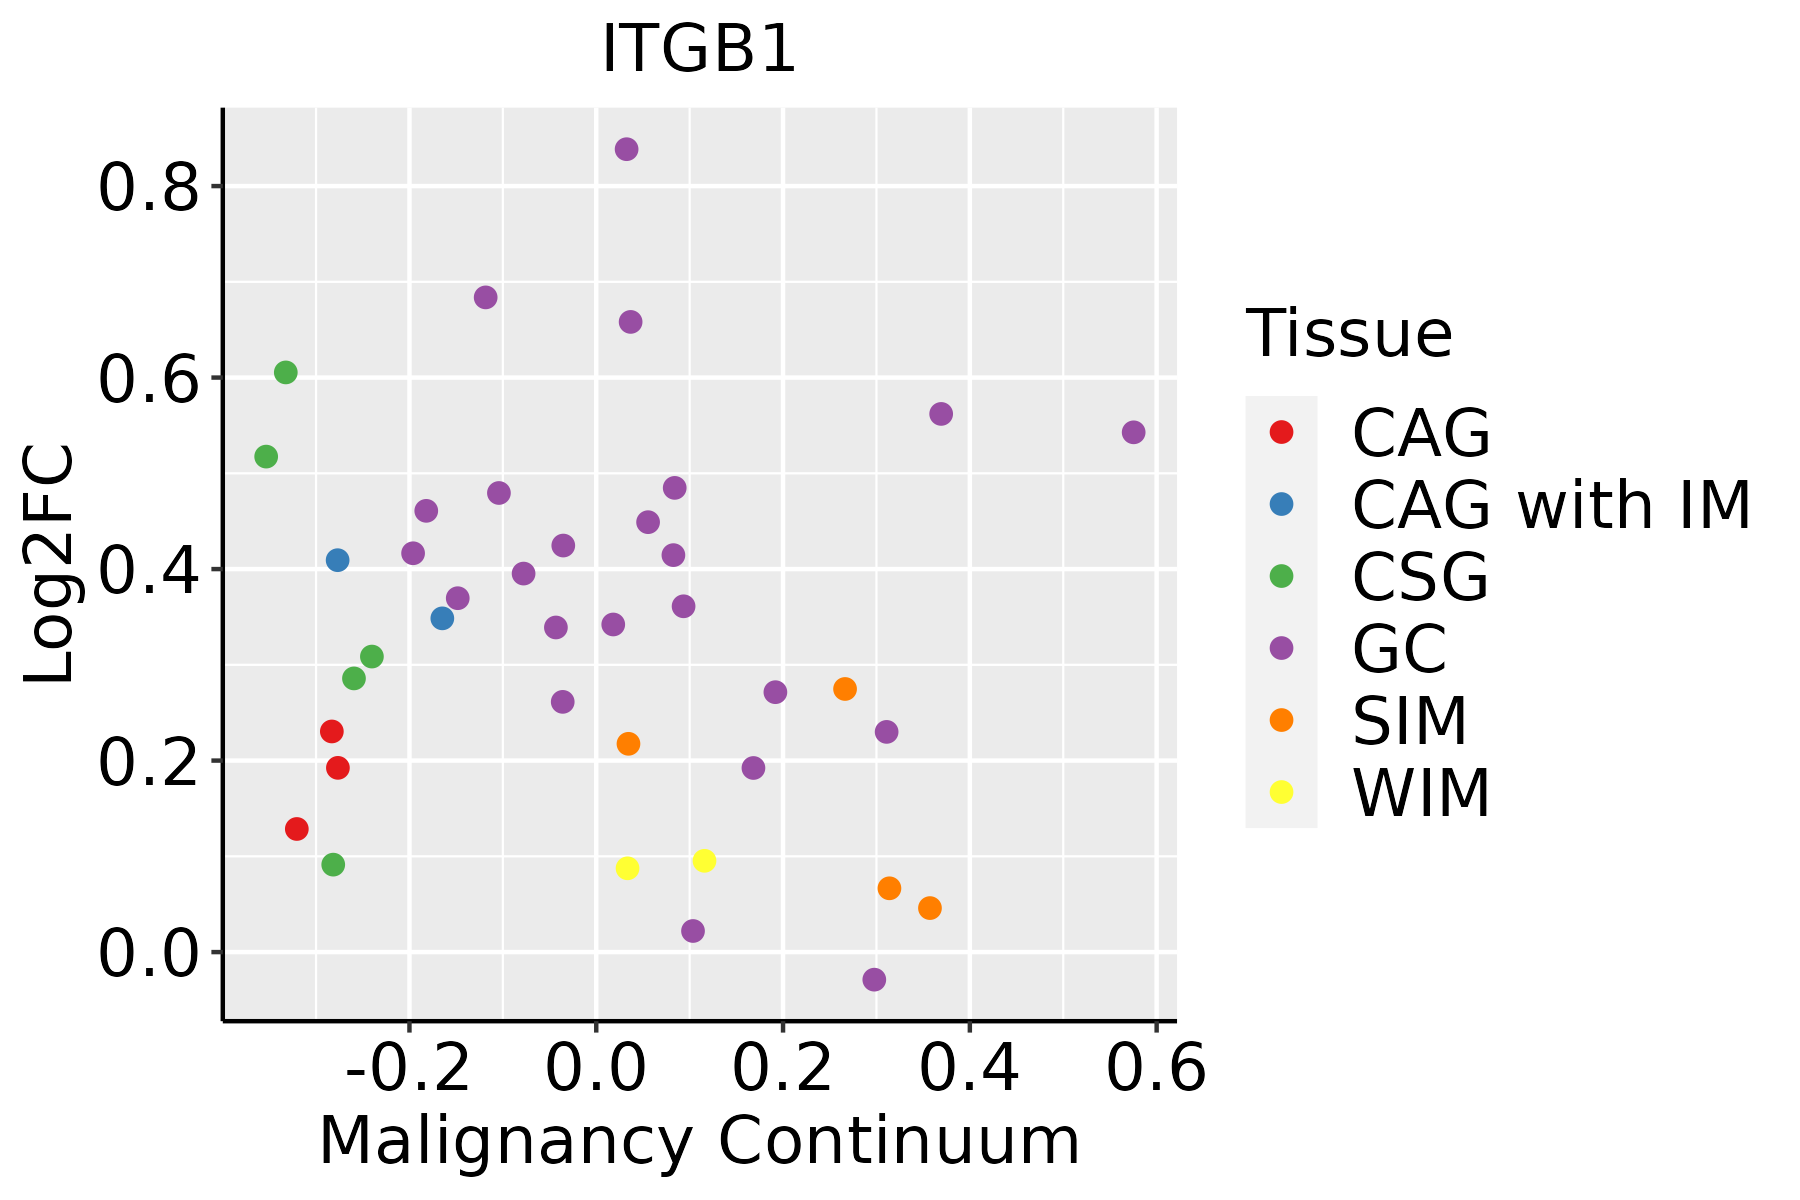 | CAG: Chronic atrophic gastritis |
| CAG with IM: Chronic atrophic gastritis with intestinal metaplasia | ||
| CSG: Chronic superficial gastritis | ||
| GC: Gastric cancer | ||
| SIM: Severe intestinal metaplasia | ||
| WIM: Wild intestinal metaplasia | ||
| Liver | 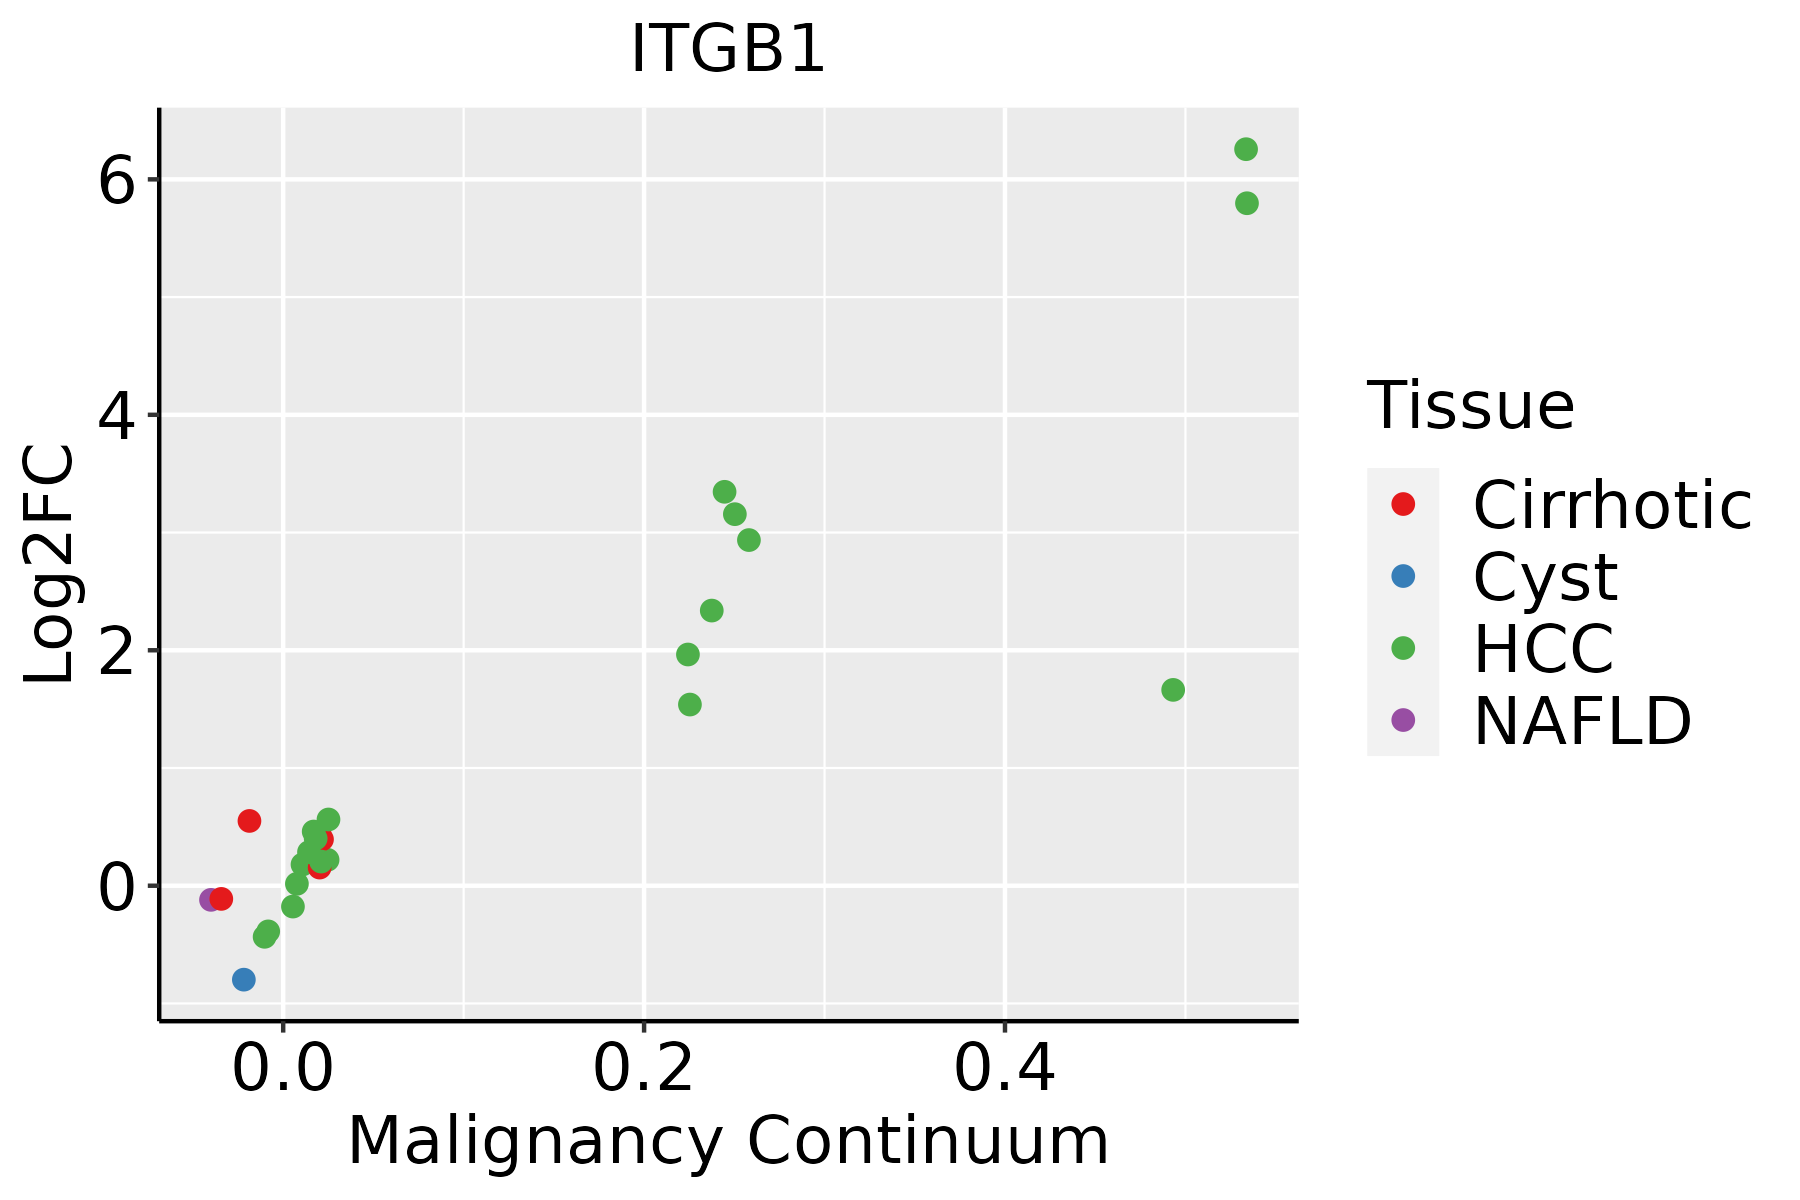 | HCC: Hepatocellular carcinoma |
| NAFLD: Non-alcoholic fatty liver disease | ||
| Lung | 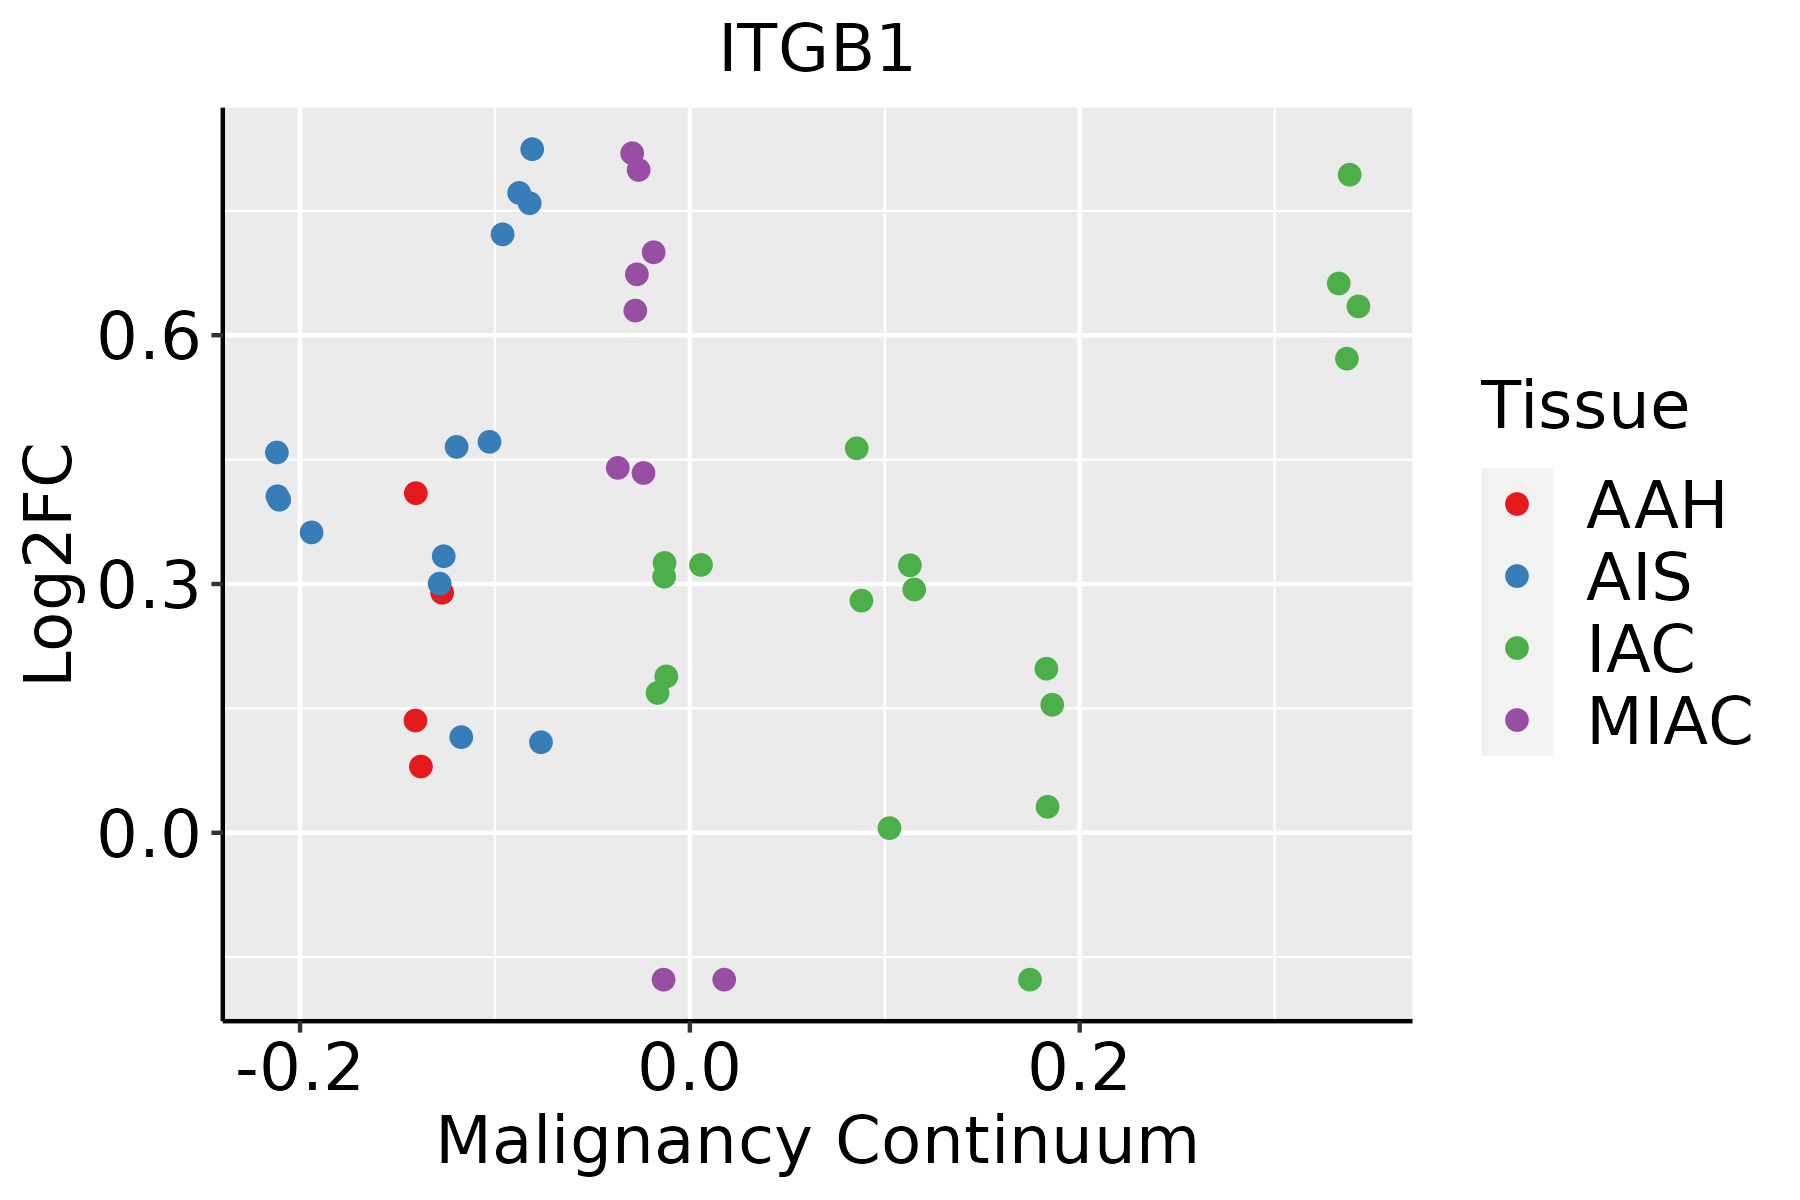 | AAH: Atypical adenomatous hyperplasia |
| AIS: Adenocarcinoma in situ | ||
| IAC: Invasive lung adenocarcinoma | ||
| MIA: Minimally invasive adenocarcinoma | ||
| Oral Cavity | 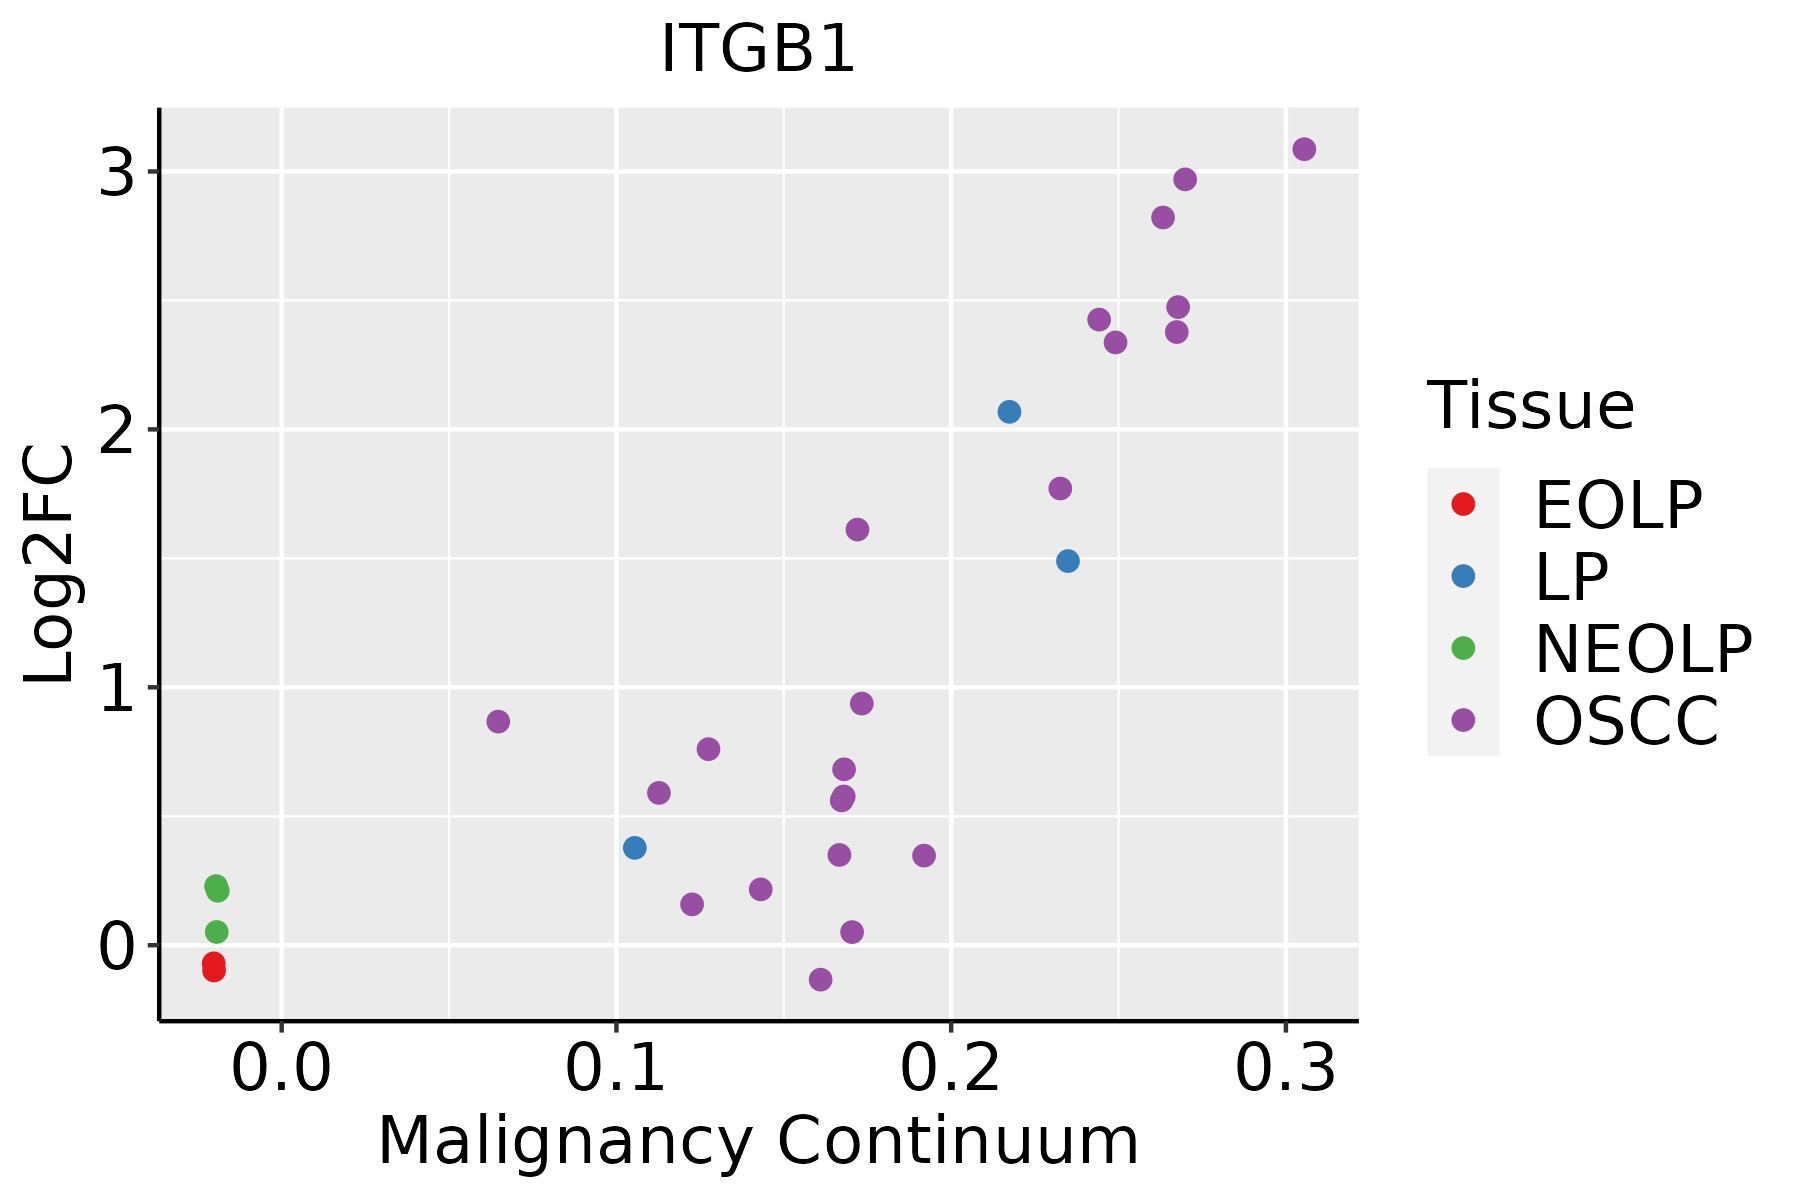 | EOLP: Erosive Oral lichen planus |
| LP: leukoplakia | ||
| NEOLP: Non-erosive oral lichen planus | ||
| OSCC: Oral squamous cell carcinoma | ||
| Prostate |  | BPH: Benign Prostatic Hyperplasia |
| Skin | 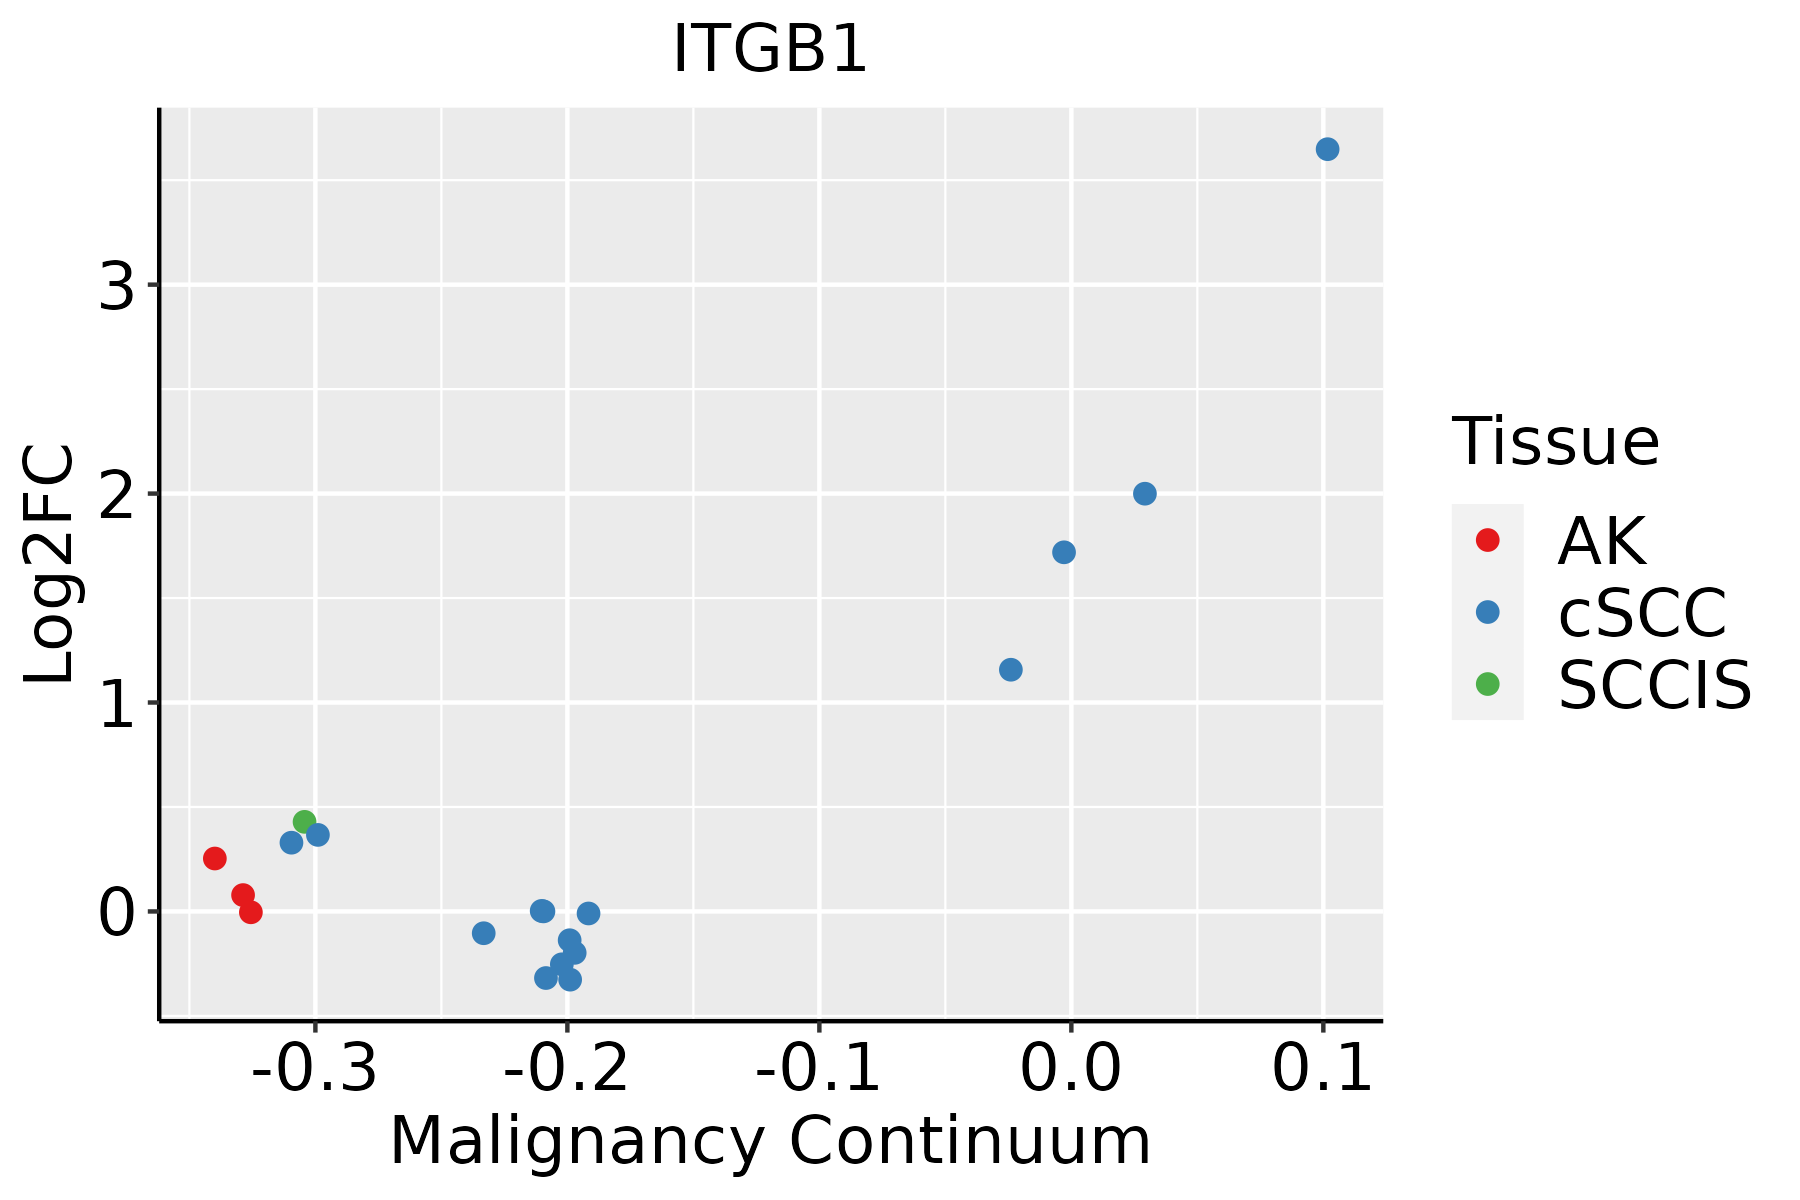 | AK: Actinic keratosis |
| cSCC: Cutaneous squamous cell carcinoma | ||
| SCCIS:squamous cell carcinoma in situ | ||
| Thyroid | 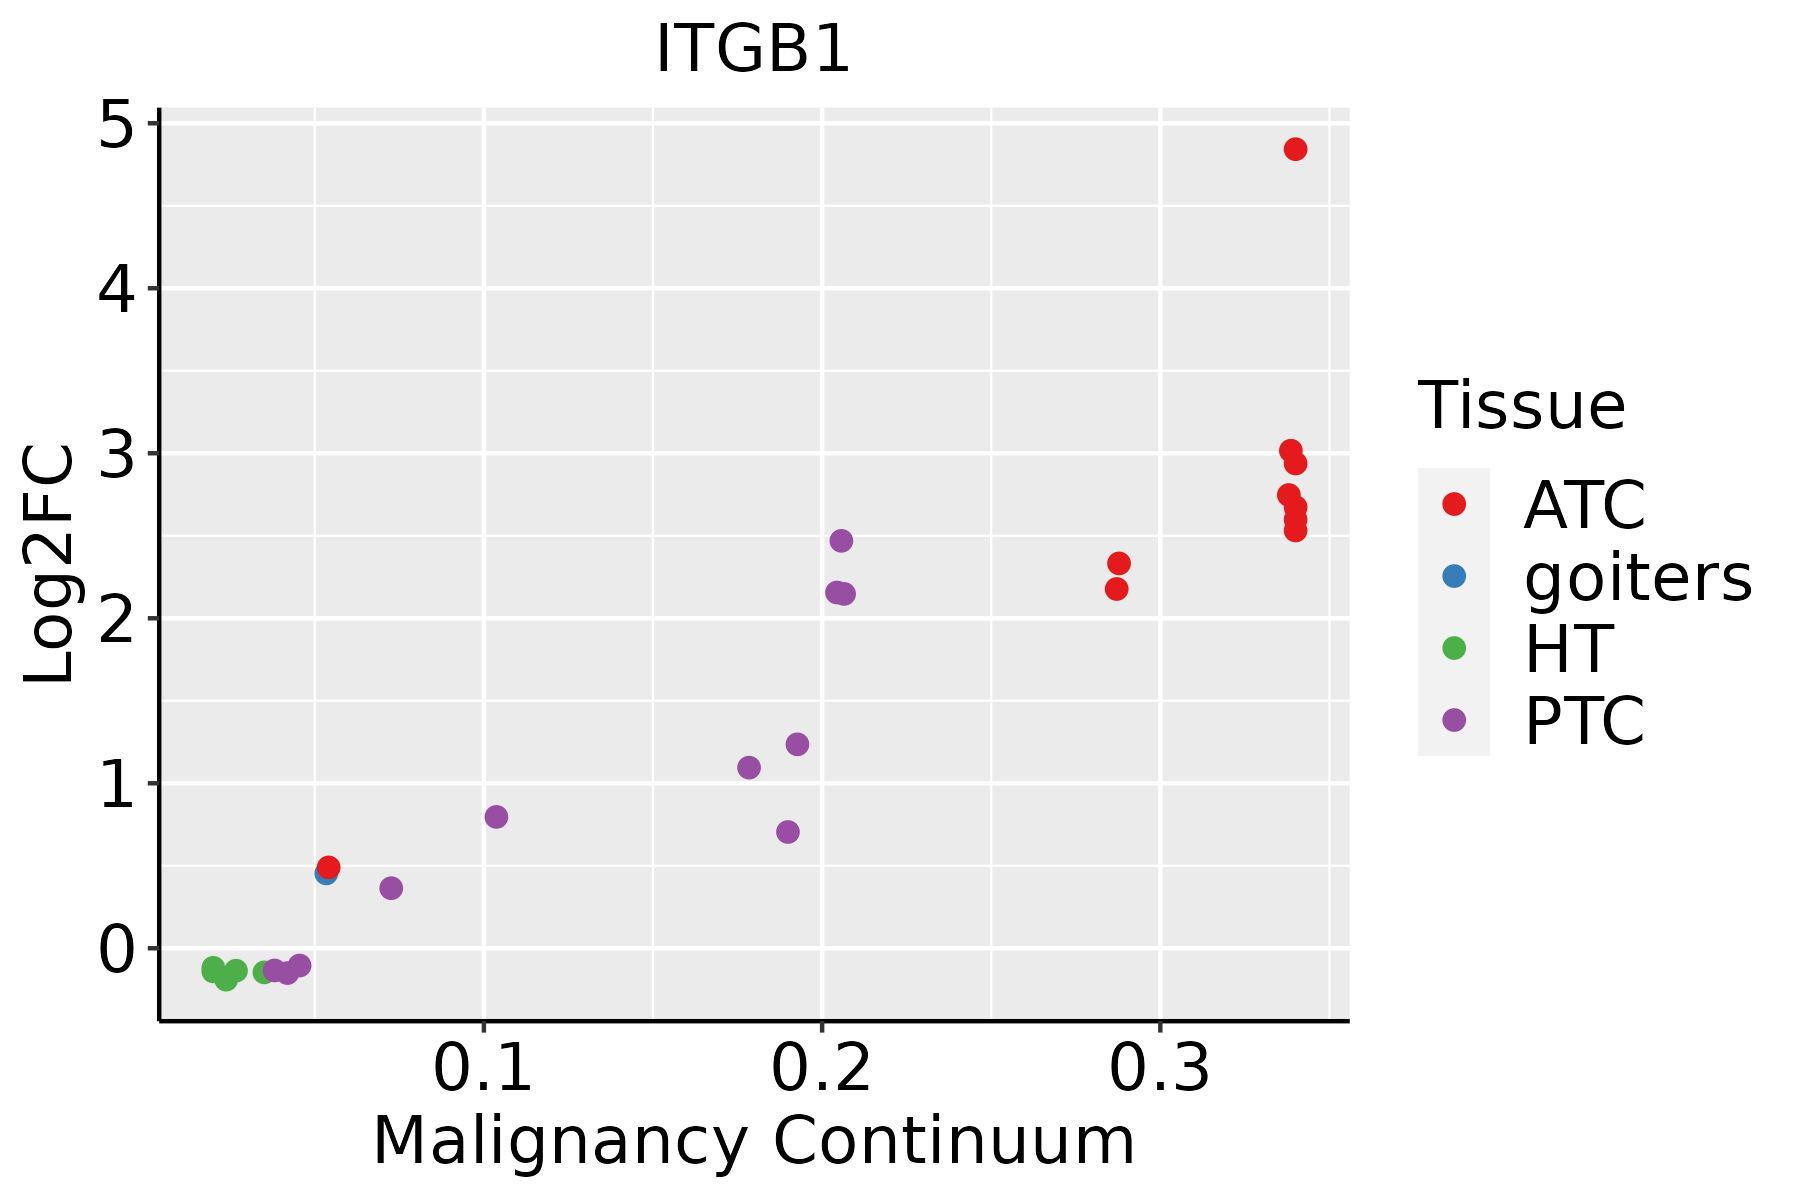 | ATC: Anaplastic thyroid cancer |
| HT: Hashimoto's thyroiditis | ||
| PTC: Papillary thyroid cancer |
| ∗log2FC in expression of this searched gene in stem-like cells from each diseased tissue sample relative to stem-like cells in normal samples in each tissue plotted against the malignancy continuum. Samples are colored based on if they are from different disease stage. |
Top |
Malignant transformation related pathway analysis |
| Find out the enriched GO biological processes and KEGG pathways involved in transition from healthy to precancer to cancer |
| Tissue | Disease Stage | Enriched GO biological Processes |
| Colorectum | AD |  |
| Colorectum | SER |  |
| Colorectum | MSS |  |
| Colorectum | MSI-H |  |
| Colorectum | FAP |  |
| ∗Top 15 enriched GO BP terms are showed in the bar plot of each disease state in each tissue. Each row represents a significant GO biological process which is colored according to the -log10(p.adjust). |
| Page: 1 2 3 4 5 6 7 8 9 |
| GO ID | Tissue | Disease Stage | Description | Gene Ratio | Bg Ratio | pvalue | p.adjust | Count |
| GO:00160329 | Breast | Precancer | viral process | 58/1080 | 415/18723 | 3.42e-10 | 3.16e-08 | 58 |
| GO:00190589 | Breast | Precancer | viral life cycle | 47/1080 | 317/18723 | 2.42e-09 | 1.99e-07 | 47 |
| GO:00444039 | Breast | Precancer | biological process involved in symbiotic interaction | 42/1080 | 290/18723 | 3.40e-08 | 2.11e-06 | 42 |
| GO:00521269 | Breast | Precancer | movement in host environment | 29/1080 | 175/18723 | 2.59e-07 | 1.28e-05 | 29 |
| GO:00509006 | Breast | Precancer | leukocyte migration | 47/1080 | 369/18723 | 2.82e-07 | 1.39e-05 | 47 |
| GO:00517019 | Breast | Precancer | biological process involved in interaction with host | 31/1080 | 203/18723 | 6.52e-07 | 2.71e-05 | 31 |
| GO:00444099 | Breast | Precancer | entry into host | 25/1080 | 151/18723 | 1.74e-06 | 6.19e-05 | 25 |
| GO:00467189 | Breast | Precancer | viral entry into host cell | 24/1080 | 144/18723 | 2.46e-06 | 8.35e-05 | 24 |
| GO:00420609 | Breast | Precancer | wound healing | 48/1080 | 422/18723 | 5.48e-06 | 1.63e-04 | 48 |
| GO:00106319 | Breast | Precancer | epithelial cell migration | 40/1080 | 357/18723 | 4.57e-05 | 9.71e-04 | 40 |
| GO:00901329 | Breast | Precancer | epithelium migration | 40/1080 | 360/18723 | 5.51e-05 | 1.14e-03 | 40 |
| GO:00435426 | Breast | Precancer | endothelial cell migration | 33/1080 | 279/18723 | 7.28e-05 | 1.44e-03 | 33 |
| GO:00901309 | Breast | Precancer | tissue migration | 40/1080 | 365/18723 | 7.48e-05 | 1.47e-03 | 40 |
| GO:00093148 | Breast | Precancer | response to radiation | 47/1080 | 456/18723 | 8.39e-05 | 1.62e-03 | 47 |
| GO:00071597 | Breast | Precancer | leukocyte cell-cell adhesion | 40/1080 | 371/18723 | 1.07e-04 | 1.94e-03 | 40 |
| GO:00016678 | Breast | Precancer | ameboidal-type cell migration | 47/1080 | 475/18723 | 2.19e-04 | 3.35e-03 | 47 |
| GO:19031313 | Breast | Precancer | mononuclear cell differentiation | 43/1080 | 426/18723 | 2.61e-04 | 3.84e-03 | 43 |
| GO:0045766 | Breast | Precancer | positive regulation of angiogenesis | 23/1080 | 181/18723 | 3.09e-04 | 4.43e-03 | 23 |
| GO:1904018 | Breast | Precancer | positive regulation of vasculature development | 23/1080 | 181/18723 | 3.09e-04 | 4.43e-03 | 23 |
| GO:00160497 | Breast | Precancer | cell growth | 46/1080 | 482/18723 | 5.63e-04 | 7.16e-03 | 46 |
| Page: 1 2 3 4 5 6 7 8 9 10 11 12 13 14 15 16 17 18 19 20 21 22 23 24 25 26 27 28 29 30 31 32 33 34 35 36 37 38 39 40 41 42 43 44 45 46 47 48 49 50 51 52 53 54 55 56 57 58 59 60 61 62 63 64 65 66 67 68 69 70 71 72 73 74 75 76 77 78 79 80 81 82 83 84 85 86 87 88 89 90 91 92 93 94 95 96 97 98 99 100 101 102 103 104 105 106 107 108 109 110 111 112 113 114 115 116 |
| Pathway ID | Tissue | Disease Stage | Description | Gene Ratio | Bg Ratio | pvalue | p.adjust | qvalue | Count |
| hsa0513118 | Breast | Precancer | Shigellosis | 44/684 | 247/8465 | 3.91e-07 | 6.86e-06 | 5.26e-06 | 44 |
| hsa0453018 | Breast | Precancer | Tight junction | 31/684 | 169/8465 | 1.13e-05 | 1.26e-04 | 9.64e-05 | 31 |
| hsa0414518 | Breast | Precancer | Phagosome | 27/684 | 152/8465 | 7.37e-05 | 6.85e-04 | 5.25e-04 | 27 |
| hsa0510018 | Breast | Precancer | Bacterial invasion of epithelial cells | 16/684 | 77/8465 | 3.55e-04 | 2.80e-03 | 2.15e-03 | 16 |
| hsa0467018 | Breast | Precancer | Leukocyte transendothelial migration | 20/684 | 114/8465 | 7.26e-04 | 5.33e-03 | 4.09e-03 | 20 |
| hsa0520514 | Breast | Precancer | Proteoglycans in cancer | 30/684 | 205/8465 | 1.00e-03 | 7.18e-03 | 5.50e-03 | 30 |
| hsa0513119 | Breast | Precancer | Shigellosis | 44/684 | 247/8465 | 3.91e-07 | 6.86e-06 | 5.26e-06 | 44 |
| hsa0453019 | Breast | Precancer | Tight junction | 31/684 | 169/8465 | 1.13e-05 | 1.26e-04 | 9.64e-05 | 31 |
| hsa0414519 | Breast | Precancer | Phagosome | 27/684 | 152/8465 | 7.37e-05 | 6.85e-04 | 5.25e-04 | 27 |
| hsa0510019 | Breast | Precancer | Bacterial invasion of epithelial cells | 16/684 | 77/8465 | 3.55e-04 | 2.80e-03 | 2.15e-03 | 16 |
| hsa0467019 | Breast | Precancer | Leukocyte transendothelial migration | 20/684 | 114/8465 | 7.26e-04 | 5.33e-03 | 4.09e-03 | 20 |
| hsa0520515 | Breast | Precancer | Proteoglycans in cancer | 30/684 | 205/8465 | 1.00e-03 | 7.18e-03 | 5.50e-03 | 30 |
| hsa0453024 | Breast | IDC | Tight junction | 38/867 | 169/8465 | 2.07e-06 | 3.20e-05 | 2.39e-05 | 38 |
| hsa0513024 | Breast | IDC | Pathogenic Escherichia coli infection | 42/867 | 197/8465 | 2.66e-06 | 3.92e-05 | 2.94e-05 | 42 |
| hsa0520523 | Breast | IDC | Proteoglycans in cancer | 42/867 | 205/8465 | 7.69e-06 | 9.99e-05 | 7.48e-05 | 42 |
| hsa0414522 | Breast | IDC | Phagosome | 34/867 | 152/8465 | 8.00e-06 | 9.99e-05 | 7.48e-05 | 34 |
| hsa0513124 | Breast | IDC | Shigellosis | 47/867 | 247/8465 | 1.78e-05 | 2.00e-04 | 1.49e-04 | 47 |
| hsa0510024 | Breast | IDC | Bacterial invasion of epithelial cells | 17/867 | 77/8465 | 1.69e-03 | 1.19e-02 | 8.93e-03 | 17 |
| hsa0514012 | Breast | IDC | Leishmaniasis | 16/867 | 77/8465 | 4.35e-03 | 2.57e-02 | 1.92e-02 | 16 |
| hsa0467024 | Breast | IDC | Leukocyte transendothelial migration | 21/867 | 114/8465 | 5.41e-03 | 3.13e-02 | 2.34e-02 | 21 |
| Page: 1 2 3 4 5 6 7 8 9 10 11 12 13 14 15 16 17 18 19 20 21 22 23 24 25 26 27 |
Top |
Cell-cell communication analysis |
| Identification of potential cell-cell interactions between two cell types and their ligand-receptor pairs for different disease states |
| Ligand | Receptor | LRpair | Pathway | Tissue | Disease Stage |
| COL1A1 | ITGA1_ITGB1 | COL1A1_ITGA1_ITGB1 | COLLAGEN | Breast | ADJ |
| COL1A2 | ITGA1_ITGB1 | COL1A2_ITGA1_ITGB1 | COLLAGEN | Breast | ADJ |
| COL4A1 | ITGA1_ITGB1 | COL4A1_ITGA1_ITGB1 | COLLAGEN | Breast | ADJ |
| COL4A2 | ITGA1_ITGB1 | COL4A2_ITGA1_ITGB1 | COLLAGEN | Breast | ADJ |
| COL6A1 | ITGA1_ITGB1 | COL6A1_ITGA1_ITGB1 | COLLAGEN | Breast | ADJ |
| COL6A2 | ITGA1_ITGB1 | COL6A2_ITGA1_ITGB1 | COLLAGEN | Breast | ADJ |
| COL6A3 | ITGA1_ITGB1 | COL6A3_ITGA1_ITGB1 | COLLAGEN | Breast | ADJ |
| COL1A1 | ITGA2_ITGB1 | COL1A1_ITGA2_ITGB1 | COLLAGEN | Breast | ADJ |
| COL1A2 | ITGA2_ITGB1 | COL1A2_ITGA2_ITGB1 | COLLAGEN | Breast | ADJ |
| COL4A1 | ITGA2_ITGB1 | COL4A1_ITGA2_ITGB1 | COLLAGEN | Breast | ADJ |
| COL4A2 | ITGA2_ITGB1 | COL4A2_ITGA2_ITGB1 | COLLAGEN | Breast | ADJ |
| COL6A1 | ITGA2_ITGB1 | COL6A1_ITGA2_ITGB1 | COLLAGEN | Breast | ADJ |
| COL6A2 | ITGA2_ITGB1 | COL6A2_ITGA2_ITGB1 | COLLAGEN | Breast | ADJ |
| COL6A3 | ITGA2_ITGB1 | COL6A3_ITGA2_ITGB1 | COLLAGEN | Breast | ADJ |
| LAMA2 | ITGA1_ITGB1 | LAMA2_ITGA1_ITGB1 | LAMININ | Breast | ADJ |
| LAMA4 | ITGA1_ITGB1 | LAMA4_ITGA1_ITGB1 | LAMININ | Breast | ADJ |
| LAMB2 | ITGA1_ITGB1 | LAMB2_ITGA1_ITGB1 | LAMININ | Breast | ADJ |
| LAMB3 | ITGA1_ITGB1 | LAMB3_ITGA1_ITGB1 | LAMININ | Breast | ADJ |
| LAMC1 | ITGA1_ITGB1 | LAMC1_ITGA1_ITGB1 | LAMININ | Breast | ADJ |
| LAMC2 | ITGA1_ITGB1 | LAMC2_ITGA1_ITGB1 | LAMININ | Breast | ADJ |
| Page: 1 |
Top |
Single-cell gene regulatory network inference analysis |
| Find out the significant the regulons (TFs) and the target genes of each regulon across cell types for different disease states |
| TF | Cell Type | Tissue | Disease Stage | Target Gene | RSS | Regulon Activity |
| ∗The dot plots of a searched regulon are shown for all cell subpopulations in each disease state of each tissue based on the regulon specific score inferred using pySCENIC and by calculating the average expression. |
| Page: 1 |
Top |
Somatic mutation of malignant transformation related genes |
| Annotation of somatic variants for genes involved in malignant transformation |
| Hugo Symbol | Variant Class | Variant Classification | dbSNP RS | HGVSc | HGVSp | HGVSp Short | SWISSPROT | BIOTYPE | SIFT | PolyPhen | Tumor Sample Barcode | Tissue | Histology | Sex | Age | Stage | Therapy Types | Drugs | Outcome |
| ITGB1 | SNV | Missense_Mutation | c.2050N>G | p.Gln684Glu | p.Q684E | P05556 | protein_coding | tolerated(0.27) | benign(0.006) | TCGA-AN-A0XN-01 | Breast | breast invasive carcinoma | Female | >=65 | III/IV | Unknown | Unknown | SD | |
| ITGB1 | SNV | Missense_Mutation | c.445A>C | p.Met149Leu | p.M149L | P05556 | protein_coding | deleterious(0.03) | benign(0.398) | TCGA-BH-A0B1-01 | Breast | breast invasive carcinoma | Female | >=65 | I/II | Chemotherapy | adriamycin | SD | |
| ITGB1 | SNV | Missense_Mutation | c.826T>C | p.Phe276Leu | p.F276L | P05556 | protein_coding | tolerated(0.09) | probably_damaging(0.998) | TCGA-BH-A1F6-01 | Breast | breast invasive carcinoma | Female | <65 | III/IV | Unknown | Unknown | SD | |
| ITGB1 | SNV | Missense_Mutation | rs758287253 | c.1474N>T | p.Asn492Tyr | p.N492Y | P05556 | protein_coding | deleterious(0) | possibly_damaging(0.494) | TCGA-E2-A14S-01 | Breast | breast invasive carcinoma | Female | >=65 | I/II | Chemotherapy | cytoxan | SD |
| ITGB1 | insertion | Nonsense_Mutation | novel | c.1500_1501insCAGCTCTAATCCTCATAACAGTCCTGTGCCTAGAA | p.Glu501GlnfsTer3 | p.E501Qfs*3 | P05556 | protein_coding | TCGA-A2-A0CQ-01 | Breast | breast invasive carcinoma | Female | <65 | I/II | Chemotherapy | adriamycin | SD | ||
| ITGB1 | insertion | Nonsense_Mutation | novel | c.560_561insCTCTAGATGACCTTCTTTGATTTTAGAGGCCTCTTAGTGG | p.Val188SerfsTer3 | p.V188Sfs*3 | P05556 | protein_coding | TCGA-A2-A0EO-01 | Breast | breast invasive carcinoma | Female | <65 | I/II | Hormone Therapy | tamoxiphen | SD | ||
| ITGB1 | SNV | Missense_Mutation | novel | c.1982N>A | p.Cys661Tyr | p.C661Y | P05556 | protein_coding | deleterious(0) | probably_damaging(0.999) | TCGA-C5-A2LZ-01 | Cervix | cervical & endocervical cancer | Female | >=65 | III/IV | Unknown | Unknown | PD |
| ITGB1 | SNV | Missense_Mutation | c.337N>G | p.Gln113Glu | p.Q113E | P05556 | protein_coding | deleterious(0.01) | probably_damaging(0.989) | TCGA-IR-A3LL-01 | Cervix | cervical & endocervical cancer | Female | <65 | I/II | Chemotherapy | cisplatin | CR | |
| ITGB1 | SNV | Missense_Mutation | novel | c.1480G>C | p.Gly494Arg | p.G494R | P05556 | protein_coding | deleterious(0.01) | probably_damaging(1) | TCGA-MA-AA3Z-01 | Cervix | cervical & endocervical cancer | Female | <65 | I/II | Unknown | Unknown | SD |
| ITGB1 | SNV | Missense_Mutation | novel | c.2216N>C | p.Gly739Ala | p.G739A | P05556 | protein_coding | tolerated(0.06) | probably_damaging(0.999) | TCGA-ZJ-AAXU-01 | Cervix | cervical & endocervical cancer | Female | <65 | I/II | Unknown | Unknown | SD |
| Page: 1 2 3 4 5 6 7 8 9 |
Top |
Related drugs of malignant transformation related genes |
| Identification of chemicals and drugs interact with genes involved in malignant transfromation |
| (DGIdb 4.0) |
| Entrez ID | Symbol | Category | Interaction Types | Drug Claim Name | Drug Name | PMIDs |
| 3688 | ITGB1 | DRUGGABLE GENOME, KINASE, CELL SURFACE, TUMOR SUPPRESSOR, EXTERNAL SIDE OF PLASMA MEMBRANE | FIRATEGRAST | FIRATEGRAST | ||
| 3688 | ITGB1 | DRUGGABLE GENOME, KINASE, CELL SURFACE, TUMOR SUPPRESSOR, EXTERNAL SIDE OF PLASMA MEMBRANE | 131I-radretumab | |||
| 3688 | ITGB1 | DRUGGABLE GENOME, KINASE, CELL SURFACE, TUMOR SUPPRESSOR, EXTERNAL SIDE OF PLASMA MEMBRANE | inhibitor | CHEMBL2109621 | ABITUZUMAB | |
| 3688 | ITGB1 | DRUGGABLE GENOME, KINASE, CELL SURFACE, TUMOR SUPPRESSOR, EXTERNAL SIDE OF PLASMA MEMBRANE | antagonist | CHEMBL2108061 | VOLOCIXIMAB | |
| 3688 | ITGB1 | DRUGGABLE GENOME, KINASE, CELL SURFACE, TUMOR SUPPRESSOR, EXTERNAL SIDE OF PLASMA MEMBRANE | JSM 6427 | |||
| 3688 | ITGB1 | DRUGGABLE GENOME, KINASE, CELL SURFACE, TUMOR SUPPRESSOR, EXTERNAL SIDE OF PLASMA MEMBRANE | inhibitor | 385612210 | ||
| 3688 | ITGB1 | DRUGGABLE GENOME, KINASE, CELL SURFACE, TUMOR SUPPRESSOR, EXTERNAL SIDE OF PLASMA MEMBRANE | inhibitor | CHEMBL1201607 | NATALIZUMAB | |
| 3688 | ITGB1 | DRUGGABLE GENOME, KINASE, CELL SURFACE, TUMOR SUPPRESSOR, EXTERNAL SIDE OF PLASMA MEMBRANE | F200 | |||
| 3688 | ITGB1 | DRUGGABLE GENOME, KINASE, CELL SURFACE, TUMOR SUPPRESSOR, EXTERNAL SIDE OF PLASMA MEMBRANE | R1295 | |||
| 3688 | ITGB1 | DRUGGABLE GENOME, KINASE, CELL SURFACE, TUMOR SUPPRESSOR, EXTERNAL SIDE OF PLASMA MEMBRANE | GLPG0187 | GLPG-0187 |
| Page: 1 2 |

Copyright 2023-Present -The University of Texas Health Science Center at Houston |