| Tissue | Expression Dynamics | Abbreviation |
| Cervix | 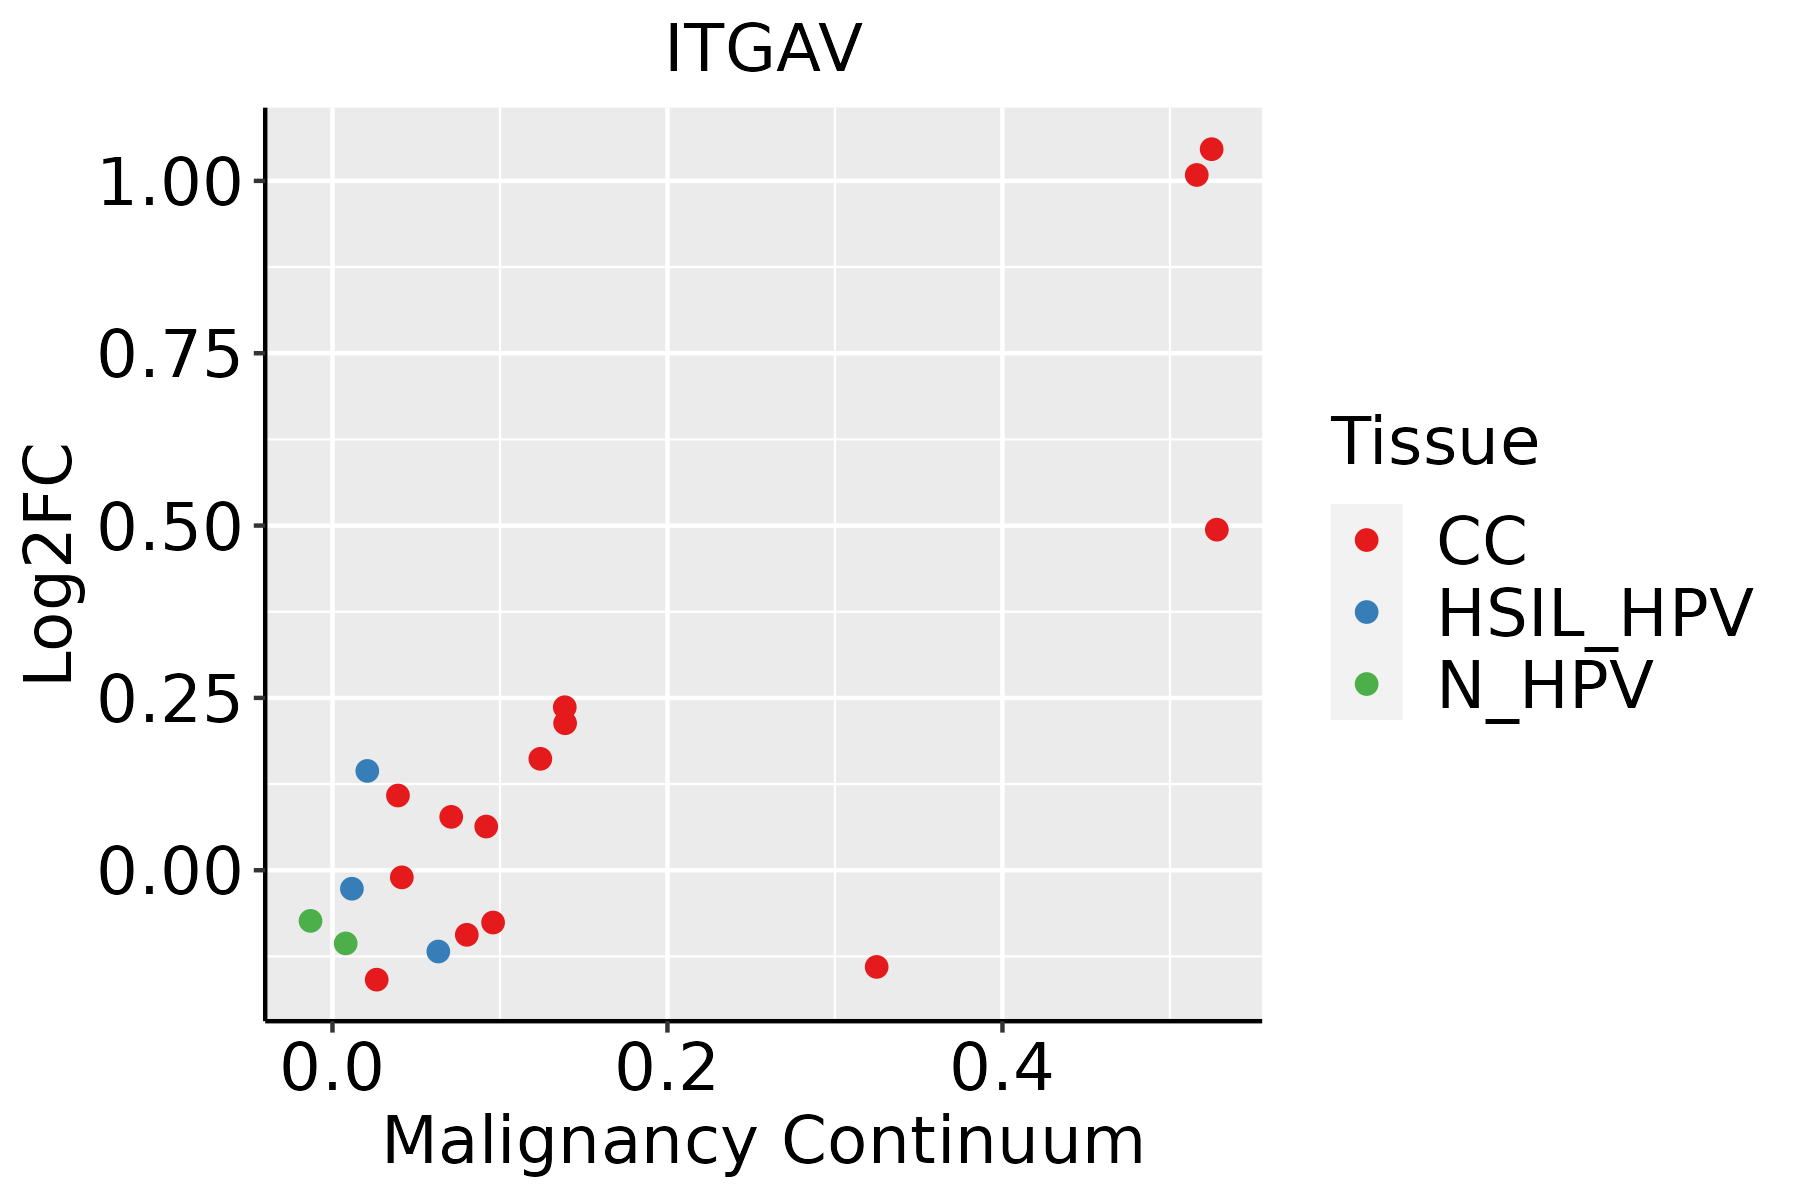 | CC: Cervix cancer |
| HSIL_HPV: HPV-infected high-grade squamous intraepithelial lesions |
| N_HPV: HPV-infected normal cervix |
| Esophagus | 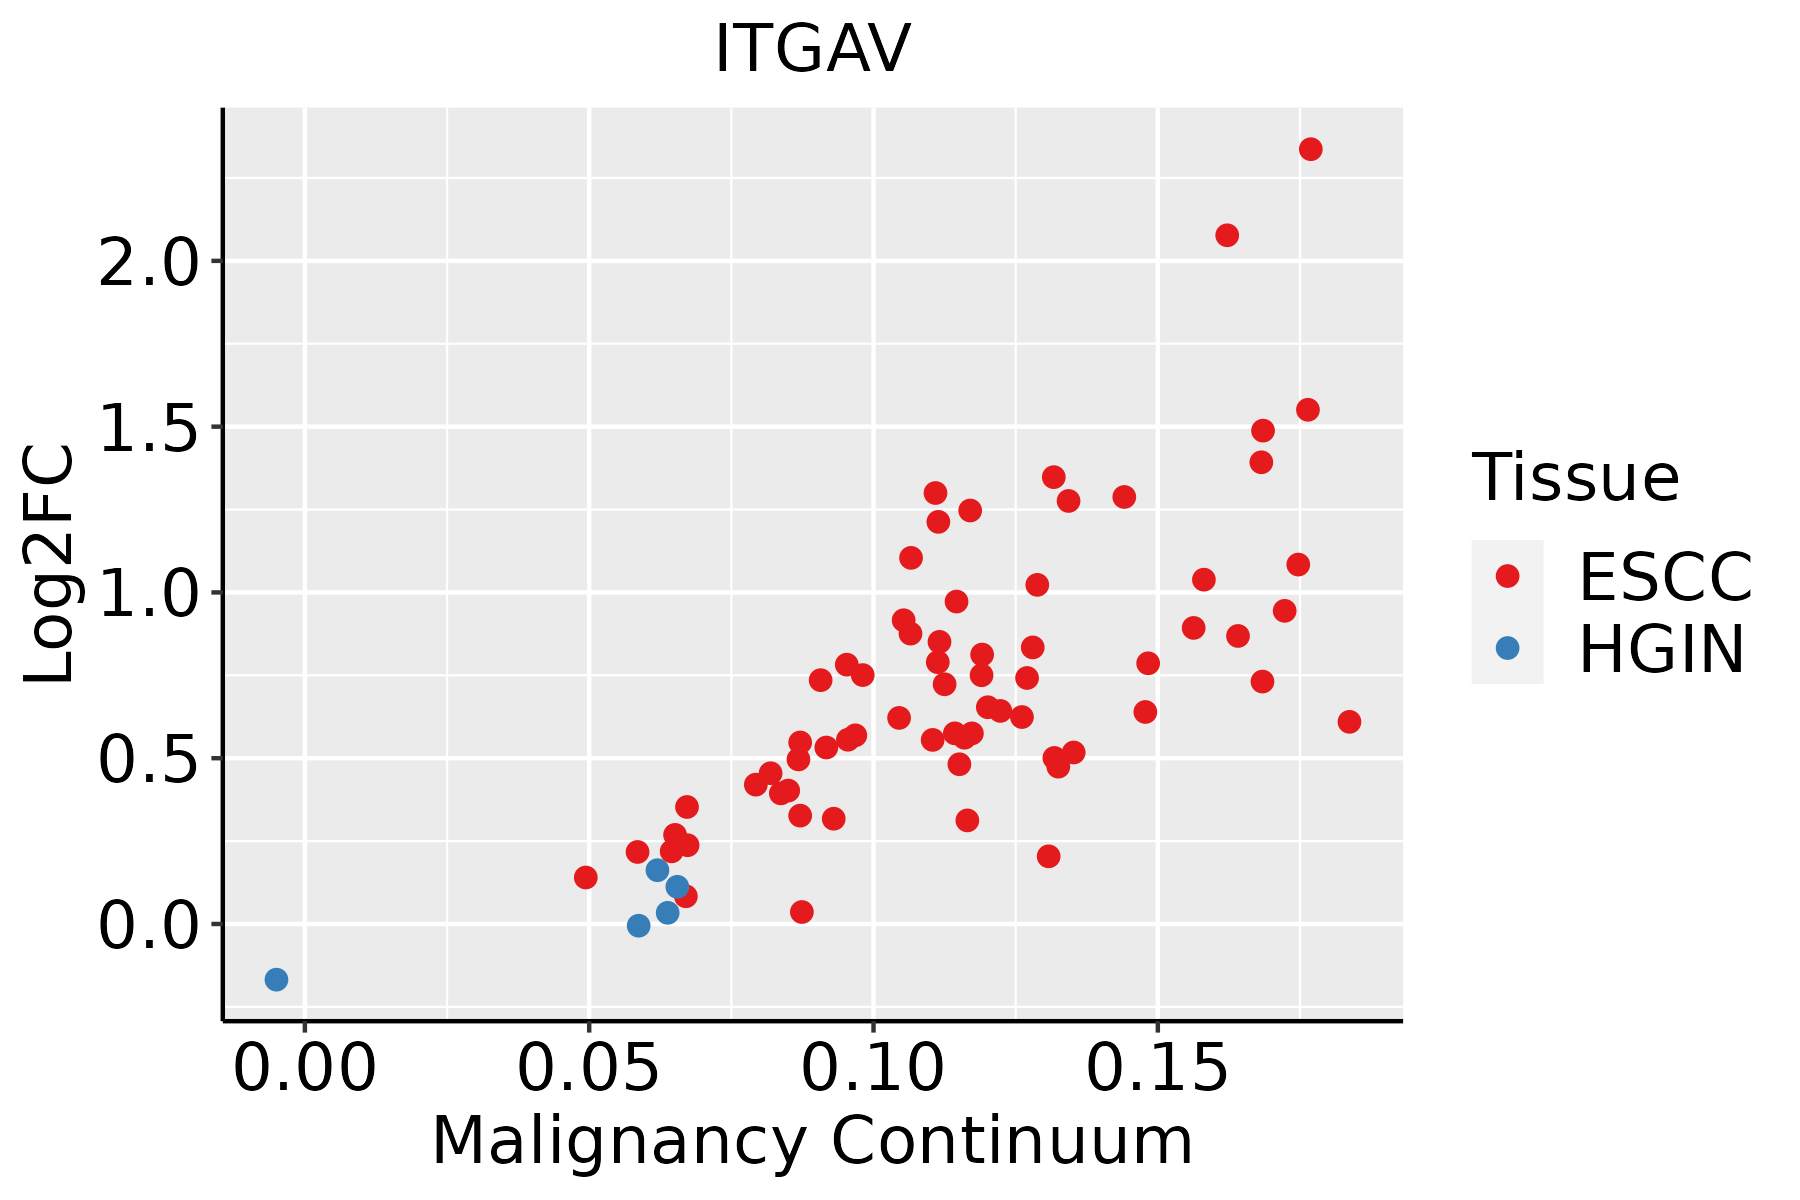 | ESCC: Esophageal squamous cell carcinoma |
| HGIN: High-grade intraepithelial neoplasias |
| LGIN: Low-grade intraepithelial neoplasias |
| Liver | 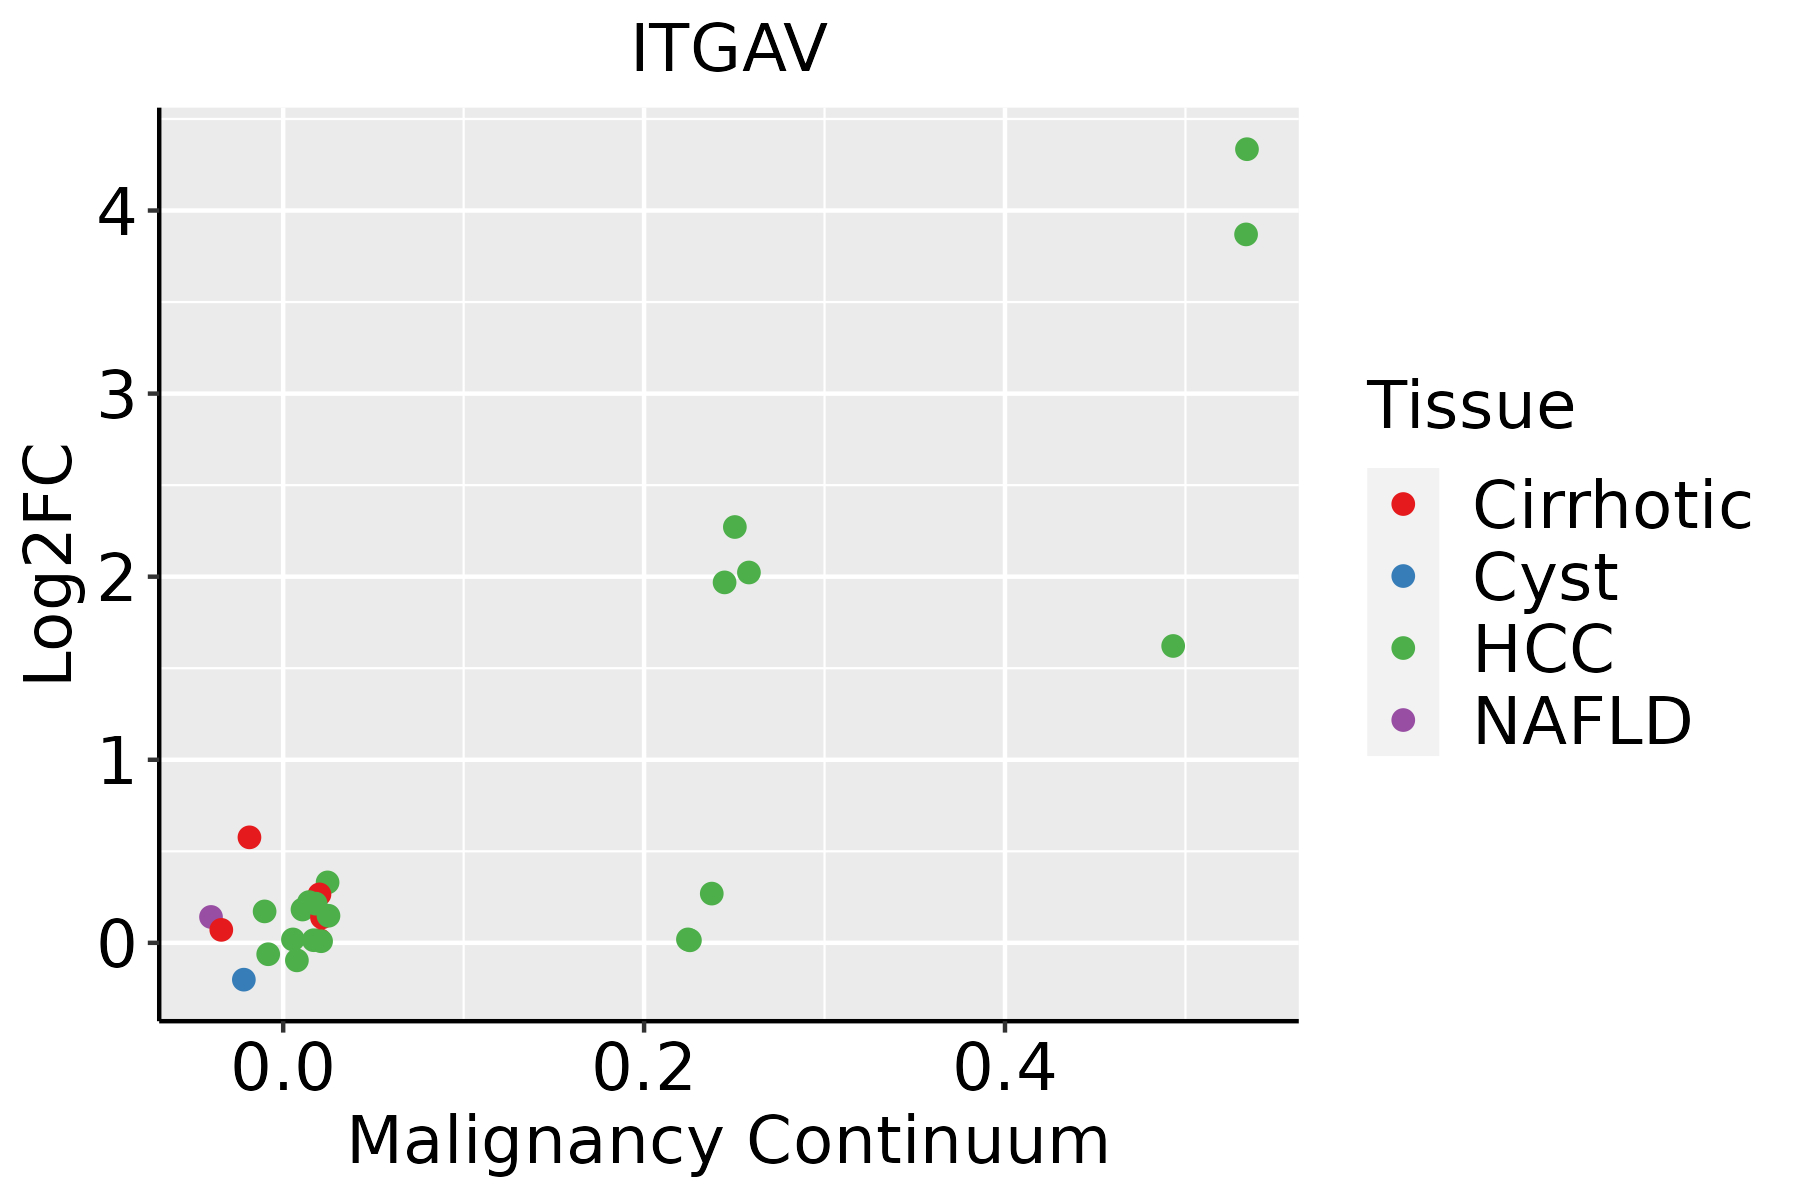 | HCC: Hepatocellular carcinoma |
| NAFLD: Non-alcoholic fatty liver disease |
| Lung |  | AAH: Atypical adenomatous hyperplasia |
| AIS: Adenocarcinoma in situ |
| IAC: Invasive lung adenocarcinoma |
| MIA: Minimally invasive adenocarcinoma |
| Oral Cavity | 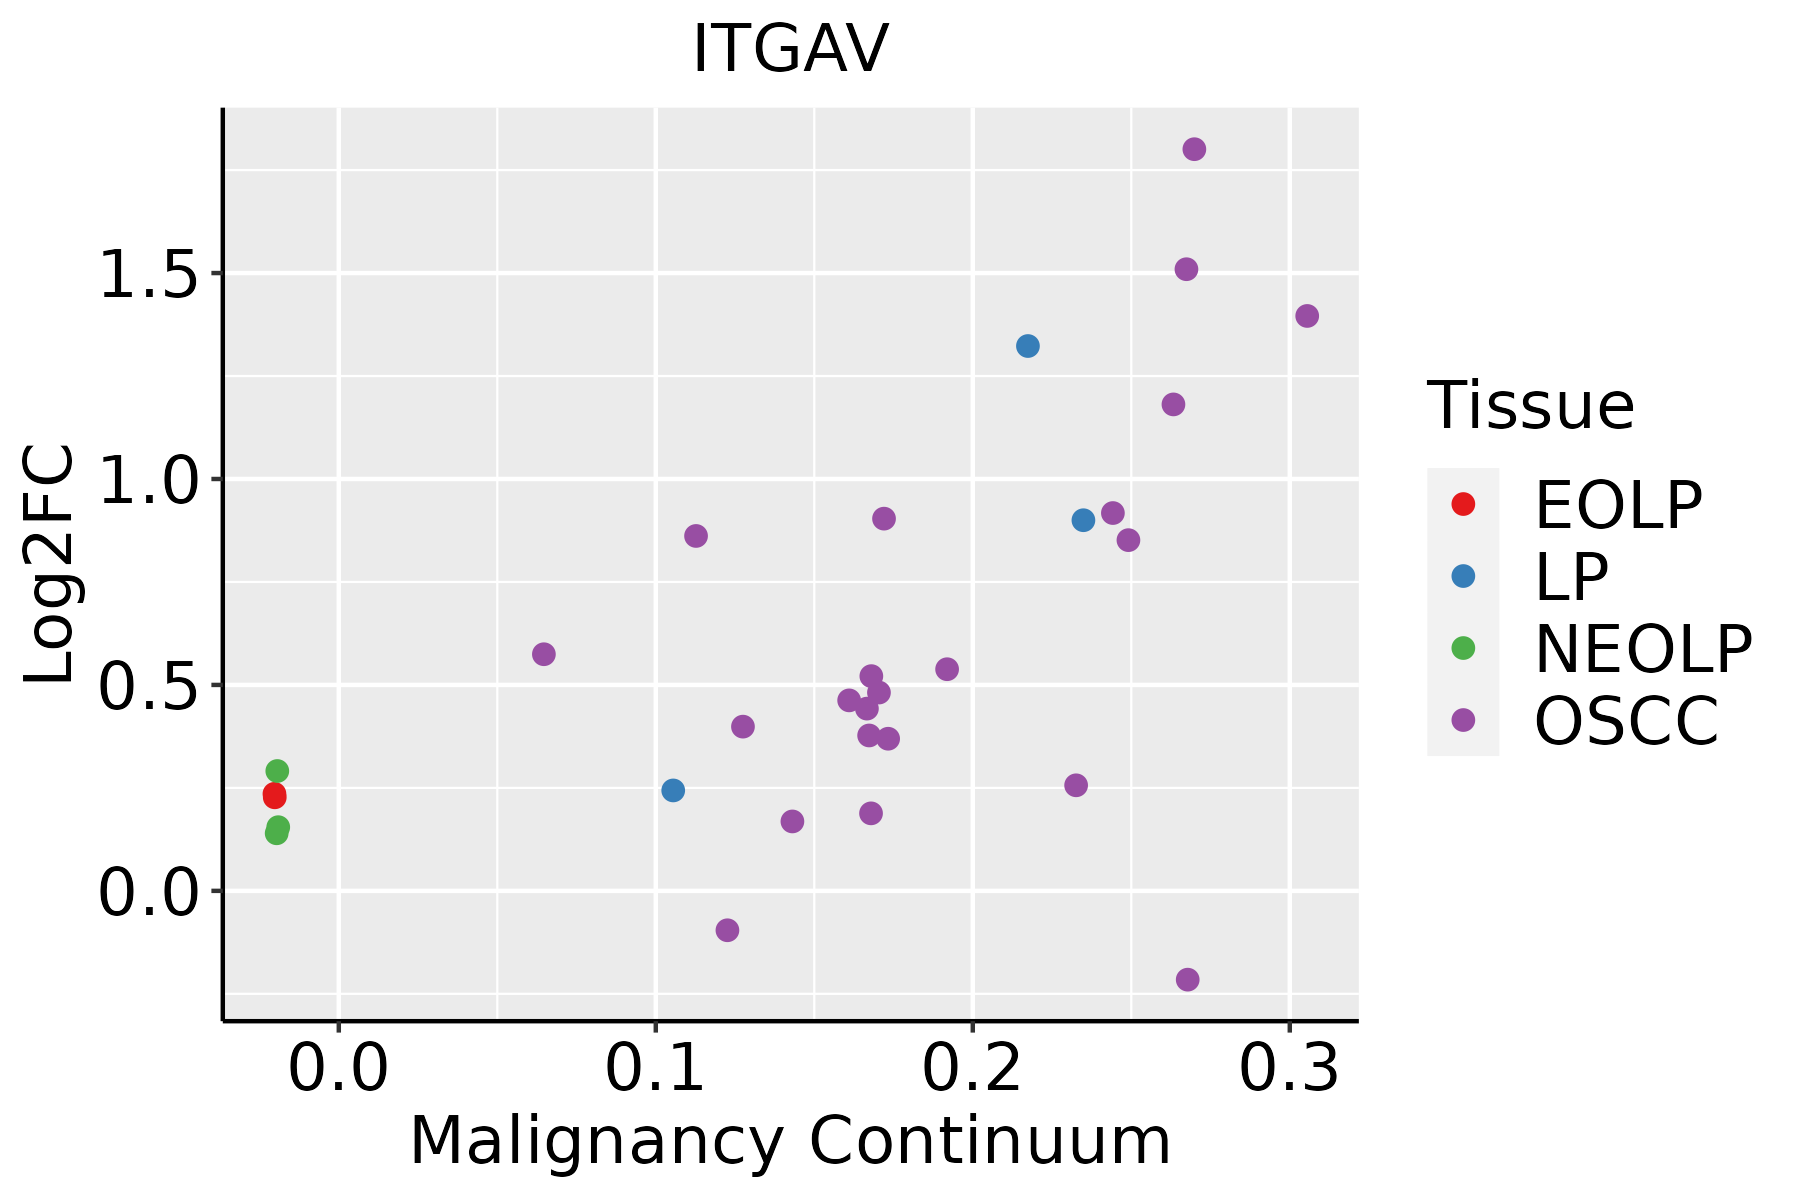 | EOLP: Erosive Oral lichen planus |
| LP: leukoplakia |
| NEOLP: Non-erosive oral lichen planus |
| OSCC: Oral squamous cell carcinoma |
| Prostate | 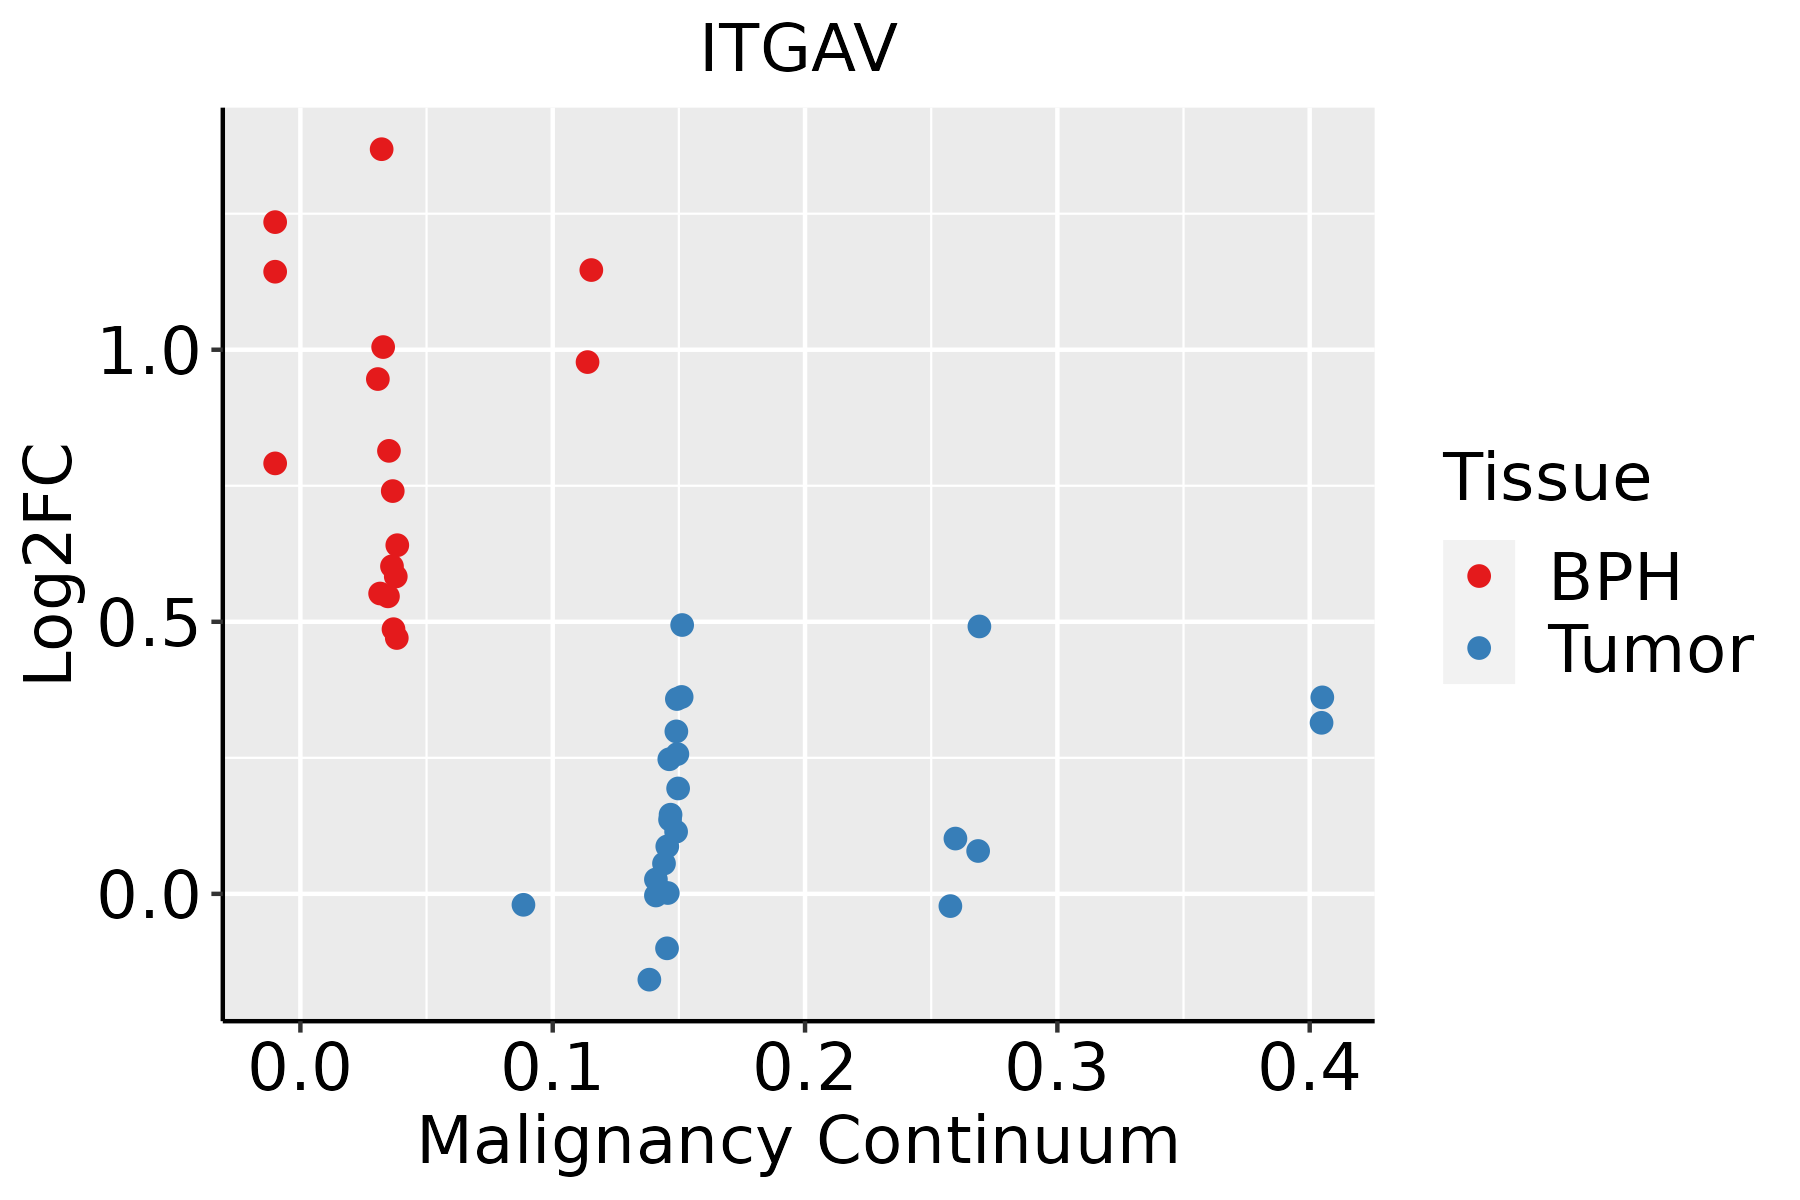 | BPH: Benign Prostatic Hyperplasia |
| Skin | 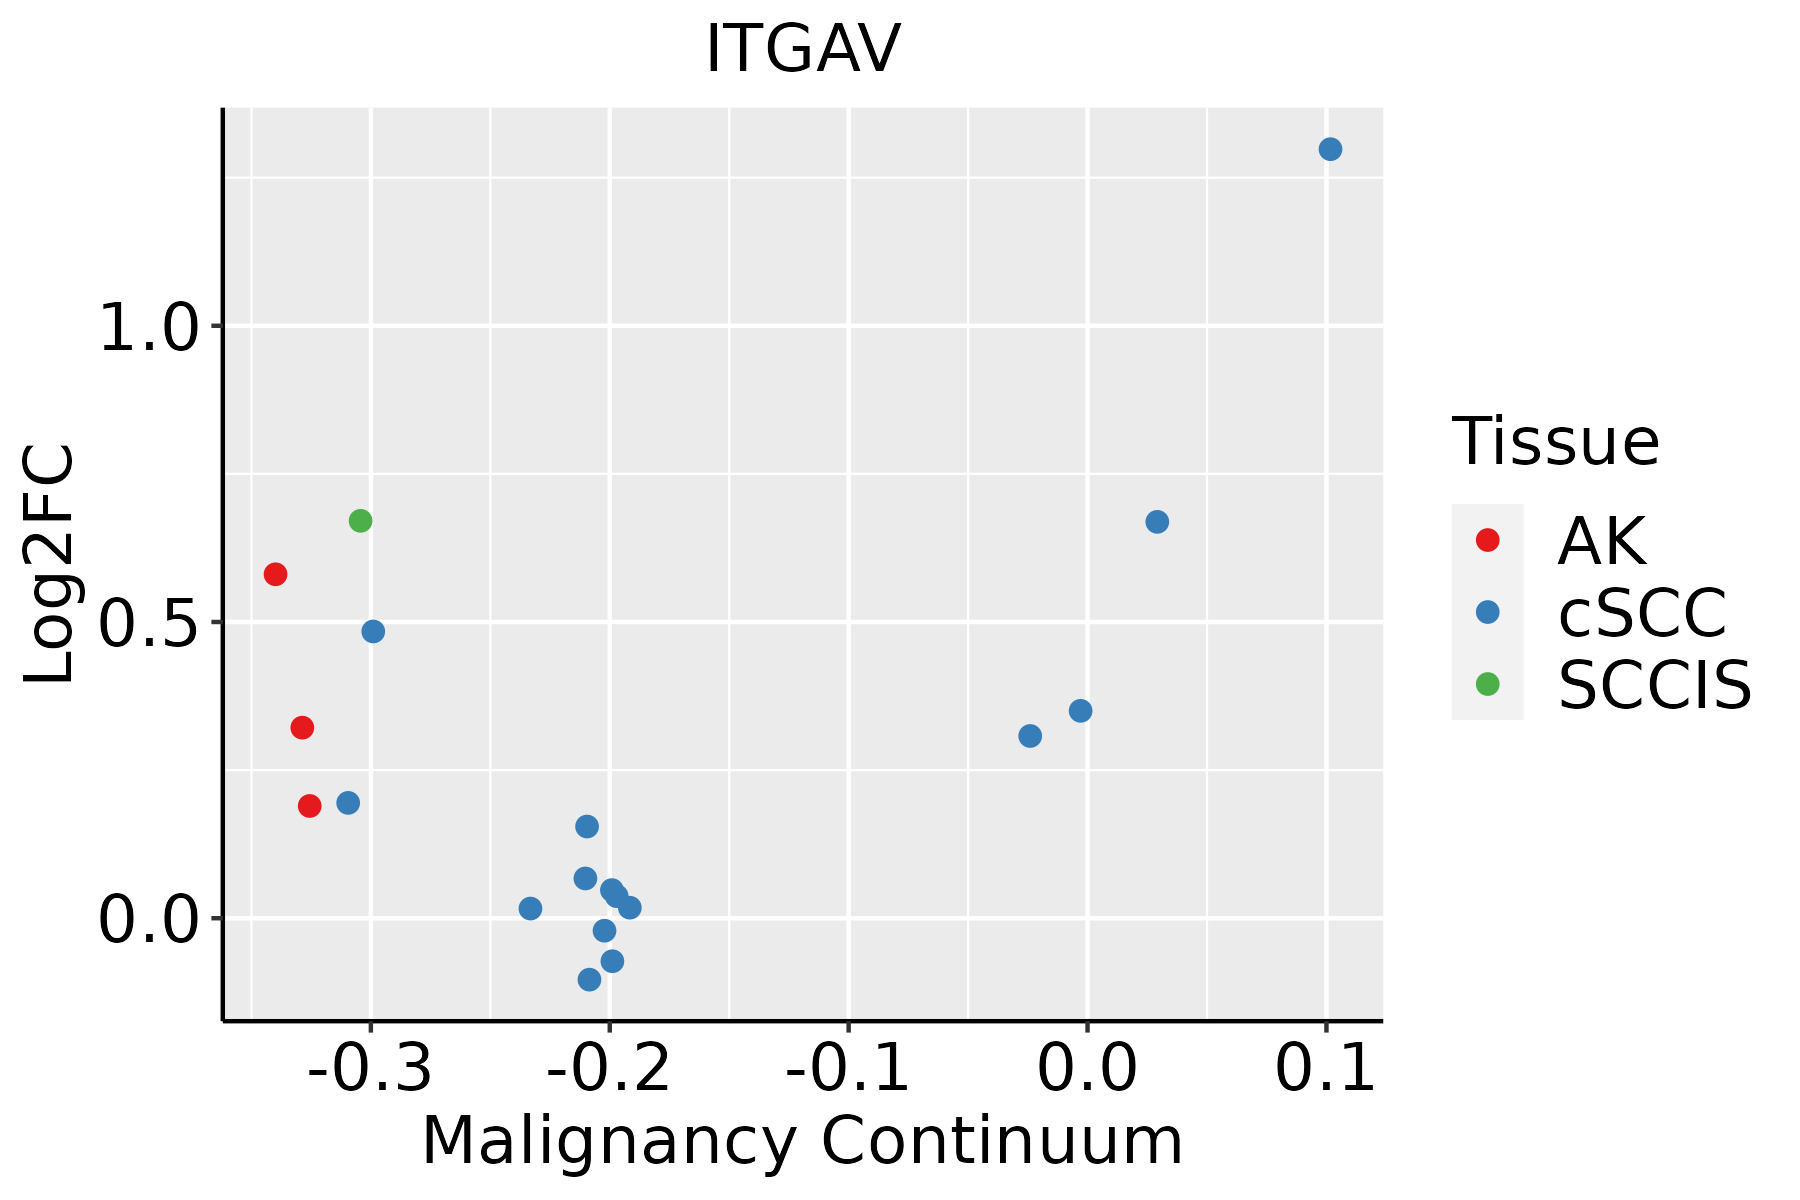 | AK: Actinic keratosis |
| cSCC: Cutaneous squamous cell carcinoma |
| SCCIS:squamous cell carcinoma in situ |
| Thyroid | 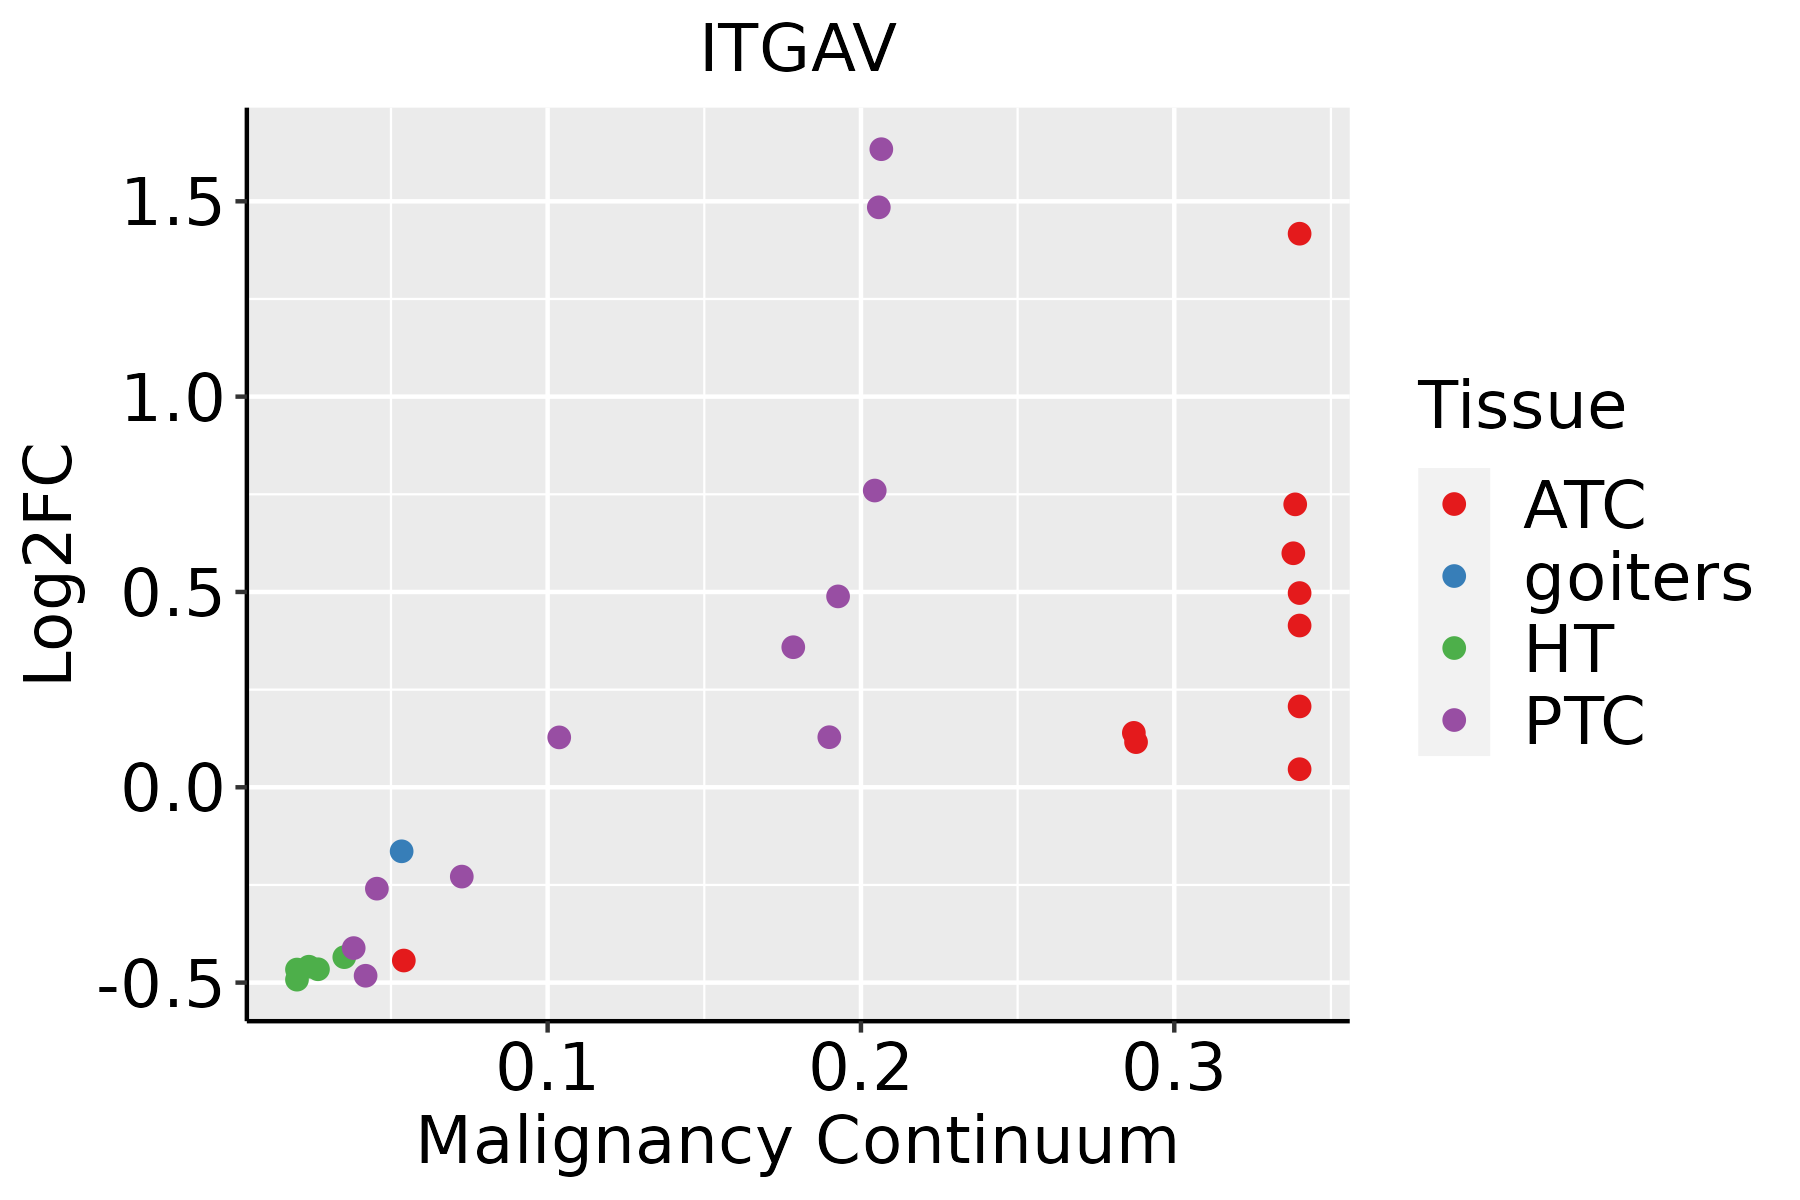 | ATC: Anaplastic thyroid cancer |
| HT: Hashimoto's thyroiditis |
| PTC: Papillary thyroid cancer |
| GO ID | Tissue | Disease Stage | Description | Gene Ratio | Bg Ratio | pvalue | p.adjust | Count |
| GO:001603210 | Cervix | CC | viral process | 109/2311 | 415/18723 | 5.40e-15 | 6.46e-12 | 109 |
| GO:200123310 | Cervix | CC | regulation of apoptotic signaling pathway | 96/2311 | 356/18723 | 4.08e-14 | 3.05e-11 | 96 |
| GO:00315898 | Cervix | CC | cell-substrate adhesion | 96/2311 | 363/18723 | 1.48e-13 | 8.85e-11 | 96 |
| GO:001905810 | Cervix | CC | viral life cycle | 87/2311 | 317/18723 | 2.20e-13 | 1.20e-10 | 87 |
| GO:004578510 | Cervix | CC | positive regulation of cell adhesion | 101/2311 | 437/18723 | 1.96e-10 | 3.08e-08 | 101 |
| GO:005212610 | Cervix | CC | movement in host environment | 52/2311 | 175/18723 | 7.03e-10 | 8.76e-08 | 52 |
| GO:004440910 | Cervix | CC | entry into host | 47/2311 | 151/18723 | 8.45e-10 | 1.03e-07 | 47 |
| GO:005170110 | Cervix | CC | biological process involved in interaction with host | 57/2311 | 203/18723 | 1.18e-09 | 1.41e-07 | 57 |
| GO:00510566 | Cervix | CC | regulation of small GTPase mediated signal transduction | 75/2311 | 302/18723 | 1.54e-09 | 1.74e-07 | 75 |
| GO:00512359 | Cervix | CC | maintenance of location | 78/2311 | 327/18723 | 5.18e-09 | 4.92e-07 | 78 |
| GO:004671810 | Cervix | CC | viral entry into host cell | 44/2311 | 144/18723 | 5.47e-09 | 5.03e-07 | 44 |
| GO:004440310 | Cervix | CC | biological process involved in symbiotic interaction | 71/2311 | 290/18723 | 7.94e-09 | 6.98e-07 | 71 |
| GO:00071608 | Cervix | CC | cell-matrix adhesion | 60/2311 | 233/18723 | 1.58e-08 | 1.23e-06 | 60 |
| GO:00072295 | Cervix | CC | integrin-mediated signaling pathway | 34/2311 | 107/18723 | 1.01e-07 | 5.25e-06 | 34 |
| GO:200123410 | Cervix | CC | negative regulation of apoptotic signaling pathway | 56/2311 | 224/18723 | 1.39e-07 | 6.70e-06 | 56 |
| GO:00344469 | Cervix | CC | substrate adhesion-dependent cell spreading | 32/2311 | 108/18723 | 1.36e-06 | 4.55e-05 | 32 |
| GO:009719110 | Cervix | CC | extrinsic apoptotic signaling pathway | 52/2311 | 219/18723 | 2.06e-06 | 6.34e-05 | 52 |
| GO:00068987 | Cervix | CC | receptor-mediated endocytosis | 53/2311 | 244/18723 | 2.52e-05 | 4.29e-04 | 53 |
| GO:200123610 | Cervix | CC | regulation of extrinsic apoptotic signaling pathway | 37/2311 | 151/18723 | 2.80e-05 | 4.65e-04 | 37 |
| GO:00301008 | Cervix | CC | regulation of endocytosis | 47/2311 | 211/18723 | 3.65e-05 | 5.82e-04 | 47 |
| Pathway ID | Tissue | Disease Stage | Description | Gene Ratio | Bg Ratio | pvalue | p.adjust | qvalue | Count |
| hsa0541820 | Cervix | CC | Fluid shear stress and atherosclerosis | 50/1267 | 139/8465 | 5.71e-10 | 1.32e-08 | 7.81e-09 | 50 |
| hsa0516318 | Cervix | CC | Human cytomegalovirus infection | 65/1267 | 225/8465 | 4.59e-08 | 6.47e-07 | 3.83e-07 | 65 |
| hsa0520516 | Cervix | CC | Proteoglycans in cancer | 60/1267 | 205/8465 | 9.13e-08 | 1.18e-06 | 7.00e-07 | 60 |
| hsa0451010 | Cervix | CC | Focal adhesion | 59/1267 | 203/8465 | 1.53e-07 | 1.84e-06 | 1.09e-06 | 59 |
| hsa0481016 | Cervix | CC | Regulation of actin cytoskeleton | 64/1267 | 229/8465 | 2.24e-07 | 2.59e-06 | 1.53e-06 | 64 |
| hsa0414520 | Cervix | CC | Phagosome | 47/1267 | 152/8465 | 3.95e-07 | 4.26e-06 | 2.52e-06 | 47 |
| hsa052226 | Cervix | CC | Small cell lung cancer | 29/1267 | 92/8465 | 4.38e-05 | 3.09e-04 | 1.83e-04 | 29 |
| hsa051657 | Cervix | CC | Human papillomavirus infection | 74/1267 | 331/8465 | 1.70e-04 | 1.02e-03 | 6.03e-04 | 74 |
| hsa0491918 | Cervix | CC | Thyroid hormone signaling pathway | 33/1267 | 121/8465 | 3.11e-04 | 1.65e-03 | 9.78e-04 | 33 |
| hsa045147 | Cervix | CC | Cell adhesion molecules | 36/1267 | 157/8465 | 4.94e-03 | 1.67e-02 | 9.86e-03 | 36 |
| hsa05418110 | Cervix | CC | Fluid shear stress and atherosclerosis | 50/1267 | 139/8465 | 5.71e-10 | 1.32e-08 | 7.81e-09 | 50 |
| hsa0516319 | Cervix | CC | Human cytomegalovirus infection | 65/1267 | 225/8465 | 4.59e-08 | 6.47e-07 | 3.83e-07 | 65 |
| hsa0520517 | Cervix | CC | Proteoglycans in cancer | 60/1267 | 205/8465 | 9.13e-08 | 1.18e-06 | 7.00e-07 | 60 |
| hsa0451014 | Cervix | CC | Focal adhesion | 59/1267 | 203/8465 | 1.53e-07 | 1.84e-06 | 1.09e-06 | 59 |
| hsa0481017 | Cervix | CC | Regulation of actin cytoskeleton | 64/1267 | 229/8465 | 2.24e-07 | 2.59e-06 | 1.53e-06 | 64 |
| hsa04145110 | Cervix | CC | Phagosome | 47/1267 | 152/8465 | 3.95e-07 | 4.26e-06 | 2.52e-06 | 47 |
| hsa0522213 | Cervix | CC | Small cell lung cancer | 29/1267 | 92/8465 | 4.38e-05 | 3.09e-04 | 1.83e-04 | 29 |
| hsa0516512 | Cervix | CC | Human papillomavirus infection | 74/1267 | 331/8465 | 1.70e-04 | 1.02e-03 | 6.03e-04 | 74 |
| hsa0491919 | Cervix | CC | Thyroid hormone signaling pathway | 33/1267 | 121/8465 | 3.11e-04 | 1.65e-03 | 9.78e-04 | 33 |
| hsa0451412 | Cervix | CC | Cell adhesion molecules | 36/1267 | 157/8465 | 4.94e-03 | 1.67e-02 | 9.86e-03 | 36 |
| Hugo Symbol | Variant Class | Variant Classification | dbSNP RS | HGVSc | HGVSp | HGVSp Short | SWISSPROT | BIOTYPE | SIFT | PolyPhen | Tumor Sample Barcode | Tissue | Histology | Sex | Age | Stage | Therapy Types | Drugs | Outcome |
| ITGAV | SNV | Missense_Mutation | | c.1264G>A | p.Glu422Lys | p.E422K | P06756 | protein_coding | tolerated(0.45) | benign(0.003) | TCGA-A8-A06Q-01 | Breast | breast invasive carcinoma | Female | <65 | III/IV | Unknown | Unknown | SD |
| ITGAV | SNV | Missense_Mutation | | c.2729N>G | p.Leu910Trp | p.L910W | P06756 | protein_coding | tolerated(0.3) | probably_damaging(0.997) | TCGA-A8-A081-01 | Breast | breast invasive carcinoma | Female | >=65 | I/II | Unknown | Unknown | SD |
| ITGAV | SNV | Missense_Mutation | | c.147N>G | p.Phe49Leu | p.F49L | P06756 | protein_coding | deleterious(0.02) | probably_damaging(0.97) | TCGA-A8-A0AD-01 | Breast | breast invasive carcinoma | Female | >=65 | I/II | Hormone Therapy | tamoxiphen | SD |
| ITGAV | SNV | Missense_Mutation | | c.323G>C | p.Arg108Thr | p.R108T | P06756 | protein_coding | deleterious(0.02) | benign(0.179) | TCGA-BH-A0W7-01 | Breast | breast invasive carcinoma | Female | <65 | I/II | Chemotherapy | taxotere | CR |
| ITGAV | SNV | Missense_Mutation | | c.2281T>C | p.Ser761Pro | p.S761P | P06756 | protein_coding | tolerated(0.12) | probably_damaging(0.915) | TCGA-BH-A18G-01 | Breast | breast invasive carcinoma | Female | >=65 | I/II | Unknown | Unknown | SD |
| ITGAV | SNV | Missense_Mutation | rs200733186 | c.2834N>G | p.Asn945Ser | p.N945S | P06756 | protein_coding | deleterious(0.04) | probably_damaging(0.991) | TCGA-OL-A97C-01 | Breast | breast invasive carcinoma | Female | >=65 | I/II | Unknown | Unknown | PD |
| ITGAV | deletion | Frame_Shift_Del | | c.1682delG | p.Gly561AspfsTer2 | p.G561Dfs*2 | P06756 | protein_coding | | | TCGA-BH-A18G-01 | Breast | breast invasive carcinoma | Female | >=65 | I/II | Unknown | Unknown | SD |
| ITGAV | SNV | Missense_Mutation | | c.1990N>G | p.Gln664Glu | p.Q664E | P06756 | protein_coding | tolerated(1) | benign(0.224) | TCGA-DR-A0ZM-01 | Cervix | cervical & endocervical cancer | Female | <65 | III/IV | Unspecific | Cisplatin | SD |
| ITGAV | SNV | Missense_Mutation | rs201231113 | c.298A>G | p.Ile100Val | p.I100V | P06756 | protein_coding | tolerated(0.12) | benign(0) | TCGA-ZJ-AAXT-01 | Cervix | cervical & endocervical cancer | Female | <65 | III/IV | Unknown | Unknown | SD |
| ITGAV | SNV | Missense_Mutation | rs554897868 | c.2120N>A | p.Arg707His | p.R707H | P06756 | protein_coding | deleterious(0.01) | benign(0.028) | TCGA-4T-AA8H-01 | Colorectum | colon adenocarcinoma | Female | <65 | I/II | Unknown | Unknown | SD |
| Entrez ID | Symbol | Category | Interaction Types | Drug Claim Name | Drug Name | PMIDs |
| 3685 | ITGAV | DRUGGABLE GENOME, CELL SURFACE, EXTERNAL SIDE OF PLASMA MEMBRANE | inhibitor | CHEMBL2109621 | ABITUZUMAB | |
| 3685 | ITGAV | DRUGGABLE GENOME, CELL SURFACE, EXTERNAL SIDE OF PLASMA MEMBRANE | antagonist | 348353648 | | |
| 3685 | ITGAV | DRUGGABLE GENOME, CELL SURFACE, EXTERNAL SIDE OF PLASMA MEMBRANE | antagonist | CHEMBL429876 | CILENGITIDE | |
| 3685 | ITGAV | DRUGGABLE GENOME, CELL SURFACE, EXTERNAL SIDE OF PLASMA MEMBRANE | | VOLOCIXIMAB | VOLOCIXIMAB | |
| 3685 | ITGAV | DRUGGABLE GENOME, CELL SURFACE, EXTERNAL SIDE OF PLASMA MEMBRANE | | CYPATE | CYPATE | 22871580 |
| 3685 | ITGAV | DRUGGABLE GENOME, CELL SURFACE, EXTERNAL SIDE OF PLASMA MEMBRANE | | GLPG0187 | GLPG-0187 | |
| 3685 | ITGAV | DRUGGABLE GENOME, CELL SURFACE, EXTERNAL SIDE OF PLASMA MEMBRANE | | CNTO-95 | INTETUMUMAB | |
| 3685 | ITGAV | DRUGGABLE GENOME, CELL SURFACE, EXTERNAL SIDE OF PLASMA MEMBRANE | inhibitor | CHEMBL2109623 | STX-100 | |
| 3685 | ITGAV | DRUGGABLE GENOME, CELL SURFACE, EXTERNAL SIDE OF PLASMA MEMBRANE | | Abituzumab | ABITUZUMAB | |
| 3685 | ITGAV | DRUGGABLE GENOME, CELL SURFACE, EXTERNAL SIDE OF PLASMA MEMBRANE | | CILENGITIDE | CILENGITIDE | 24095096 |


