
|
|||||
|
 | |
| |
| |
| |
| |
| |
|
Gene: ITGAL |
Gene summary for ITGAL |
| Gene information | Species | Human | Gene symbol | ITGAL | Gene ID | 3683 |
| Gene name | integrin subunit alpha L | |
| Gene Alias | CD11A | |
| Cytomap | 16p11.2 | |
| Gene Type | protein-coding | GO ID | GO:0001775 | UniProtAcc | P20701 |
Top |
Malignant transformation analysis |
| Identification of the aberrant gene expression in precancerous and cancerous lesions by comparing the gene expression of stem-like cells in diseased tissues with normal stem cells |
| Entrez ID | Symbol | Replicates | Species | Organ | Tissue | Adj P-value | Log2FC | Malignancy |
| 3683 | ITGAL | HCC1_Meng | Human | Liver | HCC | 1.55e-07 | 8.88e-04 | 0.0246 |
| 3683 | ITGAL | HCC1 | Human | Liver | HCC | 7.29e-12 | 1.80e+00 | 0.5336 |
| 3683 | ITGAL | HCC2 | Human | Liver | HCC | 1.93e-14 | 1.12e+00 | 0.5341 |
| 3683 | ITGAL | HCC5 | Human | Liver | HCC | 4.04e-24 | 1.74e+00 | 0.4932 |
| Page: 1 |
| Tissue | Expression Dynamics | Abbreviation |
| Liver | 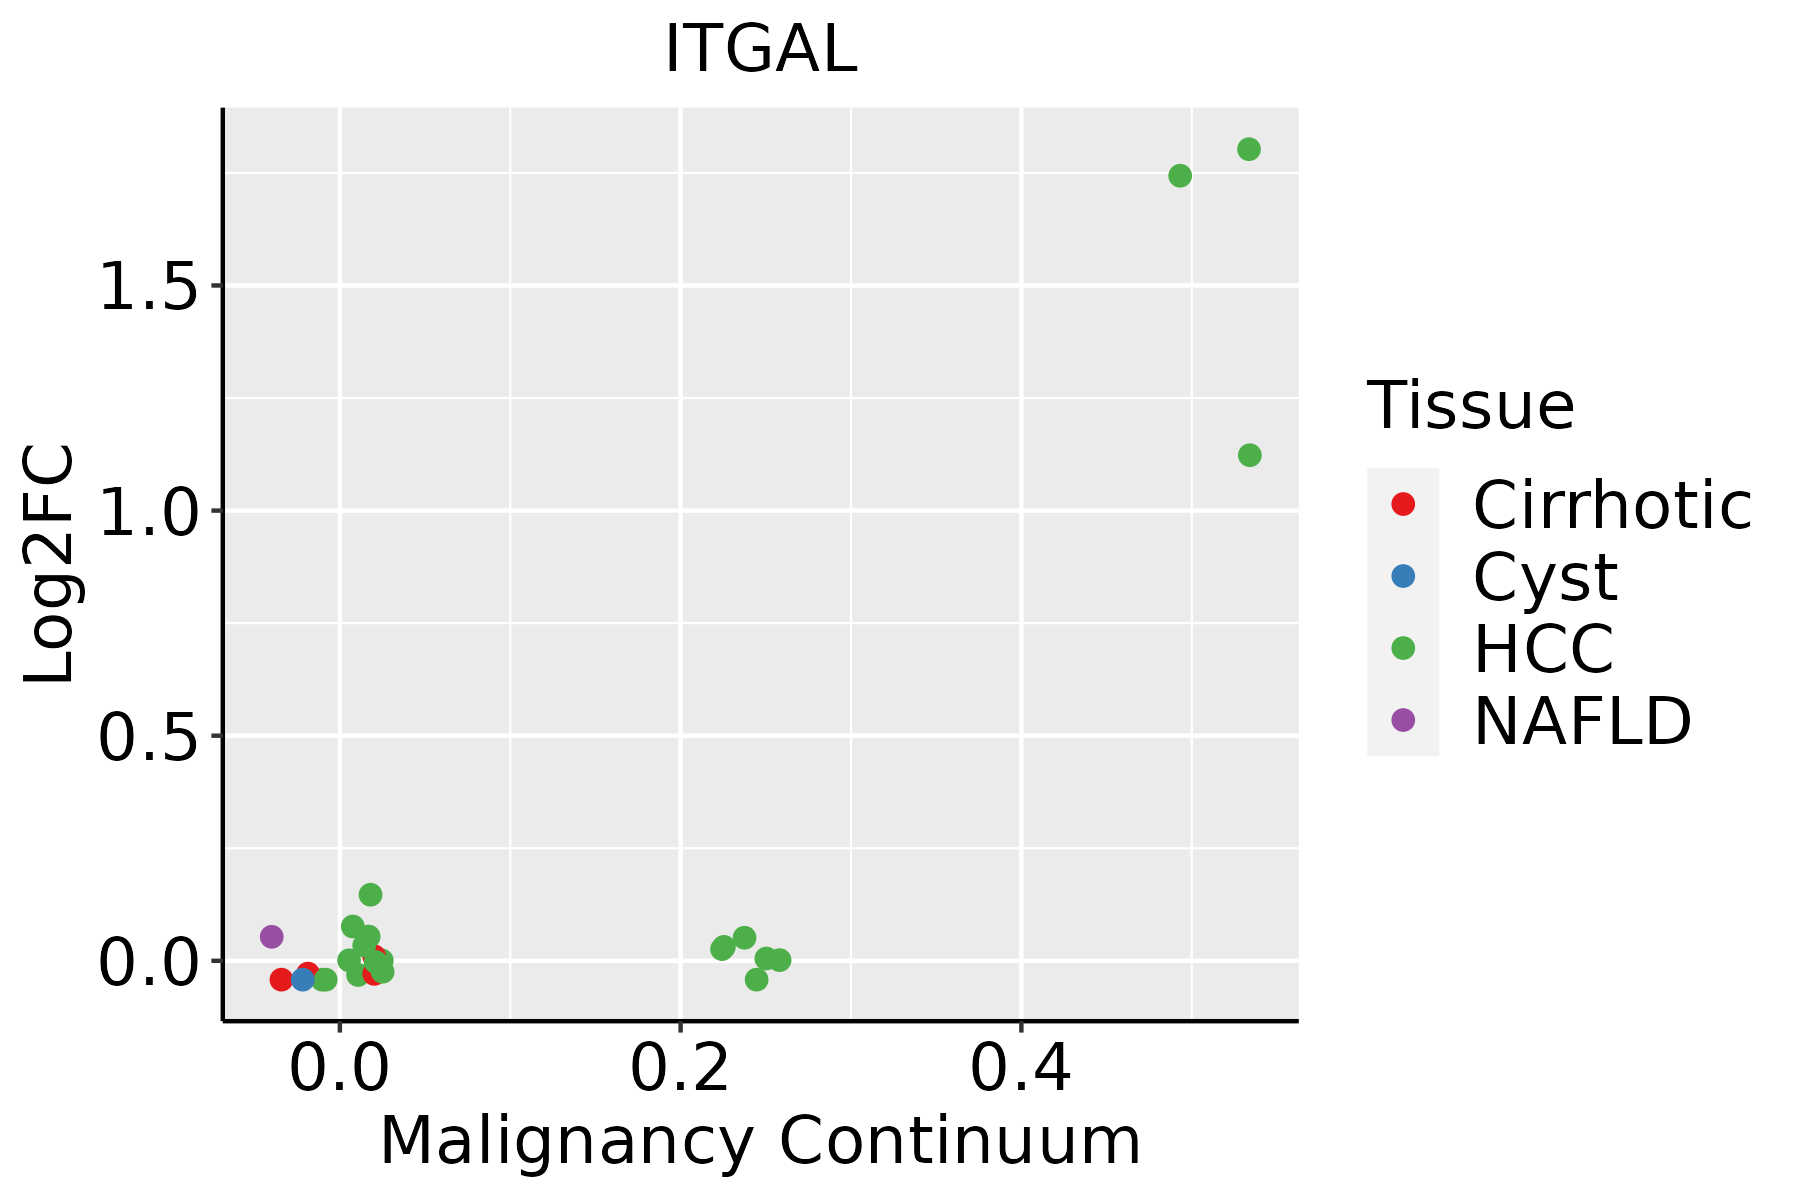 | HCC: Hepatocellular carcinoma |
| NAFLD: Non-alcoholic fatty liver disease |
| ∗log2FC in expression of this searched gene in stem-like cells from each diseased tissue sample relative to stem-like cells in normal samples in each tissue plotted against the malignancy continuum. Samples are colored based on if they are from different disease stage. |
Top |
Malignant transformation related pathway analysis |
| Find out the enriched GO biological processes and KEGG pathways involved in transition from healthy to precancer to cancer |
| Tissue | Disease Stage | Enriched GO biological Processes |
| Colorectum | AD |  |
| Colorectum | SER |  |
| Colorectum | MSS |  |
| Colorectum | MSI-H |  |
| Colorectum | FAP |  |
| ∗Top 15 enriched GO BP terms are showed in the bar plot of each disease state in each tissue. Each row represents a significant GO biological process which is colored according to the -log10(p.adjust). |
| Page: 1 2 3 4 5 6 7 8 9 |
| GO ID | Tissue | Disease Stage | Description | Gene Ratio | Bg Ratio | pvalue | p.adjust | Count |
| GO:003158922 | Liver | HCC | cell-substrate adhesion | 188/7958 | 363/18723 | 2.00e-04 | 1.55e-03 | 188 |
| GO:000716021 | Liver | HCC | cell-matrix adhesion | 123/7958 | 233/18723 | 9.34e-04 | 5.47e-03 | 123 |
| GO:00072292 | Liver | HCC | integrin-mediated signaling pathway | 60/7958 | 107/18723 | 3.15e-03 | 1.46e-02 | 60 |
| Page: 1 |
| Pathway ID | Tissue | Disease Stage | Description | Gene Ratio | Bg Ratio | pvalue | p.adjust | qvalue | Count |
| hsa0516921 | Liver | HCC | Epstein-Barr virus infection | 128/4020 | 202/8465 | 3.17e-06 | 2.79e-05 | 1.55e-05 | 128 |
| hsa0516622 | Liver | HCC | Human T-cell leukemia virus 1 infection | 139/4020 | 222/8465 | 3.17e-06 | 2.79e-05 | 1.55e-05 | 139 |
| hsa0481041 | Liver | HCC | Regulation of actin cytoskeleton | 134/4020 | 229/8465 | 4.48e-04 | 1.94e-03 | 1.08e-03 | 134 |
| hsa0467042 | Liver | HCC | Leukocyte transendothelial migration | 68/4020 | 114/8465 | 5.79e-03 | 1.64e-02 | 9.15e-03 | 68 |
| hsa0516931 | Liver | HCC | Epstein-Barr virus infection | 128/4020 | 202/8465 | 3.17e-06 | 2.79e-05 | 1.55e-05 | 128 |
| hsa0516632 | Liver | HCC | Human T-cell leukemia virus 1 infection | 139/4020 | 222/8465 | 3.17e-06 | 2.79e-05 | 1.55e-05 | 139 |
| hsa0481051 | Liver | HCC | Regulation of actin cytoskeleton | 134/4020 | 229/8465 | 4.48e-04 | 1.94e-03 | 1.08e-03 | 134 |
| hsa0467052 | Liver | HCC | Leukocyte transendothelial migration | 68/4020 | 114/8465 | 5.79e-03 | 1.64e-02 | 9.15e-03 | 68 |
| Page: 1 |
Top |
Cell-cell communication analysis |
| Identification of potential cell-cell interactions between two cell types and their ligand-receptor pairs for different disease states |
| Ligand | Receptor | LRpair | Pathway | Tissue | Disease Stage |
| ICAM1 | ITGAL_ITGB2 | ICAM1_ITGAL_ITGB2 | ICAM | Breast | ADJ |
| ICAM2 | ITGAL_ITGB2 | ICAM2_ITGAL_ITGB2 | ICAM | Breast | ADJ |
| ICAM1 | ITGAL | ICAM1_ITGAL | ICAM | Breast | ADJ |
| F11R | ITGAL_ITGB2 | JAM1_ITGAL_ITGB2 | JAM | Breast | ADJ |
| ICAM1 | ITGAL_ITGB2 | ICAM1_ITGAL_ITGB2 | ICAM | Breast | DCIS |
| ICAM2 | ITGAL_ITGB2 | ICAM2_ITGAL_ITGB2 | ICAM | Breast | DCIS |
| ICAM1 | ITGAL | ICAM1_ITGAL | ICAM | Breast | DCIS |
| F11R | ITGAL_ITGB2 | JAM1_ITGAL_ITGB2 | JAM | Breast | DCIS |
| ICAM1 | ITGAL_ITGB2 | ICAM1_ITGAL_ITGB2 | ICAM | Breast | Healthy |
| ICAM2 | ITGAL_ITGB2 | ICAM2_ITGAL_ITGB2 | ICAM | Breast | Healthy |
| ICAM1 | ITGAL | ICAM1_ITGAL | ICAM | Breast | Healthy |
| ICAM1 | ITGAL_ITGB2 | ICAM1_ITGAL_ITGB2 | ICAM | Breast | IDC |
| ICAM2 | ITGAL_ITGB2 | ICAM2_ITGAL_ITGB2 | ICAM | Breast | IDC |
| ICAM1 | ITGAL | ICAM1_ITGAL | ICAM | Breast | IDC |
| F11R | ITGAL_ITGB2 | JAM1_ITGAL_ITGB2 | JAM | Breast | IDC |
| ICAM1 | ITGAL_ITGB2 | ICAM1_ITGAL_ITGB2 | ICAM | Cervix | ADJ |
| ICAM2 | ITGAL_ITGB2 | ICAM2_ITGAL_ITGB2 | ICAM | Cervix | ADJ |
| ICAM1 | ITGAL | ICAM1_ITGAL | ICAM | Cervix | ADJ |
| F11R | ITGAL_ITGB2 | JAM1_ITGAL_ITGB2 | JAM | Cervix | ADJ |
| ICAM1 | ITGAL_ITGB2 | ICAM1_ITGAL_ITGB2 | ICAM | Cervix | CC |
| Page: 1 |
Top |
Single-cell gene regulatory network inference analysis |
| Find out the significant the regulons (TFs) and the target genes of each regulon across cell types for different disease states |
| TF | Cell Type | Tissue | Disease Stage | Target Gene | RSS | Regulon Activity |
| ∗The dot plots of a searched regulon are shown for all cell subpopulations in each disease state of each tissue based on the regulon specific score inferred using pySCENIC and by calculating the average expression. |
| Page: 1 |
Top |
Somatic mutation of malignant transformation related genes |
| Annotation of somatic variants for genes involved in malignant transformation |
| Hugo Symbol | Variant Class | Variant Classification | dbSNP RS | HGVSc | HGVSp | HGVSp Short | SWISSPROT | BIOTYPE | SIFT | PolyPhen | Tumor Sample Barcode | Tissue | Histology | Sex | Age | Stage | Therapy Types | Drugs | Outcome |
| ITGAL | SNV | Missense_Mutation | rs749865362 | c.2381G>A | p.Arg794His | p.R794H | P20701 | protein_coding | tolerated(0.61) | benign(0.003) | TCGA-AN-A046-01 | Breast | breast invasive carcinoma | Female | >=65 | I/II | Unknown | Unknown | SD |
| ITGAL | SNV | Missense_Mutation | c.2905N>A | p.Leu969Met | p.L969M | P20701 | protein_coding | deleterious(0.04) | possibly_damaging(0.822) | TCGA-AN-A0XU-01 | Breast | breast invasive carcinoma | Female | <65 | I/II | Unknown | Unknown | SD | |
| ITGAL | SNV | Missense_Mutation | c.38N>C | p.Leu13Pro | p.L13P | P20701 | protein_coding | deleterious(0) | possibly_damaging(0.692) | TCGA-AO-A128-01 | Breast | breast invasive carcinoma | Female | <65 | I/II | Chemotherapy | doxorubicin | SD | |
| ITGAL | SNV | Missense_Mutation | rs867203540 | c.805N>A | p.Asp269Asn | p.D269N | P20701 | protein_coding | deleterious(0.01) | possibly_damaging(0.69) | TCGA-D8-A27G-01 | Breast | breast invasive carcinoma | Female | >=65 | I/II | Unknown | Unknown | SD |
| ITGAL | SNV | Missense_Mutation | novel | c.163G>A | p.Gly55Arg | p.G55R | P20701 | protein_coding | tolerated(0.35) | benign(0.003) | TCGA-LD-A74U-01 | Breast | breast invasive carcinoma | Female | >=65 | III/IV | Chemotherapy | taxotere | SD |
| ITGAL | SNV | Missense_Mutation | novel | c.62C>T | p.Ala21Val | p.A21V | P20701 | protein_coding | tolerated(0.08) | benign(0.017) | TCGA-2W-A8YY-01 | Cervix | cervical & endocervical cancer | Female | <65 | I/II | Chemotherapy | cisplatin | CR |
| ITGAL | SNV | Missense_Mutation | rs145951975 | c.1253C>T | p.Ser418Leu | p.S418L | P20701 | protein_coding | tolerated(0.21) | benign(0.003) | TCGA-2W-A8YY-01 | Cervix | cervical & endocervical cancer | Female | <65 | I/II | Chemotherapy | cisplatin | CR |
| ITGAL | SNV | Missense_Mutation | rs757400430 | c.413G>T | p.Gly138Val | p.G138V | P20701 | protein_coding | tolerated(0.13) | possibly_damaging(0.575) | TCGA-C5-A1BQ-01 | Cervix | cervical & endocervical cancer | Female | >=65 | III/IV | Chemotherapy | cisplatin | CR |
| ITGAL | SNV | Missense_Mutation | rs145951975 | c.1253N>T | p.Ser418Leu | p.S418L | P20701 | protein_coding | tolerated(0.21) | benign(0.003) | TCGA-C5-A905-01 | Cervix | cervical & endocervical cancer | Female | <65 | I/II | Unknown | Unknown | SD |
| ITGAL | SNV | Missense_Mutation | c.832N>T | p.Asp278Tyr | p.D278Y | P20701 | protein_coding | deleterious(0.01) | possibly_damaging(0.795) | TCGA-FU-A3HZ-01 | Cervix | cervical & endocervical cancer | Female | <65 | I/II | Chemotherapy | cisplatin | CR |
| Page: 1 2 3 4 5 6 7 8 9 10 11 12 13 14 15 |
Top |
Related drugs of malignant transformation related genes |
| Identification of chemicals and drugs interact with genes involved in malignant transfromation |
| (DGIdb 4.0) |
| Entrez ID | Symbol | Category | Interaction Types | Drug Claim Name | Drug Name | PMIDs |
| 3683 | ITGAL | EXTERNAL SIDE OF PLASMA MEMBRANE, CELL SURFACE, DRUGGABLE GENOME | CASEARINONE B | CASEARINONE B | 9322361 | |
| 3683 | ITGAL | EXTERNAL SIDE OF PLASMA MEMBRANE, CELL SURFACE, DRUGGABLE GENOME | BUSULFAN | BUSULFAN | 9389690 | |
| 3683 | ITGAL | EXTERNAL SIDE OF PLASMA MEMBRANE, CELL SURFACE, DRUGGABLE GENOME | EFALIZUMAB | EFALIZUMAB | ||
| 3683 | ITGAL | EXTERNAL SIDE OF PLASMA MEMBRANE, CELL SURFACE, DRUGGABLE GENOME | antagonist | 187051834 | LIFITEGRAST | |
| 3683 | ITGAL | EXTERNAL SIDE OF PLASMA MEMBRANE, CELL SURFACE, DRUGGABLE GENOME | 5-FU | FLUOROURACIL | 8888499 | |
| 3683 | ITGAL | EXTERNAL SIDE OF PLASMA MEMBRANE, CELL SURFACE, DRUGGABLE GENOME | ANTITHYMOCYTE GLOBULIN | |||
| 3683 | ITGAL | EXTERNAL SIDE OF PLASMA MEMBRANE, CELL SURFACE, DRUGGABLE GENOME | CASEARINOL B | CASEARINOL B | 9322361 | |
| 3683 | ITGAL | EXTERNAL SIDE OF PLASMA MEMBRANE, CELL SURFACE, DRUGGABLE GENOME | inhibitor | 348353679 | ||
| 3683 | ITGAL | EXTERNAL SIDE OF PLASMA MEMBRANE, CELL SURFACE, DRUGGABLE GENOME | antibody | 340590228 | ROVELIZUMAB | |
| 3683 | ITGAL | EXTERNAL SIDE OF PLASMA MEMBRANE, CELL SURFACE, DRUGGABLE GENOME | Efalizumab | EFALIZUMAB |
| Page: 1 2 3 4 5 |

Copyright 2023-Present -The University of Texas Health Science Center at Houston |