
|
|||||
|
 | |
| |
| |
| |
| |
| |
|
Gene: ITGAE |
Gene summary for ITGAE |
| Gene information | Species | Human | Gene symbol | ITGAE | Gene ID | 3682 |
| Gene name | integrin subunit alpha E | |
| Gene Alias | CD103 | |
| Cytomap | 17p13.2 | |
| Gene Type | protein-coding | GO ID | GO:0007154 | UniProtAcc | P38570 |
Top |
Malignant transformation analysis |
| Identification of the aberrant gene expression in precancerous and cancerous lesions by comparing the gene expression of stem-like cells in diseased tissues with normal stem cells |
| Entrez ID | Symbol | Replicates | Species | Organ | Tissue | Adj P-value | Log2FC | Malignancy |
| 3682 | ITGAE | LZE2T | Human | Esophagus | ESCC | 6.90e-04 | 9.40e-01 | 0.082 |
| 3682 | ITGAE | LZE4T | Human | Esophagus | ESCC | 3.52e-18 | 8.38e-01 | 0.0811 |
| 3682 | ITGAE | LZE7T | Human | Esophagus | ESCC | 1.08e-10 | 8.42e-01 | 0.0667 |
| 3682 | ITGAE | LZE8T | Human | Esophagus | ESCC | 9.92e-09 | 4.83e-01 | 0.067 |
| 3682 | ITGAE | LZE20T | Human | Esophagus | ESCC | 1.24e-02 | 9.21e-02 | 0.0662 |
| 3682 | ITGAE | LZE22D1 | Human | Esophagus | HGIN | 9.26e-03 | 1.11e-01 | 0.0595 |
| 3682 | ITGAE | LZE22T | Human | Esophagus | ESCC | 5.24e-04 | 3.14e-01 | 0.068 |
| 3682 | ITGAE | LZE24T | Human | Esophagus | ESCC | 1.57e-07 | 4.07e-01 | 0.0596 |
| 3682 | ITGAE | LZE21T | Human | Esophagus | ESCC | 3.84e-04 | 3.43e-01 | 0.0655 |
| 3682 | ITGAE | LZE6T | Human | Esophagus | ESCC | 4.00e-14 | 1.02e+00 | 0.0845 |
| 3682 | ITGAE | P1T-E | Human | Esophagus | ESCC | 2.97e-06 | 6.23e-01 | 0.0875 |
| 3682 | ITGAE | P2T-E | Human | Esophagus | ESCC | 3.85e-24 | 6.38e-01 | 0.1177 |
| 3682 | ITGAE | P4T-E | Human | Esophagus | ESCC | 2.62e-33 | 1.14e+00 | 0.1323 |
| 3682 | ITGAE | P5T-E | Human | Esophagus | ESCC | 1.27e-04 | 1.43e-01 | 0.1327 |
| 3682 | ITGAE | P8T-E | Human | Esophagus | ESCC | 6.11e-23 | 5.77e-01 | 0.0889 |
| 3682 | ITGAE | P9T-E | Human | Esophagus | ESCC | 6.09e-14 | 3.79e-01 | 0.1131 |
| 3682 | ITGAE | P10T-E | Human | Esophagus | ESCC | 5.08e-51 | 8.59e-01 | 0.116 |
| 3682 | ITGAE | P11T-E | Human | Esophagus | ESCC | 1.51e-10 | 7.48e-01 | 0.1426 |
| 3682 | ITGAE | P12T-E | Human | Esophagus | ESCC | 6.15e-35 | 7.92e-01 | 0.1122 |
| 3682 | ITGAE | P15T-E | Human | Esophagus | ESCC | 4.54e-11 | 3.07e-01 | 0.1149 |
| Page: 1 2 3 4 5 6 |
| Tissue | Expression Dynamics | Abbreviation |
| Esophagus | 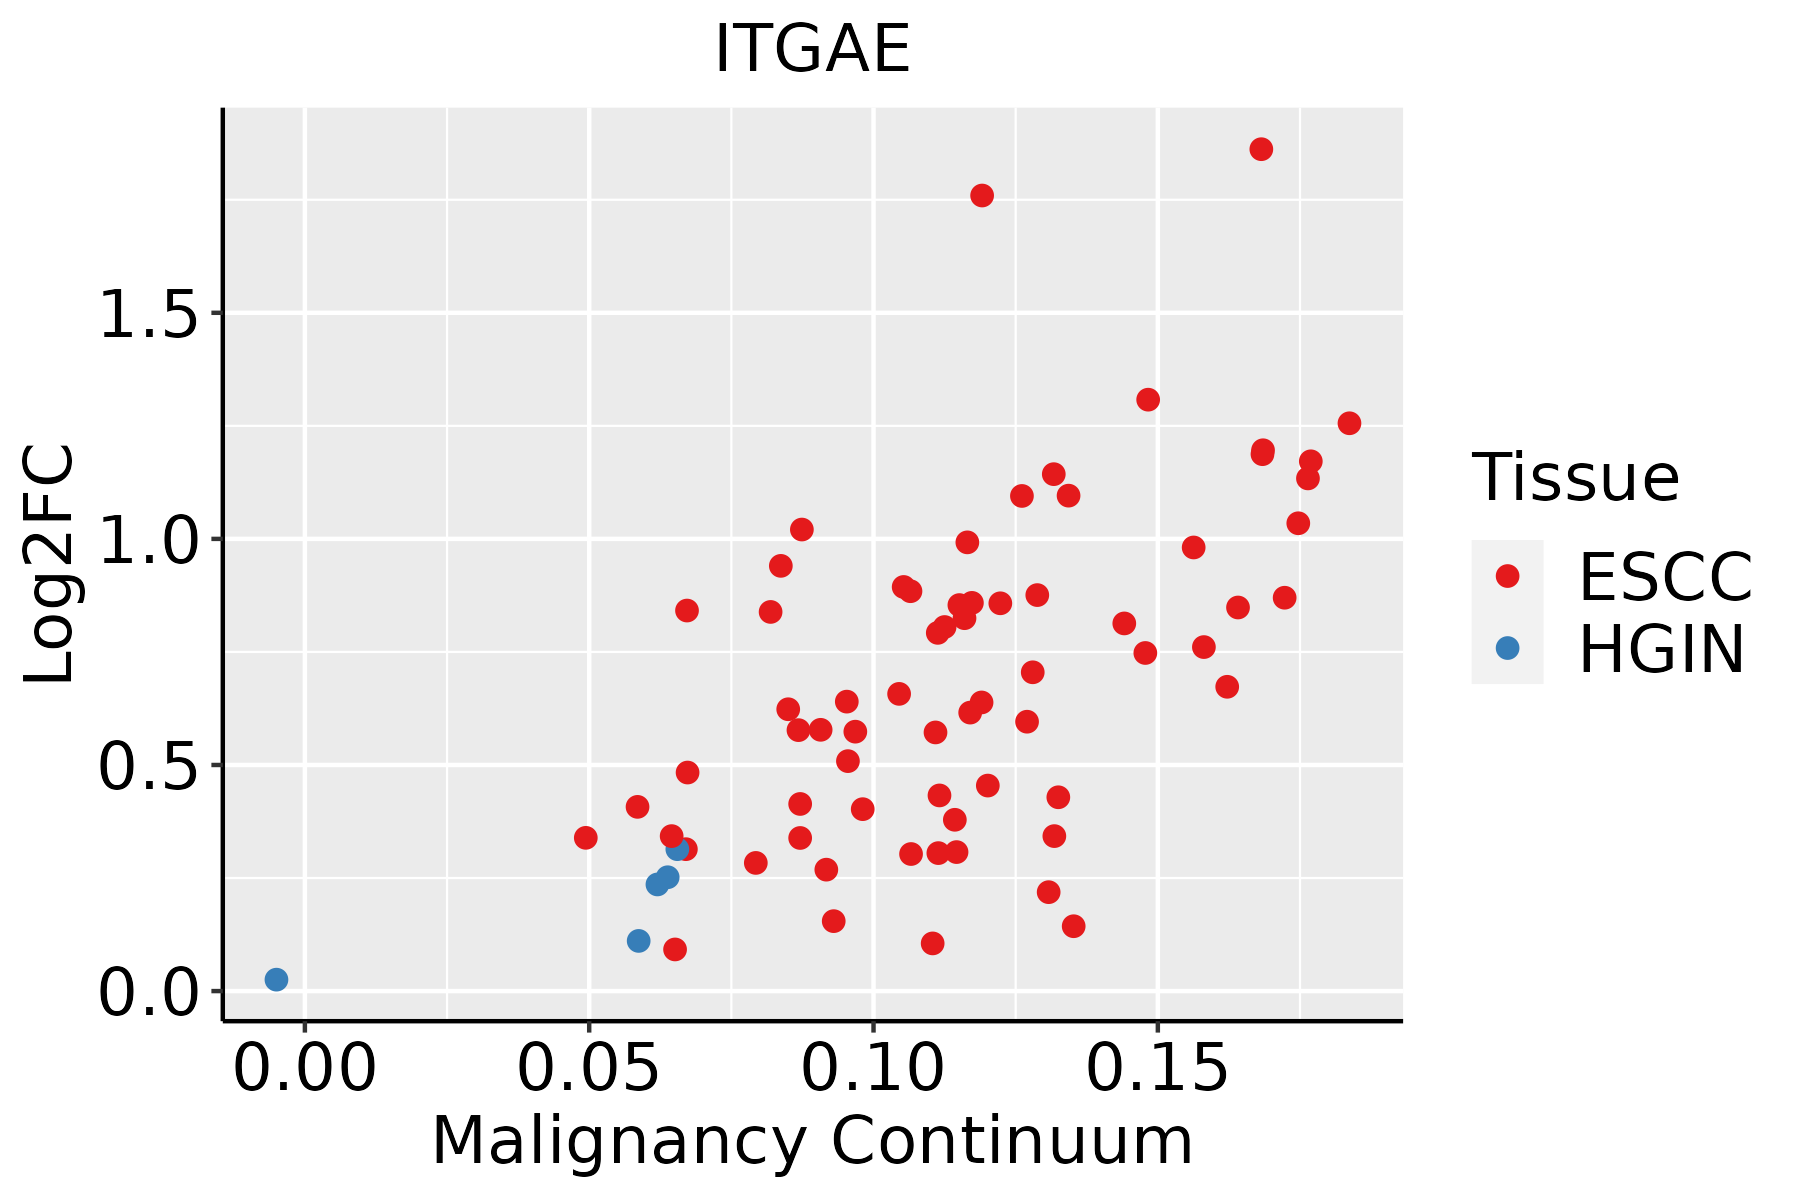 | ESCC: Esophageal squamous cell carcinoma |
| HGIN: High-grade intraepithelial neoplasias | ||
| LGIN: Low-grade intraepithelial neoplasias | ||
| Liver | 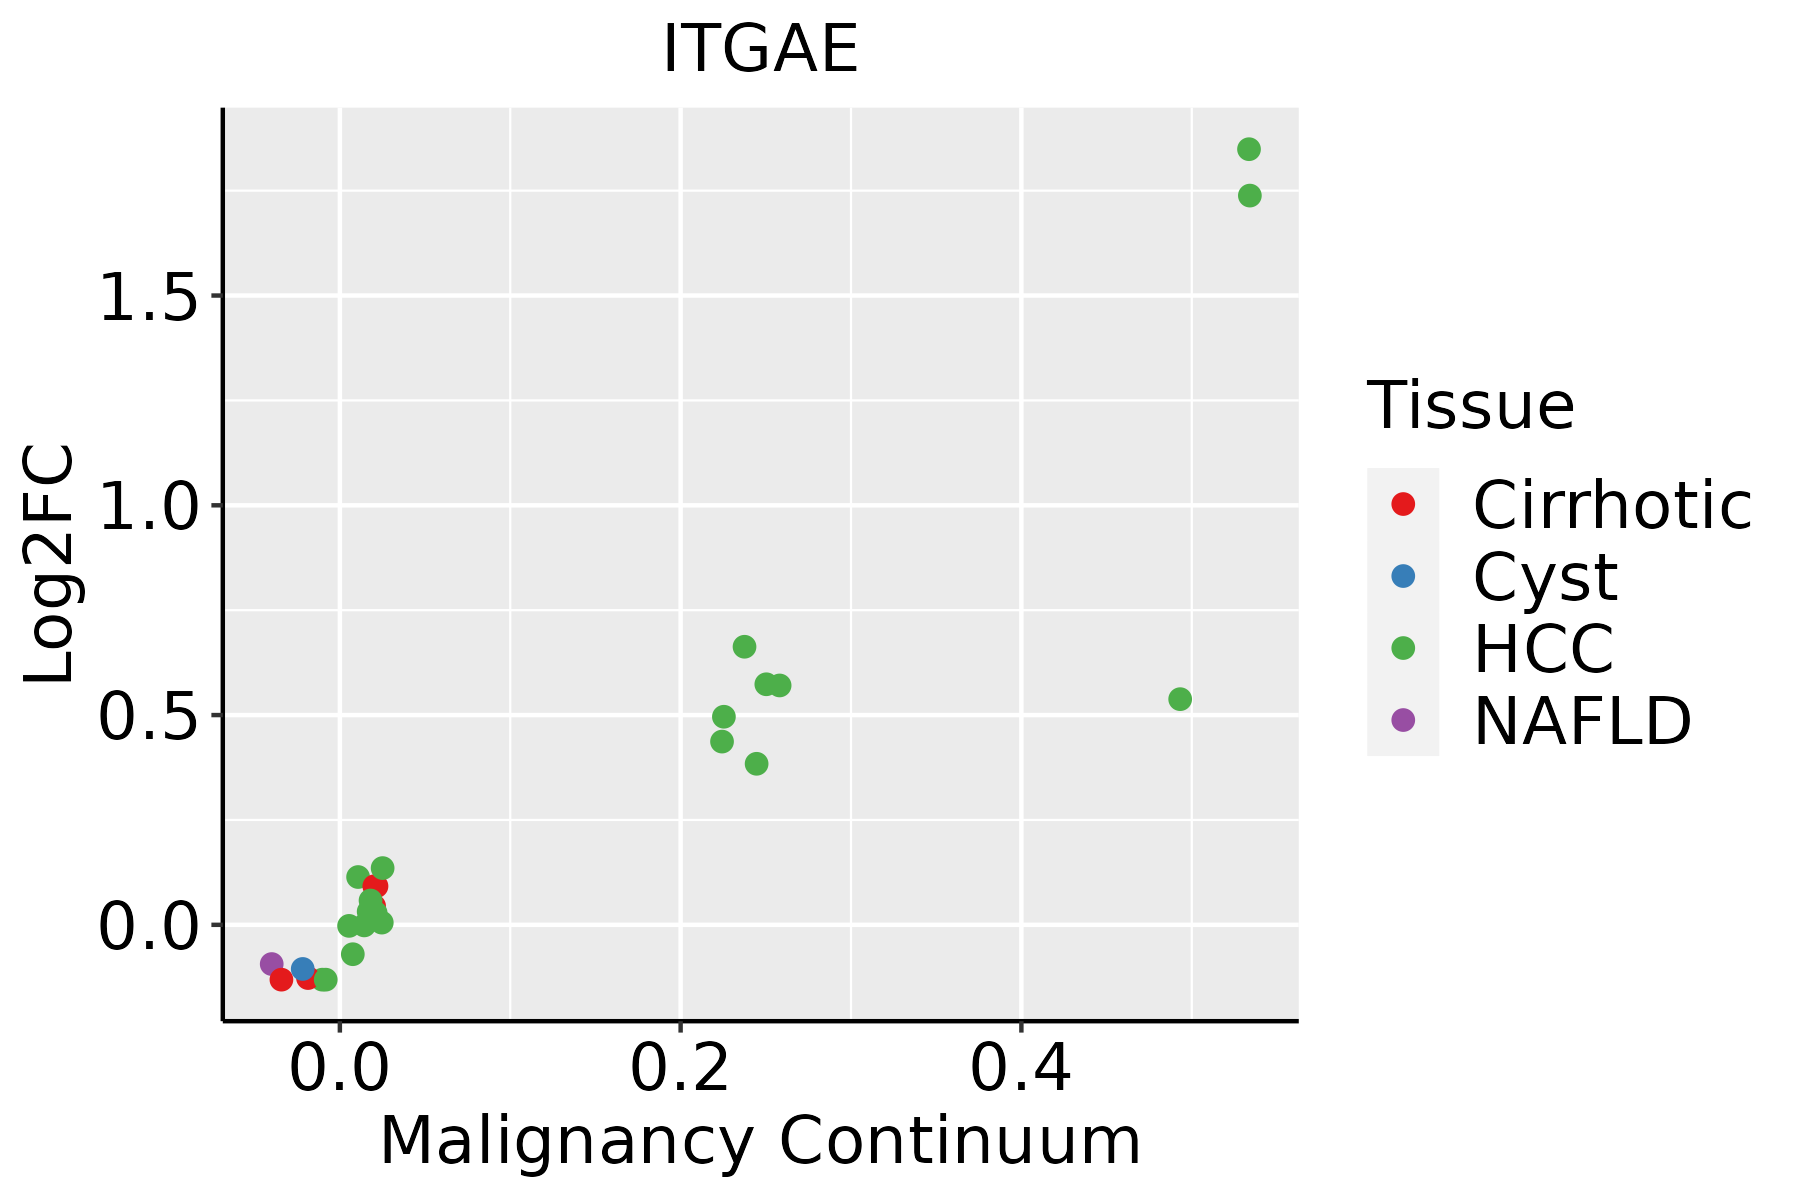 | HCC: Hepatocellular carcinoma |
| NAFLD: Non-alcoholic fatty liver disease | ||
| Oral Cavity |  | EOLP: Erosive Oral lichen planus |
| LP: leukoplakia | ||
| NEOLP: Non-erosive oral lichen planus | ||
| OSCC: Oral squamous cell carcinoma | ||
| Skin |  | AK: Actinic keratosis |
| cSCC: Cutaneous squamous cell carcinoma | ||
| SCCIS:squamous cell carcinoma in situ | ||
| Thyroid |  | ATC: Anaplastic thyroid cancer |
| HT: Hashimoto's thyroiditis | ||
| PTC: Papillary thyroid cancer |
| ∗log2FC in expression of this searched gene in stem-like cells from each diseased tissue sample relative to stem-like cells in normal samples in each tissue plotted against the malignancy continuum. Samples are colored based on if they are from different disease stage. |
Top |
Malignant transformation related pathway analysis |
| Find out the enriched GO biological processes and KEGG pathways involved in transition from healthy to precancer to cancer |
| Tissue | Disease Stage | Enriched GO biological Processes |
| Colorectum | AD |  |
| Colorectum | SER |  |
| Colorectum | MSS |  |
| Colorectum | MSI-H |  |
| Colorectum | FAP |  |
| ∗Top 15 enriched GO BP terms are showed in the bar plot of each disease state in each tissue. Each row represents a significant GO biological process which is colored according to the -log10(p.adjust). |
| Page: 1 2 3 4 5 6 7 8 9 |
| GO ID | Tissue | Disease Stage | Description | Gene Ratio | Bg Ratio | pvalue | p.adjust | Count |
| GO:00072299 | Esophagus | ESCC | integrin-mediated signaling pathway | 67/8552 | 107/18723 | 3.03e-04 | 1.81e-03 | 67 |
| GO:000722911 | Liver | Cirrhotic | integrin-mediated signaling pathway | 46/4634 | 107/18723 | 2.66e-05 | 3.42e-04 | 46 |
| GO:00072292 | Liver | HCC | integrin-mediated signaling pathway | 60/7958 | 107/18723 | 3.15e-03 | 1.46e-02 | 60 |
| GO:00072298 | Oral cavity | OSCC | integrin-mediated signaling pathway | 58/7305 | 107/18723 | 1.00e-03 | 5.20e-03 | 58 |
| GO:000722916 | Oral cavity | LP | integrin-mediated signaling pathway | 42/4623 | 107/18723 | 5.96e-04 | 5.46e-03 | 42 |
| GO:000722924 | Skin | cSCC | integrin-mediated signaling pathway | 47/4864 | 107/18723 | 4.21e-05 | 4.43e-04 | 47 |
| GO:000722918 | Thyroid | PTC | integrin-mediated signaling pathway | 55/5968 | 107/18723 | 2.07e-05 | 2.08e-04 | 55 |
| GO:000722919 | Thyroid | ATC | integrin-mediated signaling pathway | 63/6293 | 107/18723 | 7.09e-08 | 1.24e-06 | 63 |
| Page: 1 |
| Pathway ID | Tissue | Disease Stage | Description | Gene Ratio | Bg Ratio | pvalue | p.adjust | qvalue | Count |
| hsa0481028 | Esophagus | ESCC | Regulation of actin cytoskeleton | 133/4205 | 229/8465 | 5.94e-03 | 1.48e-02 | 7.56e-03 | 133 |
| hsa04810112 | Esophagus | ESCC | Regulation of actin cytoskeleton | 133/4205 | 229/8465 | 5.94e-03 | 1.48e-02 | 7.56e-03 | 133 |
| hsa0481021 | Liver | Cirrhotic | Regulation of actin cytoskeleton | 100/2530 | 229/8465 | 5.28e-06 | 5.50e-05 | 3.39e-05 | 100 |
| hsa0481031 | Liver | Cirrhotic | Regulation of actin cytoskeleton | 100/2530 | 229/8465 | 5.28e-06 | 5.50e-05 | 3.39e-05 | 100 |
| hsa0481041 | Liver | HCC | Regulation of actin cytoskeleton | 134/4020 | 229/8465 | 4.48e-04 | 1.94e-03 | 1.08e-03 | 134 |
| hsa0481051 | Liver | HCC | Regulation of actin cytoskeleton | 134/4020 | 229/8465 | 4.48e-04 | 1.94e-03 | 1.08e-03 | 134 |
| hsa0481026 | Oral cavity | OSCC | Regulation of actin cytoskeleton | 129/3704 | 229/8465 | 7.14e-05 | 2.74e-04 | 1.40e-04 | 129 |
| hsa04810111 | Oral cavity | OSCC | Regulation of actin cytoskeleton | 129/3704 | 229/8465 | 7.14e-05 | 2.74e-04 | 1.40e-04 | 129 |
| Page: 1 |
Top |
Cell-cell communication analysis |
| Identification of potential cell-cell interactions between two cell types and their ligand-receptor pairs for different disease states |
| Ligand | Receptor | LRpair | Pathway | Tissue | Disease Stage |
| CDH1 | ITGAE_ITGB7 | CDH1_ITGAE_ITGB7 | CDH1 | Breast | DCIS |
| CDH1 | ITGAE_ITGB7 | CDH1_ITGAE_ITGB7 | CDH1 | Breast | Healthy |
| CDH1 | ITGAE_ITGB7 | CDH1_ITGAE_ITGB7 | CDH1 | Cervix | Precancer |
| CDH1 | ITGAE_ITGB7 | CDH1_ITGAE_ITGB7 | CDH1 | Endometrium | AEH |
| CDH1 | ITGAE_ITGB7 | CDH1_ITGAE_ITGB7 | CDH1 | Endometrium | Healthy |
| CDH1 | ITGAE_ITGB7 | CDH1_ITGAE_ITGB7 | CDH1 | HNSCC | OSCC |
| CDH1 | ITGAE_ITGB7 | CDH1_ITGAE_ITGB7 | CDH1 | HNSCC | Precancer |
| CDH1 | ITGAE_ITGB7 | CDH1_ITGAE_ITGB7 | CDH1 | Liver | HCC |
| CDH1 | ITGAE_ITGB7 | CDH1_ITGAE_ITGB7 | CDH1 | Liver | Precancer |
| CDH1 | ITGAE_ITGB7 | CDH1_ITGAE_ITGB7 | CDH1 | Prostate | BPH |
| CDH1 | ITGAE_ITGB7 | CDH1_ITGAE_ITGB7 | CDH1 | Prostate | Tumor |
| CDH1 | ITGAE_ITGB7 | CDH1_ITGAE_ITGB7 | CDH1 | Skin | ADJ |
| CDH1 | ITGAE_ITGB7 | CDH1_ITGAE_ITGB7 | CDH1 | Skin | cSCC |
| CDH1 | ITGAE_ITGB7 | CDH1_ITGAE_ITGB7 | CDH1 | THCA | Cancer |
| CDH1 | ITGAE_ITGB7 | CDH1_ITGAE_ITGB7 | CDH1 | THCA | PTC |
| Page: 1 |
Top |
Single-cell gene regulatory network inference analysis |
| Find out the significant the regulons (TFs) and the target genes of each regulon across cell types for different disease states |
| TF | Cell Type | Tissue | Disease Stage | Target Gene | RSS | Regulon Activity |
| ∗The dot plots of a searched regulon are shown for all cell subpopulations in each disease state of each tissue based on the regulon specific score inferred using pySCENIC and by calculating the average expression. |
| Page: 1 |
Top |
Somatic mutation of malignant transformation related genes |
| Annotation of somatic variants for genes involved in malignant transformation |
| Hugo Symbol | Variant Class | Variant Classification | dbSNP RS | HGVSc | HGVSp | HGVSp Short | SWISSPROT | BIOTYPE | SIFT | PolyPhen | Tumor Sample Barcode | Tissue | Histology | Sex | Age | Stage | Therapy Types | Drugs | Outcome |
| ITGAE | SNV | Missense_Mutation | rs530702065 | c.1586C>T | p.Thr529Met | p.T529M | P38570 | protein_coding | deleterious(0) | possibly_damaging(0.805) | TCGA-A8-A0A9-01 | Breast | breast invasive carcinoma | Female | >=65 | I/II | Hormone Therapy | anastrozole | SD |
| ITGAE | SNV | Missense_Mutation | rs143859925 | c.769N>T | p.Arg257Trp | p.R257W | P38570 | protein_coding | deleterious(0.01) | possibly_damaging(0.761) | TCGA-AC-A23H-01 | Breast | breast invasive carcinoma | Female | >=65 | I/II | Unknown | Unknown | PD |
| ITGAE | SNV | Missense_Mutation | novel | c.3534N>T | p.Glu1178Asp | p.E1178D | P38570 | protein_coding | tolerated_low_confidence(0.37) | benign(0.001) | TCGA-AN-A046-01 | Breast | breast invasive carcinoma | Female | >=65 | I/II | Unknown | Unknown | SD |
| ITGAE | SNV | Missense_Mutation | novel | c.1759N>A | p.Leu587Ile | p.L587I | P38570 | protein_coding | tolerated(1) | benign(0) | TCGA-AN-A046-01 | Breast | breast invasive carcinoma | Female | >=65 | I/II | Unknown | Unknown | SD |
| ITGAE | SNV | Missense_Mutation | rs530702065 | c.1586N>T | p.Thr529Met | p.T529M | P38570 | protein_coding | deleterious(0) | possibly_damaging(0.805) | TCGA-BH-AB28-01 | Breast | breast invasive carcinoma | Female | <65 | III/IV | Chemotherapy | taxotere | SD |
| ITGAE | insertion | Nonsense_Mutation | novel | c.3242_3243insGTGAGTTCAATAGGGCCTGGAAGGTCAACCCTA | p.Leu1081_Lys1082insTer | p.L1081_K1082ins* | P38570 | protein_coding | TCGA-AN-A0FN-01 | Breast | breast invasive carcinoma | Female | <65 | I/II | Unknown | Unknown | SD | ||
| ITGAE | insertion | Nonsense_Mutation | novel | c.2538_2539insAAACCCTGTTTCTATTAAAAATACAAAAAATTA | p.Val846_Gly847insLysProCysPheTyrTerLysTyrLysLysLeu | p.V846_G847insKPCFY*KYKKL | P38570 | protein_coding | TCGA-B6-A0IK-01 | Breast | breast invasive carcinoma | Female | <65 | III/IV | Unknown | Unknown | PD | ||
| ITGAE | insertion | Frame_Shift_Ins | novel | c.612_613insTCAGCCTCCCG | p.Ile205SerfsTer28 | p.I205Sfs*28 | P38570 | protein_coding | TCGA-B6-A0IK-01 | Breast | breast invasive carcinoma | Female | <65 | III/IV | Unknown | Unknown | PD | ||
| ITGAE | SNV | Missense_Mutation | novel | c.651N>A | p.Asp217Glu | p.D217E | P38570 | protein_coding | deleterious(0) | probably_damaging(0.953) | TCGA-C5-A2LV-01 | Cervix | cervical & endocervical cancer | Female | <65 | I/II | Unknown | Unknown | SD |
| ITGAE | SNV | Missense_Mutation | c.1003G>A | p.Glu335Lys | p.E335K | P38570 | protein_coding | deleterious(0.04) | benign(0.205) | TCGA-DS-A0VK-01 | Cervix | cervical & endocervical cancer | Female | <65 | I/II | Chemotherapy | carboplatin | PD |
| Page: 1 2 3 4 5 6 7 8 9 10 11 12 13 |
Top |
Related drugs of malignant transformation related genes |
| Identification of chemicals and drugs interact with genes involved in malignant transfromation |
| (DGIdb 4.0) |
| Entrez ID | Symbol | Category | Interaction Types | Drug Claim Name | Drug Name | PMIDs |
| Page: 1 |

Copyright 2023-Present -The University of Texas Health Science Center at Houston |