
|
|||||
|
 | |
| |
| |
| |
| |
| |
|
Gene: ITGA9 |
Gene summary for ITGA9 |
| Gene information | Species | Human | Gene symbol | ITGA9 | Gene ID | 3680 |
| Gene name | integrin subunit alpha 9 | |
| Gene Alias | ALPHA-RLC | |
| Cytomap | 3p22.2 | |
| Gene Type | protein-coding | GO ID | GO:0006950 | UniProtAcc | Q13797 |
Top |
Malignant transformation analysis |
| Identification of the aberrant gene expression in precancerous and cancerous lesions by comparing the gene expression of stem-like cells in diseased tissues with normal stem cells |
| Entrez ID | Symbol | Replicates | Species | Organ | Tissue | Adj P-value | Log2FC | Malignancy |
| 3680 | ITGA9 | HTA11_866_3004761011 | Human | Colorectum | AD | 9.90e-04 | 3.35e-01 | 0.096 |
| 3680 | ITGA9 | HTA11_6818_2000001021 | Human | Colorectum | AD | 1.77e-02 | 3.19e-01 | 0.0588 |
| 3680 | ITGA9 | HTA11_99999965104_69814 | Human | Colorectum | MSS | 5.11e-14 | 9.41e-01 | 0.281 |
| 3680 | ITGA9 | F007 | Human | Colorectum | FAP | 4.22e-02 | 5.37e-01 | 0.1176 |
| 3680 | ITGA9 | A002-C-010 | Human | Colorectum | FAP | 1.58e-19 | 7.19e-01 | 0.242 |
| 3680 | ITGA9 | A001-C-207 | Human | Colorectum | FAP | 2.19e-07 | 6.78e-01 | 0.1278 |
| 3680 | ITGA9 | A002-C-203 | Human | Colorectum | FAP | 1.75e-15 | 7.51e-01 | 0.2786 |
| 3680 | ITGA9 | A001-C-108 | Human | Colorectum | FAP | 2.06e-05 | 4.51e-01 | -0.0272 |
| 3680 | ITGA9 | A001-C-104 | Human | Colorectum | FAP | 5.13e-10 | 6.06e-01 | 0.0184 |
| 3680 | ITGA9 | A001-C-014 | Human | Colorectum | FAP | 1.21e-05 | 5.59e-01 | 0.0135 |
| 3680 | ITGA9 | A002-C-016 | Human | Colorectum | FAP | 7.13e-04 | 3.71e-01 | 0.0521 |
| 3680 | ITGA9 | A001-C-007 | Human | Colorectum | CRC | 3.59e-05 | 6.76e-01 | 0.1899 |
| 3680 | ITGA9 | A002-C-116 | Human | Colorectum | FAP | 4.20e-02 | 2.06e-01 | -0.0452 |
| 3680 | ITGA9 | A014-C-008 | Human | Colorectum | FAP | 1.05e-04 | 5.45e-01 | -0.191 |
| 3680 | ITGA9 | F034 | Human | Colorectum | FAP | 1.18e-03 | 3.31e-01 | -0.0665 |
| 3680 | ITGA9 | P12T-E | Human | Esophagus | ESCC | 1.38e-02 | 7.28e-02 | 0.1122 |
| 3680 | ITGA9 | P16T-E | Human | Esophagus | ESCC | 1.00e-31 | 5.42e-01 | 0.1153 |
| 3680 | ITGA9 | P56T-E | Human | Esophagus | ESCC | 1.26e-12 | 1.30e+00 | 0.1613 |
| 3680 | ITGA9 | P76T-E | Human | Esophagus | ESCC | 9.57e-08 | 2.47e-01 | 0.1207 |
| 3680 | ITGA9 | RNA-P25T1-P25T1-1 | Human | Lung | AIS | 1.81e-02 | 2.89e-01 | -0.2116 |
| Page: 1 2 |
| Tissue | Expression Dynamics | Abbreviation |
| Colorectum (GSE201348) |  | FAP: Familial adenomatous polyposis |
| CRC: Colorectal cancer | ||
| Colorectum (HTA11) |  | AD: Adenomas |
| SER: Sessile serrated lesions | ||
| MSI-H: Microsatellite-high colorectal cancer | ||
| MSS: Microsatellite stable colorectal cancer | ||
| Esophagus |  | ESCC: Esophageal squamous cell carcinoma |
| HGIN: High-grade intraepithelial neoplasias | ||
| LGIN: Low-grade intraepithelial neoplasias | ||
| Lung |  | AAH: Atypical adenomatous hyperplasia |
| AIS: Adenocarcinoma in situ | ||
| IAC: Invasive lung adenocarcinoma | ||
| MIA: Minimally invasive adenocarcinoma | ||
| Thyroid | 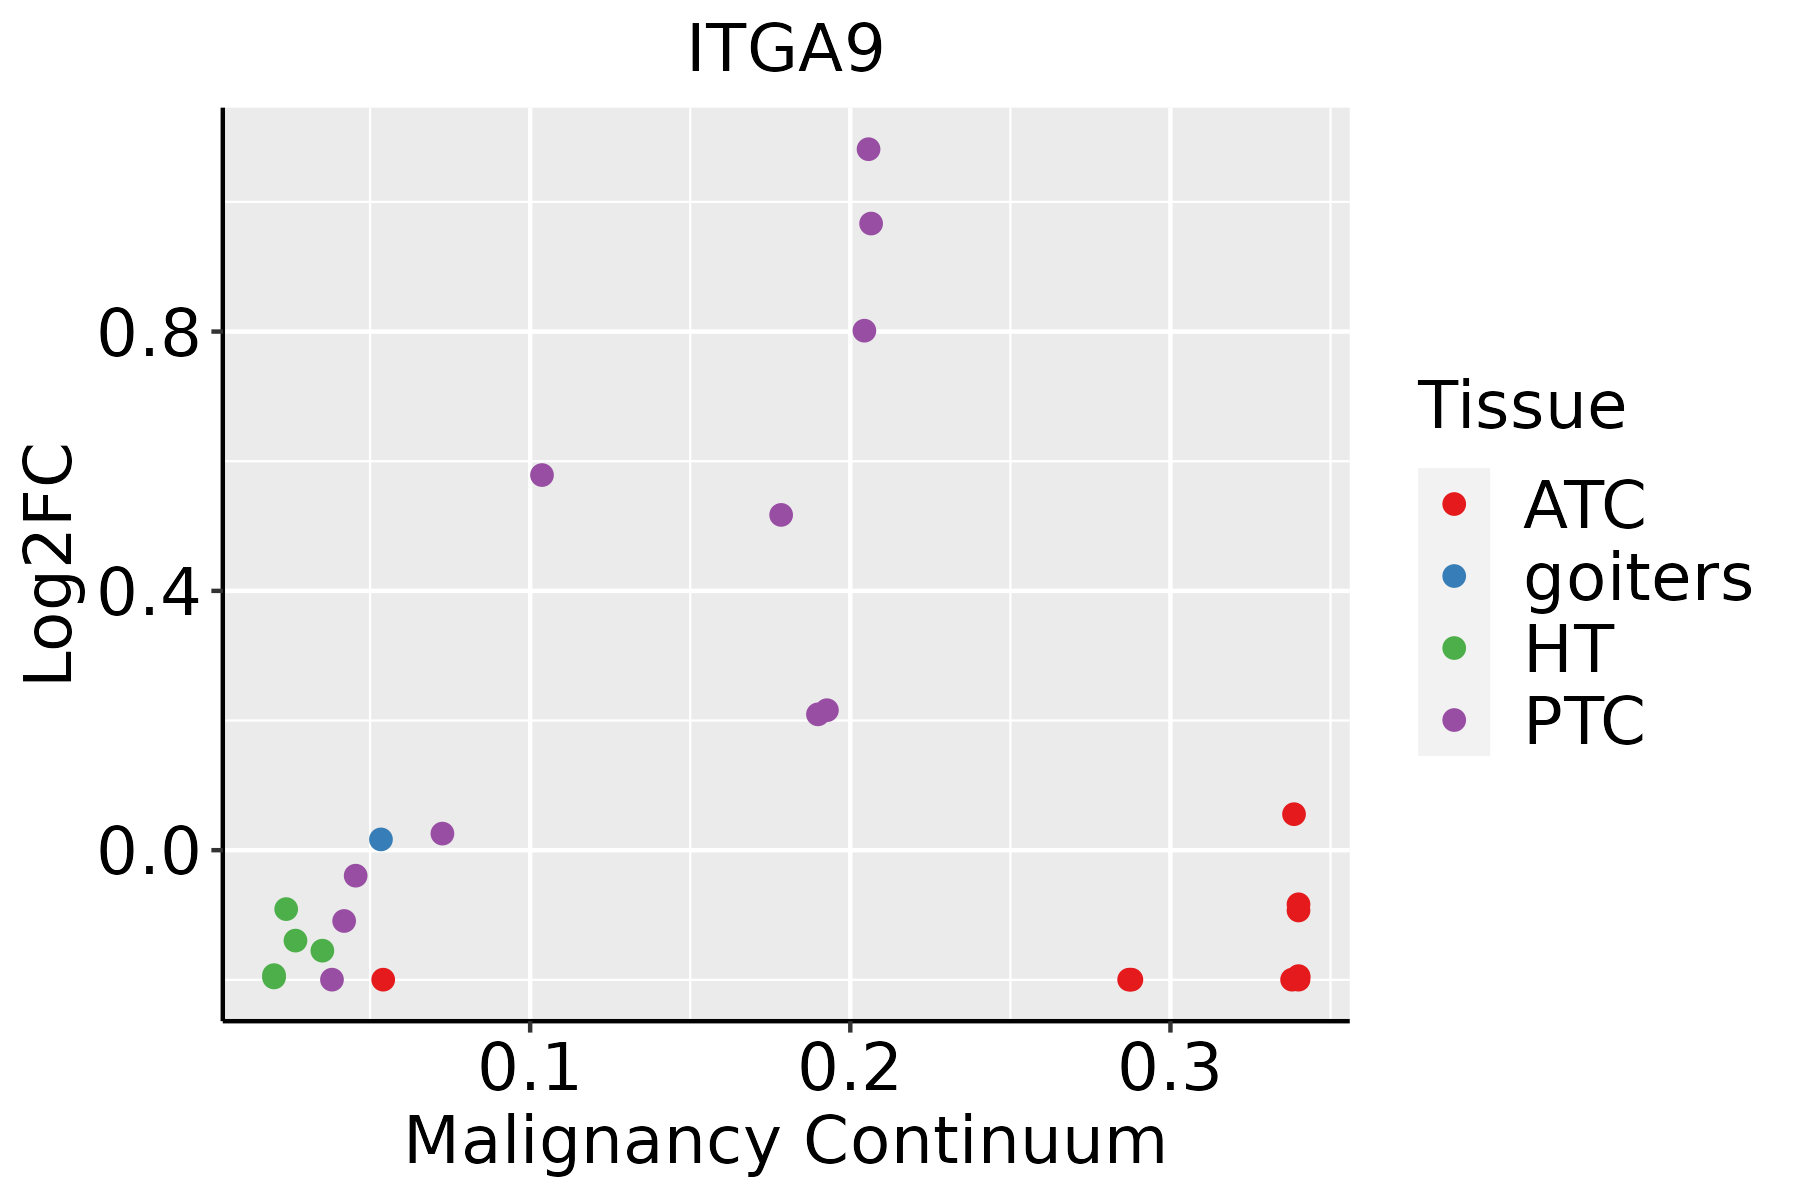 | ATC: Anaplastic thyroid cancer |
| HT: Hashimoto's thyroiditis | ||
| PTC: Papillary thyroid cancer |
| ∗log2FC in expression of this searched gene in stem-like cells from each diseased tissue sample relative to stem-like cells in normal samples in each tissue plotted against the malignancy continuum. Samples are colored based on if they are from different disease stage. |
Top |
Malignant transformation related pathway analysis |
| Find out the enriched GO biological processes and KEGG pathways involved in transition from healthy to precancer to cancer |
| Tissue | Disease Stage | Enriched GO biological Processes |
| Colorectum | AD |  |
| Colorectum | SER |  |
| Colorectum | MSS |  |
| Colorectum | MSI-H |  |
| Colorectum | FAP |  |
| ∗Top 15 enriched GO BP terms are showed in the bar plot of each disease state in each tissue. Each row represents a significant GO biological process which is colored according to the -log10(p.adjust). |
| Page: 1 2 3 4 5 6 7 8 9 |
| GO ID | Tissue | Disease Stage | Description | Gene Ratio | Bg Ratio | pvalue | p.adjust | Count |
| GO:0042060 | Colorectum | AD | wound healing | 128/3918 | 422/18723 | 2.73e-06 | 7.89e-05 | 128 |
| GO:00420602 | Colorectum | MSS | wound healing | 119/3467 | 422/18723 | 5.93e-07 | 2.24e-05 | 119 |
| GO:00420604 | Colorectum | FAP | wound healing | 99/2622 | 422/18723 | 9.50e-08 | 6.33e-06 | 99 |
| GO:0007229 | Colorectum | FAP | integrin-mediated signaling pathway | 30/2622 | 107/18723 | 1.10e-04 | 1.81e-03 | 30 |
| GO:00420605 | Colorectum | CRC | wound healing | 80/2078 | 422/18723 | 1.06e-06 | 6.54e-05 | 80 |
| GO:00072291 | Colorectum | CRC | integrin-mediated signaling pathway | 24/2078 | 107/18723 | 5.65e-04 | 7.79e-03 | 24 |
| GO:004206027 | Esophagus | ESCC | wound healing | 243/8552 | 422/18723 | 4.62e-07 | 6.25e-06 | 243 |
| GO:00072299 | Esophagus | ESCC | integrin-mediated signaling pathway | 67/8552 | 107/18723 | 3.03e-04 | 1.81e-03 | 67 |
| GO:00072294 | Lung | IAC | integrin-mediated signaling pathway | 28/2061 | 107/18723 | 9.18e-06 | 3.06e-04 | 28 |
| GO:00420608 | Lung | IAC | wound healing | 76/2061 | 422/18723 | 1.01e-05 | 3.23e-04 | 76 |
| GO:000722912 | Lung | AIS | integrin-mediated signaling pathway | 28/1849 | 107/18723 | 1.11e-06 | 7.51e-05 | 28 |
| GO:004206013 | Lung | AIS | wound healing | 71/1849 | 422/18723 | 5.32e-06 | 2.52e-04 | 71 |
| GO:004206023 | Lung | MIAC | wound healing | 41/967 | 422/18723 | 7.92e-05 | 3.66e-03 | 41 |
| GO:000722921 | Lung | MIAC | integrin-mediated signaling pathway | 13/967 | 107/18723 | 3.46e-03 | 4.43e-02 | 13 |
| GO:0042060112 | Thyroid | PTC | wound healing | 190/5968 | 422/18723 | 7.72e-09 | 1.92e-07 | 190 |
| GO:000722918 | Thyroid | PTC | integrin-mediated signaling pathway | 55/5968 | 107/18723 | 2.07e-05 | 2.08e-04 | 55 |
| GO:004206034 | Thyroid | ATC | wound healing | 210/6293 | 422/18723 | 3.33e-12 | 1.37e-10 | 210 |
| GO:000722919 | Thyroid | ATC | integrin-mediated signaling pathway | 63/6293 | 107/18723 | 7.09e-08 | 1.24e-06 | 63 |
| Page: 1 |
| Pathway ID | Tissue | Disease Stage | Description | Gene Ratio | Bg Ratio | pvalue | p.adjust | qvalue | Count |
| hsa04510 | Colorectum | AD | Focal adhesion | 67/2092 | 203/8465 | 4.40e-03 | 2.17e-02 | 1.38e-02 | 67 |
| hsa045101 | Colorectum | AD | Focal adhesion | 67/2092 | 203/8465 | 4.40e-03 | 2.17e-02 | 1.38e-02 | 67 |
| hsa048104 | Colorectum | MSS | Regulation of actin cytoskeleton | 68/1875 | 229/8465 | 4.27e-03 | 1.86e-02 | 1.14e-02 | 68 |
| hsa048105 | Colorectum | MSS | Regulation of actin cytoskeleton | 68/1875 | 229/8465 | 4.27e-03 | 1.86e-02 | 1.14e-02 | 68 |
| hsa045102 | Colorectum | FAP | Focal adhesion | 61/1404 | 203/8465 | 1.03e-06 | 2.15e-05 | 1.31e-05 | 61 |
| hsa048106 | Colorectum | FAP | Regulation of actin cytoskeleton | 65/1404 | 229/8465 | 4.07e-06 | 5.91e-05 | 3.59e-05 | 65 |
| hsa05412 | Colorectum | FAP | Arrhythmogenic right ventricular cardiomyopathy | 23/1404 | 77/8465 | 2.58e-03 | 1.19e-02 | 7.23e-03 | 23 |
| hsa04151 | Colorectum | FAP | PI3K-Akt signaling pathway | 75/1404 | 354/8465 | 1.23e-02 | 4.19e-02 | 2.55e-02 | 75 |
| hsa045103 | Colorectum | FAP | Focal adhesion | 61/1404 | 203/8465 | 1.03e-06 | 2.15e-05 | 1.31e-05 | 61 |
| hsa048107 | Colorectum | FAP | Regulation of actin cytoskeleton | 65/1404 | 229/8465 | 4.07e-06 | 5.91e-05 | 3.59e-05 | 65 |
| hsa054121 | Colorectum | FAP | Arrhythmogenic right ventricular cardiomyopathy | 23/1404 | 77/8465 | 2.58e-03 | 1.19e-02 | 7.23e-03 | 23 |
| hsa041511 | Colorectum | FAP | PI3K-Akt signaling pathway | 75/1404 | 354/8465 | 1.23e-02 | 4.19e-02 | 2.55e-02 | 75 |
| hsa045104 | Colorectum | CRC | Focal adhesion | 51/1091 | 203/8465 | 1.29e-06 | 5.41e-05 | 3.66e-05 | 51 |
| hsa048108 | Colorectum | CRC | Regulation of actin cytoskeleton | 52/1091 | 229/8465 | 2.34e-05 | 5.57e-04 | 3.78e-04 | 52 |
| hsa041512 | Colorectum | CRC | PI3K-Akt signaling pathway | 64/1091 | 354/8465 | 2.70e-03 | 1.77e-02 | 1.20e-02 | 64 |
| hsa054122 | Colorectum | CRC | Arrhythmogenic right ventricular cardiomyopathy | 18/1091 | 77/8465 | 7.90e-03 | 3.77e-02 | 2.55e-02 | 18 |
| hsa045105 | Colorectum | CRC | Focal adhesion | 51/1091 | 203/8465 | 1.29e-06 | 5.41e-05 | 3.66e-05 | 51 |
| hsa048109 | Colorectum | CRC | Regulation of actin cytoskeleton | 52/1091 | 229/8465 | 2.34e-05 | 5.57e-04 | 3.78e-04 | 52 |
| hsa041513 | Colorectum | CRC | PI3K-Akt signaling pathway | 64/1091 | 354/8465 | 2.70e-03 | 1.77e-02 | 1.20e-02 | 64 |
| hsa054123 | Colorectum | CRC | Arrhythmogenic right ventricular cardiomyopathy | 18/1091 | 77/8465 | 7.90e-03 | 3.77e-02 | 2.55e-02 | 18 |
| Page: 1 2 3 4 |
Top |
Cell-cell communication analysis |
| Identification of potential cell-cell interactions between two cell types and their ligand-receptor pairs for different disease states |
| Ligand | Receptor | LRpair | Pathway | Tissue | Disease Stage |
| COL1A1 | ITGA9_ITGB1 | COL1A1_ITGA9_ITGB1 | COLLAGEN | Cervix | CC |
| COL1A2 | ITGA9_ITGB1 | COL1A2_ITGA9_ITGB1 | COLLAGEN | Cervix | CC |
| COL4A1 | ITGA9_ITGB1 | COL4A1_ITGA9_ITGB1 | COLLAGEN | Cervix | CC |
| COL4A2 | ITGA9_ITGB1 | COL4A2_ITGA9_ITGB1 | COLLAGEN | Cervix | CC |
| COL4A5 | ITGA9_ITGB1 | COL4A5_ITGA9_ITGB1 | COLLAGEN | Cervix | CC |
| COL6A1 | ITGA9_ITGB1 | COL6A1_ITGA9_ITGB1 | COLLAGEN | Cervix | CC |
| COL6A2 | ITGA9_ITGB1 | COL6A2_ITGA9_ITGB1 | COLLAGEN | Cervix | CC |
| COL6A3 | ITGA9_ITGB1 | COL6A3_ITGA9_ITGB1 | COLLAGEN | Cervix | CC |
| COL9A2 | ITGA9_ITGB1 | COL9A2_ITGA9_ITGB1 | COLLAGEN | Cervix | CC |
| LAMA2 | ITGA9_ITGB1 | LAMA2_ITGA9_ITGB1 | LAMININ | Cervix | CC |
| LAMA3 | ITGA9_ITGB1 | LAMA3_ITGA9_ITGB1 | LAMININ | Cervix | CC |
| LAMA4 | ITGA9_ITGB1 | LAMA4_ITGA9_ITGB1 | LAMININ | Cervix | CC |
| LAMA5 | ITGA9_ITGB1 | LAMA5_ITGA9_ITGB1 | LAMININ | Cervix | CC |
| LAMB1 | ITGA9_ITGB1 | LAMB1_ITGA9_ITGB1 | LAMININ | Cervix | CC |
| LAMB2 | ITGA9_ITGB1 | LAMB2_ITGA9_ITGB1 | LAMININ | Cervix | CC |
| LAMB3 | ITGA9_ITGB1 | LAMB3_ITGA9_ITGB1 | LAMININ | Cervix | CC |
| LAMC1 | ITGA9_ITGB1 | LAMC1_ITGA9_ITGB1 | LAMININ | Cervix | CC |
| LAMC2 | ITGA9_ITGB1 | LAMC2_ITGA9_ITGB1 | LAMININ | Cervix | CC |
| SPP1 | ITGA9_ITGB1 | SPP1_ITGA9_ITGB1 | SPP1 | Cervix | CC |
| TNC | ITGA9_ITGB1 | TNC_ITGA9_ITGB1 | TENASCIN | Cervix | CC |
| Page: 1 |
Top |
Single-cell gene regulatory network inference analysis |
| Find out the significant the regulons (TFs) and the target genes of each regulon across cell types for different disease states |
| TF | Cell Type | Tissue | Disease Stage | Target Gene | RSS | Regulon Activity |
| ∗The dot plots of a searched regulon are shown for all cell subpopulations in each disease state of each tissue based on the regulon specific score inferred using pySCENIC and by calculating the average expression. |
| Page: 1 |
Top |
Somatic mutation of malignant transformation related genes |
| Annotation of somatic variants for genes involved in malignant transformation |
| Hugo Symbol | Variant Class | Variant Classification | dbSNP RS | HGVSc | HGVSp | HGVSp Short | SWISSPROT | BIOTYPE | SIFT | PolyPhen | Tumor Sample Barcode | Tissue | Histology | Sex | Age | Stage | Therapy Types | Drugs | Outcome |
| ITGA9 | SNV | Missense_Mutation | novel | c.934N>A | p.Asp312Asn | p.D312N | Q13797 | protein_coding | deleterious(0) | probably_damaging(0.998) | TCGA-AC-A62V-01 | Breast | breast invasive carcinoma | Male | <65 | III/IV | Targeted Molecular therapy | denosumab | PD |
| ITGA9 | SNV | Missense_Mutation | rs748705361 | c.1391N>T | p.Thr464Met | p.T464M | Q13797 | protein_coding | deleterious(0.03) | probably_damaging(0.978) | TCGA-AN-A046-01 | Breast | breast invasive carcinoma | Female | >=65 | I/II | Unknown | Unknown | SD |
| ITGA9 | SNV | Missense_Mutation | novel | c.2688N>G | p.Ile896Met | p.I896M | Q13797 | protein_coding | tolerated(0.12) | benign(0.039) | TCGA-AN-A046-01 | Breast | breast invasive carcinoma | Female | >=65 | I/II | Unknown | Unknown | SD |
| ITGA9 | SNV | Missense_Mutation | c.1663N>C | p.Cys555Arg | p.C555R | Q13797 | protein_coding | deleterious(0) | probably_damaging(0.999) | TCGA-AO-A128-01 | Breast | breast invasive carcinoma | Female | <65 | I/II | Chemotherapy | doxorubicin | SD | |
| ITGA9 | SNV | Missense_Mutation | c.2206G>A | p.Val736Ile | p.V736I | Q13797 | protein_coding | tolerated(0.34) | benign(0.005) | TCGA-BH-A0BZ-01 | Breast | breast invasive carcinoma | Female | <65 | III/IV | Chemotherapy | doxorubicin | CR | |
| ITGA9 | SNV | Missense_Mutation | c.2158N>A | p.Glu720Lys | p.E720K | Q13797 | protein_coding | tolerated(0.06) | benign(0.001) | TCGA-C8-A12Z-01 | Breast | breast invasive carcinoma | Female | <65 | I/II | Chemotherapy | 5-fluorouracil | CR | |
| ITGA9 | deletion | Frame_Shift_Del | novel | c.2746delN | p.Ile916Ter | p.I916* | Q13797 | protein_coding | TCGA-D8-A27V-01 | Breast | breast invasive carcinoma | Female | <65 | I/II | Hormone Therapy | tamoxiphen | SD | ||
| ITGA9 | deletion | Frame_Shift_Del | novel | c.1180delN | p.Ala395ArgfsTer12 | p.A395Rfs*12 | Q13797 | protein_coding | TCGA-EW-A2FV-01 | Breast | breast invasive carcinoma | Female | <65 | III/IV | Chemotherapy | docetaxel | SD | ||
| ITGA9 | SNV | Missense_Mutation | novel | c.2186A>G | p.His729Arg | p.H729R | Q13797 | protein_coding | tolerated(0.93) | benign(0) | TCGA-2W-A8YY-01 | Cervix | cervical & endocervical cancer | Female | <65 | I/II | Chemotherapy | cisplatin | CR |
| ITGA9 | SNV | Missense_Mutation | novel | c.2200N>C | p.Glu734Gln | p.E734Q | Q13797 | protein_coding | tolerated(0.11) | benign(0.232) | TCGA-GH-A9DA-01 | Cervix | cervical & endocervical cancer | Female | <65 | I/II | Unknown | Unknown | SD |
| Page: 1 2 3 4 5 6 7 8 9 10 11 |
Top |
Related drugs of malignant transformation related genes |
| Identification of chemicals and drugs interact with genes involved in malignant transfromation |
| (DGIdb 4.0) |
| Entrez ID | Symbol | Category | Interaction Types | Drug Claim Name | Drug Name | PMIDs |
| Page: 1 |

Copyright 2023-Present -The University of Texas Health Science Center at Houston |