
|
|||||
|
 | |
| |
| |
| |
| |
| |
|
Gene: ITGA8 |
Gene summary for ITGA8 |
| Gene information | Species | Human | Gene symbol | ITGA8 | Gene ID | 8516 |
| Gene name | integrin subunit alpha 8 | |
| Gene Alias | ITGA8 | |
| Cytomap | 10p13 | |
| Gene Type | protein-coding | GO ID | GO:0000902 | UniProtAcc | B4DN28 |
Top |
Malignant transformation analysis |
| Identification of the aberrant gene expression in precancerous and cancerous lesions by comparing the gene expression of stem-like cells in diseased tissues with normal stem cells |
| Entrez ID | Symbol | Replicates | Species | Organ | Tissue | Adj P-value | Log2FC | Malignancy |
| 8516 | ITGA8 | HCC1 | Human | Liver | HCC | 3.18e-04 | 1.31e+00 | 0.5336 |
| 8516 | ITGA8 | HCC2 | Human | Liver | HCC | 6.25e-06 | 1.00e+00 | 0.5341 |
| 8516 | ITGA8 | HCC5 | Human | Liver | HCC | 6.75e-05 | 5.95e-01 | 0.4932 |
| 8516 | ITGA8 | GSM5353218_PA_PB1B_Pool_1_2_S74_L003 | Human | Prostate | Tumor | 6.49e-08 | 7.77e-01 | 0.1479 |
| 8516 | ITGA8 | GSM5353220_PA_PB1B_Pool_3_S51_L002 | Human | Prostate | Tumor | 1.29e-04 | 6.16e-01 | 0.1531 |
| Page: 1 |
| Tissue | Expression Dynamics | Abbreviation |
| Liver | 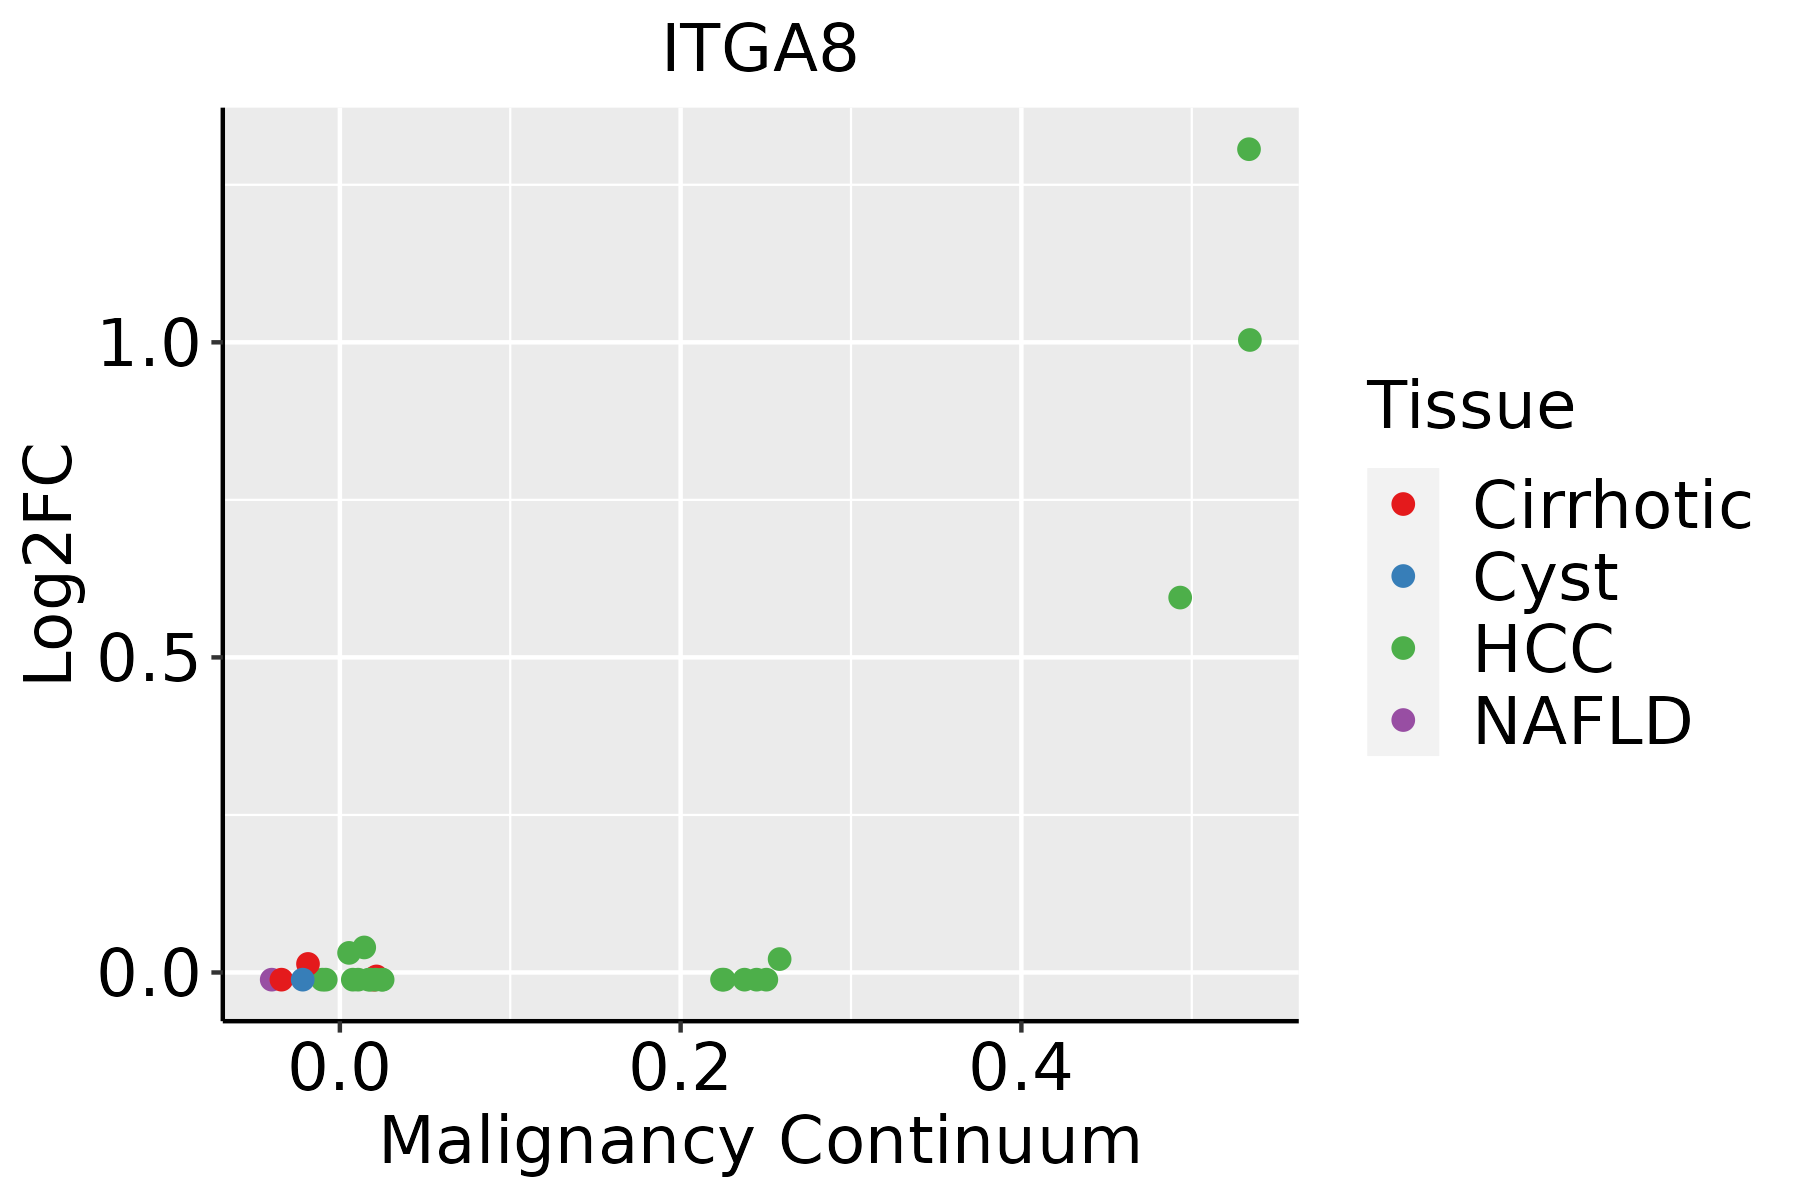 | HCC: Hepatocellular carcinoma |
| NAFLD: Non-alcoholic fatty liver disease | ||
| Prostate | 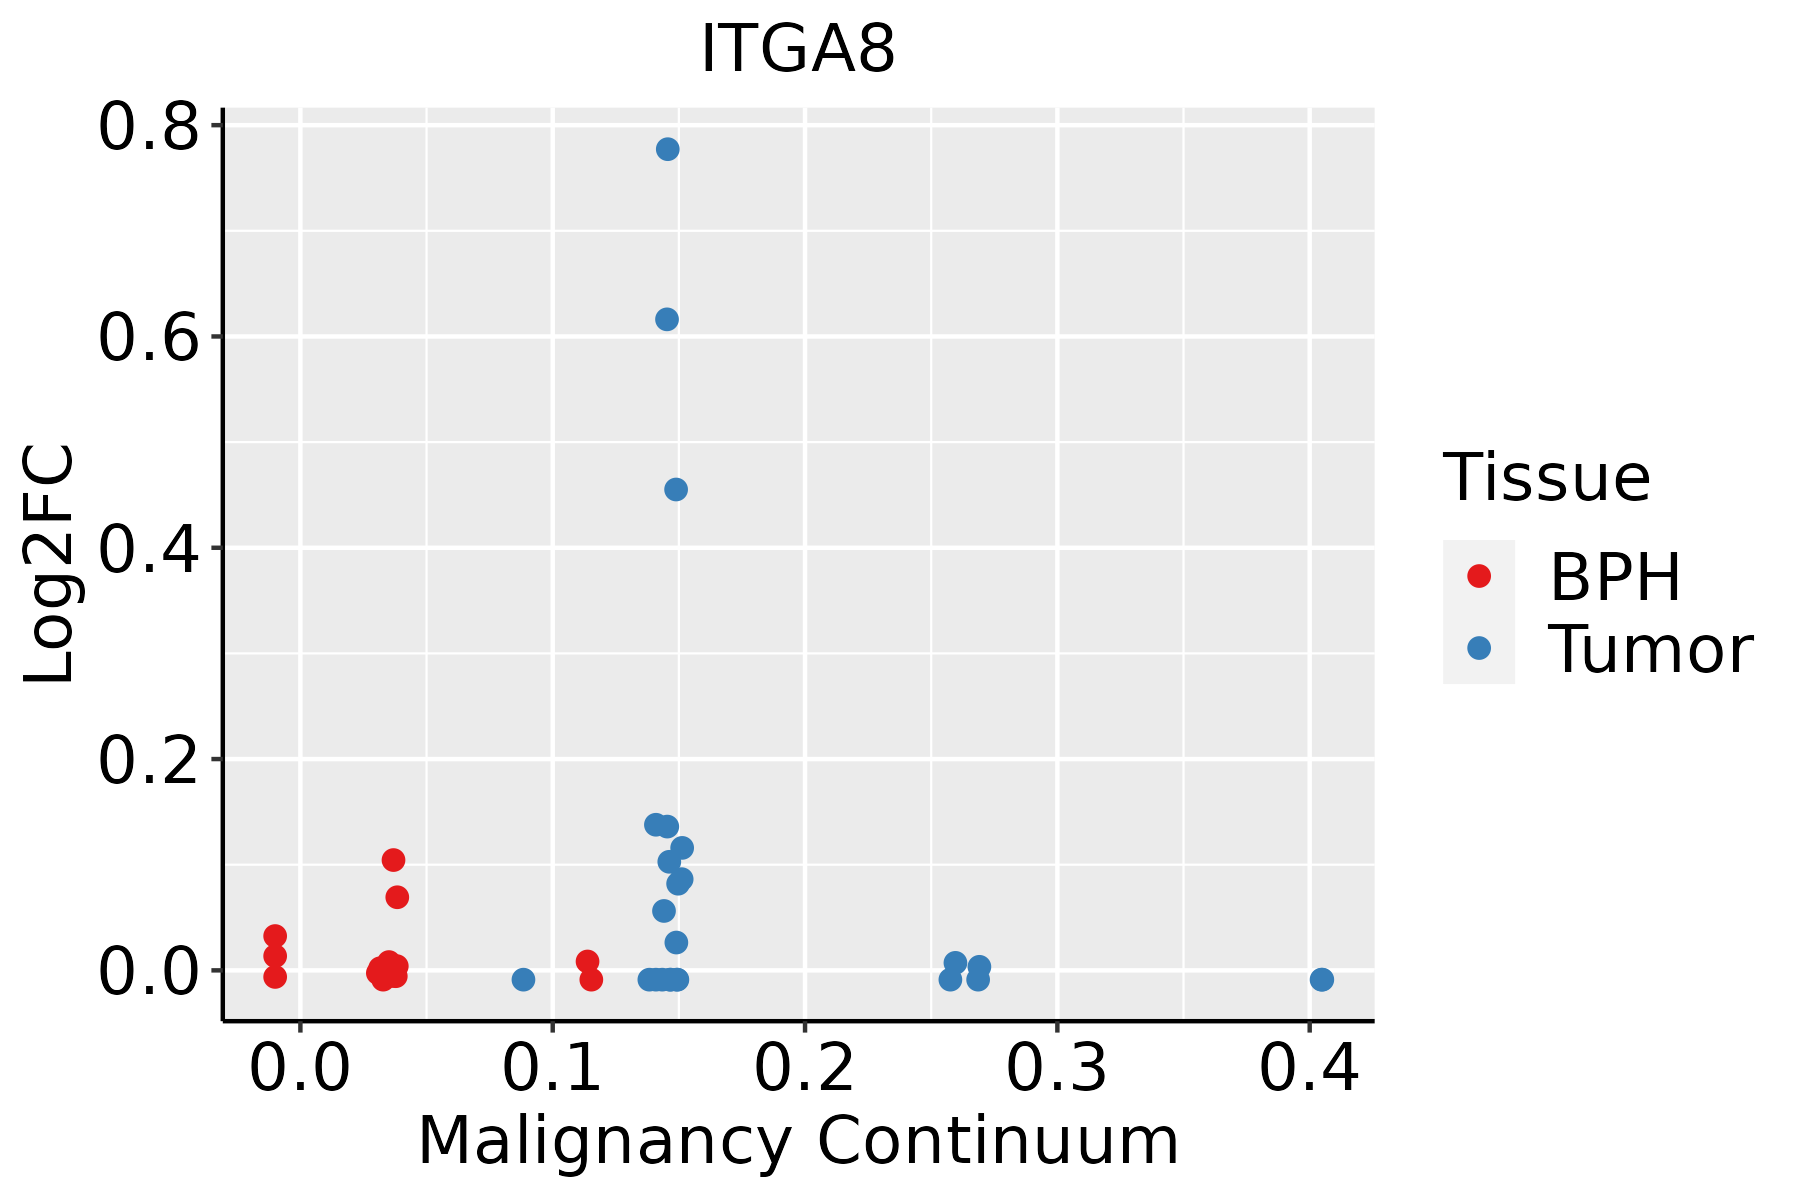 | BPH: Benign Prostatic Hyperplasia |
| ∗log2FC in expression of this searched gene in stem-like cells from each diseased tissue sample relative to stem-like cells in normal samples in each tissue plotted against the malignancy continuum. Samples are colored based on if they are from different disease stage. |
Top |
Malignant transformation related pathway analysis |
| Find out the enriched GO biological processes and KEGG pathways involved in transition from healthy to precancer to cancer |
| Tissue | Disease Stage | Enriched GO biological Processes |
| Colorectum | AD |  |
| Colorectum | SER |  |
| Colorectum | MSS |  |
| Colorectum | MSI-H |  |
| Colorectum | FAP |  |
| ∗Top 15 enriched GO BP terms are showed in the bar plot of each disease state in each tissue. Each row represents a significant GO biological process which is colored according to the -log10(p.adjust). |
| Page: 1 2 3 4 5 6 7 8 9 |
| GO ID | Tissue | Disease Stage | Description | Gene Ratio | Bg Ratio | pvalue | p.adjust | Count |
| GO:003444622 | Liver | HCC | substrate adhesion-dependent cell spreading | 67/7958 | 108/18723 | 3.24e-05 | 3.28e-04 | 67 |
| GO:003158922 | Liver | HCC | cell-substrate adhesion | 188/7958 | 363/18723 | 2.00e-04 | 1.55e-03 | 188 |
| GO:000716021 | Liver | HCC | cell-matrix adhesion | 123/7958 | 233/18723 | 9.34e-04 | 5.47e-03 | 123 |
| GO:00016553 | Liver | HCC | urogenital system development | 170/7958 | 338/18723 | 2.15e-03 | 1.08e-02 | 170 |
| GO:00072292 | Liver | HCC | integrin-mediated signaling pathway | 60/7958 | 107/18723 | 3.15e-03 | 1.46e-02 | 60 |
| GO:00018222 | Liver | HCC | kidney development | 148/7958 | 293/18723 | 3.25e-03 | 1.49e-02 | 148 |
| GO:00720012 | Liver | HCC | renal system development | 152/7958 | 302/18723 | 3.45e-03 | 1.56e-02 | 152 |
| GO:003158916 | Prostate | Tumor | cell-substrate adhesion | 109/3246 | 363/18723 | 1.41e-09 | 6.71e-08 | 109 |
| GO:003444617 | Prostate | Tumor | substrate adhesion-dependent cell spreading | 44/3246 | 108/18723 | 8.25e-09 | 3.15e-07 | 44 |
| GO:000716015 | Prostate | Tumor | cell-matrix adhesion | 71/3246 | 233/18723 | 5.40e-07 | 1.16e-05 | 71 |
| GO:000722915 | Prostate | Tumor | integrin-mediated signaling pathway | 40/3246 | 107/18723 | 5.96e-07 | 1.26e-05 | 40 |
| GO:000165513 | Prostate | Tumor | urogenital system development | 90/3246 | 338/18723 | 1.08e-05 | 1.56e-04 | 90 |
| GO:000736912 | Prostate | Tumor | gastrulation | 52/3246 | 185/18723 | 1.76e-04 | 1.55e-03 | 52 |
| GO:000182213 | Prostate | Tumor | kidney development | 74/3246 | 293/18723 | 3.68e-04 | 2.87e-03 | 74 |
| GO:000170411 | Prostate | Tumor | formation of primary germ layer | 36/3246 | 121/18723 | 5.22e-04 | 3.82e-03 | 36 |
| GO:007200113 | Prostate | Tumor | renal system development | 75/3246 | 302/18723 | 5.74e-04 | 4.13e-03 | 75 |
| Page: 1 |
| Pathway ID | Tissue | Disease Stage | Description | Gene Ratio | Bg Ratio | pvalue | p.adjust | qvalue | Count |
| hsa0451041 | Liver | HCC | Focal adhesion | 125/4020 | 203/8465 | 3.12e-05 | 1.88e-04 | 1.04e-04 | 125 |
| hsa051652 | Liver | HCC | Human papillomavirus infection | 188/4020 | 331/8465 | 3.34e-04 | 1.49e-03 | 8.29e-04 | 188 |
| hsa0481041 | Liver | HCC | Regulation of actin cytoskeleton | 134/4020 | 229/8465 | 4.48e-04 | 1.94e-03 | 1.08e-03 | 134 |
| hsa0451051 | Liver | HCC | Focal adhesion | 125/4020 | 203/8465 | 3.12e-05 | 1.88e-04 | 1.04e-04 | 125 |
| hsa051653 | Liver | HCC | Human papillomavirus infection | 188/4020 | 331/8465 | 3.34e-04 | 1.49e-03 | 8.29e-04 | 188 |
| hsa0481051 | Liver | HCC | Regulation of actin cytoskeleton | 134/4020 | 229/8465 | 4.48e-04 | 1.94e-03 | 1.08e-03 | 134 |
| hsa0451025 | Prostate | Tumor | Focal adhesion | 84/1791 | 203/8465 | 3.44e-11 | 6.69e-10 | 4.15e-10 | 84 |
| hsa0481025 | Prostate | Tumor | Regulation of actin cytoskeleton | 84/1791 | 229/8465 | 3.40e-08 | 4.17e-07 | 2.58e-07 | 84 |
| hsa0516522 | Prostate | Tumor | Human papillomavirus infection | 110/1791 | 331/8465 | 1.31e-07 | 1.51e-06 | 9.36e-07 | 110 |
| hsa0415122 | Prostate | Tumor | PI3K-Akt signaling pathway | 105/1791 | 354/8465 | 7.42e-05 | 5.30e-04 | 3.28e-04 | 105 |
| hsa0451035 | Prostate | Tumor | Focal adhesion | 84/1791 | 203/8465 | 3.44e-11 | 6.69e-10 | 4.15e-10 | 84 |
| hsa0481035 | Prostate | Tumor | Regulation of actin cytoskeleton | 84/1791 | 229/8465 | 3.40e-08 | 4.17e-07 | 2.58e-07 | 84 |
| hsa0516532 | Prostate | Tumor | Human papillomavirus infection | 110/1791 | 331/8465 | 1.31e-07 | 1.51e-06 | 9.36e-07 | 110 |
| hsa0415132 | Prostate | Tumor | PI3K-Akt signaling pathway | 105/1791 | 354/8465 | 7.42e-05 | 5.30e-04 | 3.28e-04 | 105 |
| Page: 1 |
Top |
Cell-cell communication analysis |
| Identification of potential cell-cell interactions between two cell types and their ligand-receptor pairs for different disease states |
| Ligand | Receptor | LRpair | Pathway | Tissue | Disease Stage |
| FN1 | ITGA8_ITGB1 | FN1_ITGA8_ITGB1 | FN1 | Cervix | ADJ |
| TNC | ITGA8_ITGB1 | TNC_ITGA8_ITGB1 | TENASCIN | Cervix | ADJ |
| TNXB | ITGA8_ITGB1 | TNXB_ITGA8_ITGB1 | TENASCIN | Cervix | ADJ |
| FN1 | ITGA8_ITGB1 | FN1_ITGA8_ITGB1 | FN1 | Cervix | CC |
| SPP1 | ITGA8_ITGB1 | SPP1_ITGA8_ITGB1 | SPP1 | Cervix | CC |
| TNC | ITGA8_ITGB1 | TNC_ITGA8_ITGB1 | TENASCIN | Cervix | CC |
| TNXB | ITGA8_ITGB1 | TNXB_ITGA8_ITGB1 | TENASCIN | Cervix | CC |
| FN1 | ITGA8_ITGB1 | FN1_ITGA8_ITGB1 | FN1 | Cervix | Healthy |
| SPP1 | ITGA8_ITGB1 | SPP1_ITGA8_ITGB1 | SPP1 | Cervix | Healthy |
| TNC | ITGA8_ITGB1 | TNC_ITGA8_ITGB1 | TENASCIN | Cervix | Healthy |
| SPP1 | ITGA8_ITGB1 | SPP1_ITGA8_ITGB1 | SPP1 | Cervix | Precancer |
| FN1 | ITGA8_ITGB1 | FN1_ITGA8_ITGB1 | FN1 | Cervix | Precancer |
| TNC | ITGA8_ITGB1 | TNC_ITGA8_ITGB1 | TENASCIN | Cervix | Precancer |
| TNXB | ITGA8_ITGB1 | TNXB_ITGA8_ITGB1 | TENASCIN | Cervix | Precancer |
| TNC | ITGA8_ITGB1 | TNC_ITGA8_ITGB1 | TENASCIN | CRC | MSI-H |
| SPP1 | ITGA8_ITGB1 | SPP1_ITGA8_ITGB1 | SPP1 | CRC | MSI-H |
| FN1 | ITGA8_ITGB1 | FN1_ITGA8_ITGB1 | FN1 | Endometrium | ADJ |
| TNC | ITGA8_ITGB1 | TNC_ITGA8_ITGB1 | TENASCIN | Endometrium | ADJ |
| TNXB | ITGA8_ITGB1 | TNXB_ITGA8_ITGB1 | TENASCIN | Endometrium | ADJ |
| FN1 | ITGA8_ITGB1 | FN1_ITGA8_ITGB1 | FN1 | Endometrium | AEH |
| Page: 1 |
Top |
Single-cell gene regulatory network inference analysis |
| Find out the significant the regulons (TFs) and the target genes of each regulon across cell types for different disease states |
| TF | Cell Type | Tissue | Disease Stage | Target Gene | RSS | Regulon Activity |
| ∗The dot plots of a searched regulon are shown for all cell subpopulations in each disease state of each tissue based on the regulon specific score inferred using pySCENIC and by calculating the average expression. |
| Page: 1 |
Top |
Somatic mutation of malignant transformation related genes |
| Annotation of somatic variants for genes involved in malignant transformation |
| Hugo Symbol | Variant Class | Variant Classification | dbSNP RS | HGVSc | HGVSp | HGVSp Short | SWISSPROT | BIOTYPE | SIFT | PolyPhen | Tumor Sample Barcode | Tissue | Histology | Sex | Age | Stage | Therapy Types | Drugs | Outcome |
| ITGA8 | SNV | Missense_Mutation | novel | c.2923G>C | p.Glu975Gln | p.E975Q | P53708 | protein_coding | tolerated(0.38) | benign(0.005) | TCGA-5L-AAT1-01 | Breast | breast invasive carcinoma | Female | <65 | III/IV | Hormone Therapy | letrozol | SD |
| ITGA8 | SNV | Missense_Mutation | rs751705679 | c.1699N>A | p.Val567Ile | p.V567I | P53708 | protein_coding | tolerated(0.32) | benign(0) | TCGA-A2-A0T3-01 | Breast | breast invasive carcinoma | Female | <65 | I/II | Chemotherapy | adriamycin | SD |
| ITGA8 | SNV | Missense_Mutation | c.608G>T | p.Gly203Val | p.G203V | P53708 | protein_coding | deleterious(0) | probably_damaging(1) | TCGA-A7-A0DA-01 | Breast | breast invasive carcinoma | Female | <65 | I/II | Chemotherapy | adriamycin | SD | |
| ITGA8 | SNV | Missense_Mutation | c.3172G>C | p.Asp1058His | p.D1058H | P53708 | protein_coding | tolerated(0.06) | benign(0.242) | TCGA-AC-A23H-01 | Breast | breast invasive carcinoma | Female | >=65 | I/II | Unknown | Unknown | PD | |
| ITGA8 | SNV | Missense_Mutation | c.1948G>T | p.Asp650Tyr | p.D650Y | P53708 | protein_coding | deleterious(0) | probably_damaging(0.962) | TCGA-AC-A23H-01 | Breast | breast invasive carcinoma | Female | >=65 | I/II | Unknown | Unknown | PD | |
| ITGA8 | SNV | Missense_Mutation | novel | c.2030N>T | p.Arg677Ile | p.R677I | P53708 | protein_coding | deleterious(0.02) | benign(0.159) | TCGA-AN-A046-01 | Breast | breast invasive carcinoma | Female | >=65 | I/II | Unknown | Unknown | SD |
| ITGA8 | SNV | Missense_Mutation | novel | c.1880N>T | p.Arg627Ile | p.R627I | P53708 | protein_coding | tolerated(0.08) | possibly_damaging(0.761) | TCGA-AN-A046-01 | Breast | breast invasive carcinoma | Female | >=65 | I/II | Unknown | Unknown | SD |
| ITGA8 | SNV | Missense_Mutation | novel | c.951N>A | p.Met317Ile | p.M317I | P53708 | protein_coding | deleterious(0) | probably_damaging(0.985) | TCGA-BH-A0HF-01 | Breast | breast invasive carcinoma | Female | >=65 | I/II | Hormone Therapy | arimidex | SD |
| ITGA8 | SNV | Missense_Mutation | novel | c.2258A>G | p.Asn753Ser | p.N753S | P53708 | protein_coding | tolerated(0.14) | benign(0.253) | TCGA-E2-A14T-01 | Breast | breast invasive carcinoma | Female | <65 | I/II | Chemotherapy | doxorubicin | SD |
| ITGA8 | SNV | Missense_Mutation | c.2594N>C | p.Leu865Pro | p.L865P | P53708 | protein_coding | deleterious(0.01) | probably_damaging(0.958) | TCGA-E9-A1N4-01 | Breast | breast invasive carcinoma | Female | <65 | III/IV | Chemotherapy | doxorubicin | SD |
| Page: 1 2 3 4 5 6 7 8 9 10 11 12 13 14 15 16 17 18 19 20 |
Top |
Related drugs of malignant transformation related genes |
| Identification of chemicals and drugs interact with genes involved in malignant transfromation |
| (DGIdb 4.0) |
| Entrez ID | Symbol | Category | Interaction Types | Drug Claim Name | Drug Name | PMIDs |
| Page: 1 |

Copyright 2023-Present -The University of Texas Health Science Center at Houston |