
|
|||||
|
 | |
| |
| |
| |
| |
| |
|
Gene: ITGA7 |
Gene summary for ITGA7 |
| Gene information | Species | Human | Gene symbol | ITGA7 | Gene ID | 3679 |
| Gene name | integrin subunit alpha 7 | |
| Gene Alias | ITGA7 | |
| Cytomap | 12q13.2 | |
| Gene Type | protein-coding | GO ID | GO:0000902 | UniProtAcc | Q13683 |
Top |
Malignant transformation analysis |
| Identification of the aberrant gene expression in precancerous and cancerous lesions by comparing the gene expression of stem-like cells in diseased tissues with normal stem cells |
| Entrez ID | Symbol | Replicates | Species | Organ | Tissue | Adj P-value | Log2FC | Malignancy |
| 3679 | ITGA7 | male-WTA | Human | Thyroid | PTC | 5.85e-06 | 1.23e-01 | 0.1037 |
| 3679 | ITGA7 | PTC01 | Human | Thyroid | PTC | 5.14e-03 | 8.10e-02 | 0.1899 |
| 3679 | ITGA7 | PTC06 | Human | Thyroid | PTC | 4.93e-04 | 1.26e-01 | 0.2057 |
| 3679 | ITGA7 | PTC07 | Human | Thyroid | PTC | 2.56e-04 | 1.33e-01 | 0.2044 |
| 3679 | ITGA7 | ATC13 | Human | Thyroid | ATC | 8.04e-38 | 6.92e-01 | 0.34 |
| 3679 | ITGA7 | ATC5 | Human | Thyroid | ATC | 6.03e-40 | 7.72e-01 | 0.34 |
| Page: 1 |
| Tissue | Expression Dynamics | Abbreviation |
| Thyroid | 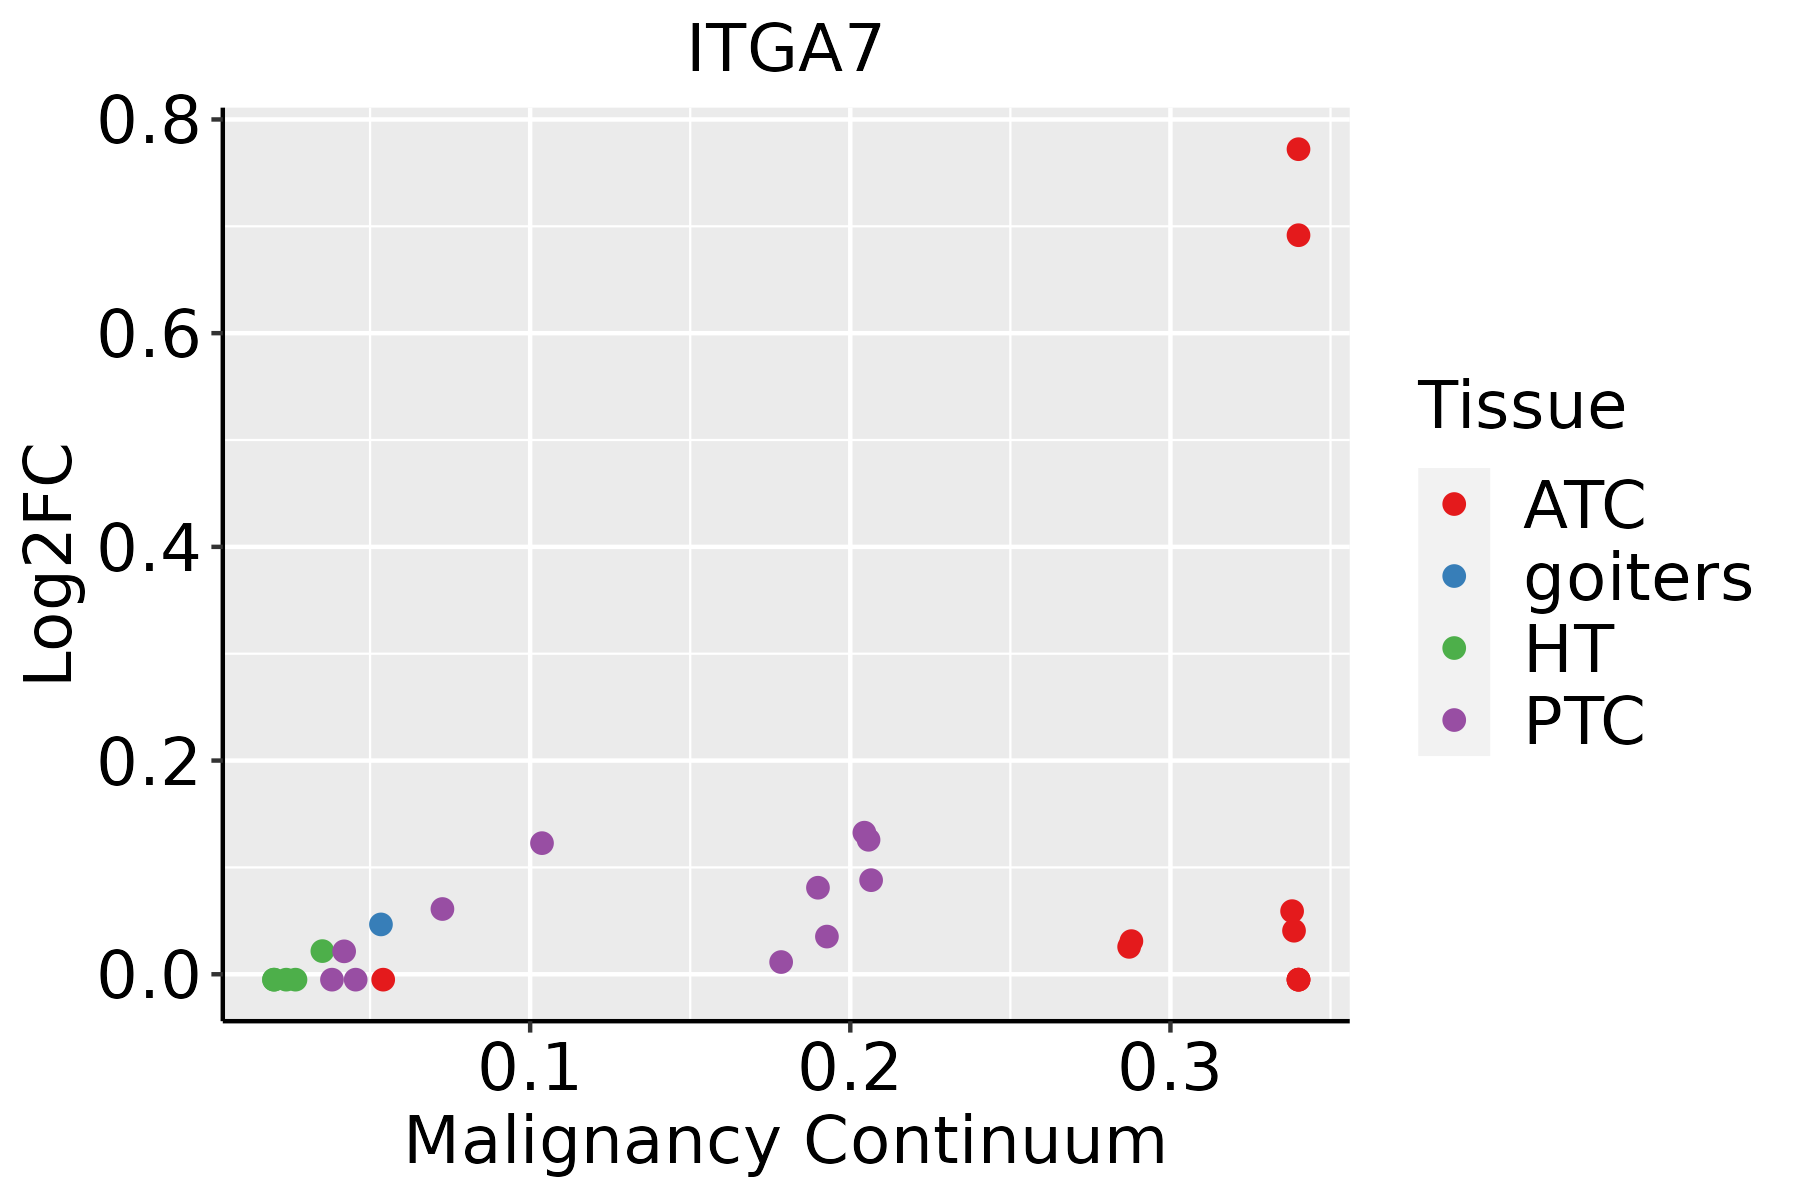 | ATC: Anaplastic thyroid cancer |
| HT: Hashimoto's thyroiditis | ||
| PTC: Papillary thyroid cancer |
| ∗log2FC in expression of this searched gene in stem-like cells from each diseased tissue sample relative to stem-like cells in normal samples in each tissue plotted against the malignancy continuum. Samples are colored based on if they are from different disease stage. |
Top |
Malignant transformation related pathway analysis |
| Find out the enriched GO biological processes and KEGG pathways involved in transition from healthy to precancer to cancer |
| Tissue | Disease Stage | Enriched GO biological Processes |
| Colorectum | AD |  |
| Colorectum | SER |  |
| Colorectum | MSS |  |
| Colorectum | MSI-H |  |
| Colorectum | FAP |  |
| ∗Top 15 enriched GO BP terms are showed in the bar plot of each disease state in each tissue. Each row represents a significant GO biological process which is colored according to the -log10(p.adjust). |
| Page: 1 2 3 4 5 6 7 8 9 |
| GO ID | Tissue | Disease Stage | Description | Gene Ratio | Bg Ratio | pvalue | p.adjust | Count |
| GO:0022604112 | Thyroid | PTC | regulation of cell morphogenesis | 165/5968 | 309/18723 | 2.60e-15 | 1.82e-13 | 165 |
| GO:0008360111 | Thyroid | PTC | regulation of cell shape | 86/5968 | 154/18723 | 6.22e-10 | 1.95e-08 | 86 |
| GO:0031589111 | Thyroid | PTC | cell-substrate adhesion | 169/5968 | 363/18723 | 2.73e-09 | 7.57e-08 | 169 |
| GO:000716020 | Thyroid | PTC | cell-matrix adhesion | 109/5968 | 233/18723 | 1.28e-06 | 1.84e-05 | 109 |
| GO:000722918 | Thyroid | PTC | integrin-mediated signaling pathway | 55/5968 | 107/18723 | 2.07e-05 | 2.08e-04 | 55 |
| GO:000736910 | Thyroid | PTC | gastrulation | 84/5968 | 185/18723 | 7.58e-05 | 6.52e-04 | 84 |
| GO:00017046 | Thyroid | PTC | formation of primary germ layer | 57/5968 | 121/18723 | 3.23e-04 | 2.23e-03 | 57 |
| GO:000749213 | Thyroid | PTC | endoderm development | 39/5968 | 77/18723 | 4.64e-04 | 3.06e-03 | 39 |
| GO:00017066 | Thyroid | PTC | endoderm formation | 29/5968 | 54/18723 | 7.17e-04 | 4.48e-03 | 29 |
| GO:00359875 | Thyroid | PTC | endodermal cell differentiation | 24/5968 | 45/18723 | 2.28e-03 | 1.20e-02 | 24 |
| GO:003158928 | Thyroid | ATC | cell-substrate adhesion | 195/6293 | 363/18723 | 1.58e-15 | 1.17e-13 | 195 |
| GO:002260429 | Thyroid | ATC | regulation of cell morphogenesis | 171/6293 | 309/18723 | 2.36e-15 | 1.70e-13 | 171 |
| GO:0007160111 | Thyroid | ATC | cell-matrix adhesion | 128/6293 | 233/18723 | 1.49e-11 | 5.41e-10 | 128 |
| GO:000836026 | Thyroid | ATC | regulation of cell shape | 91/6293 | 154/18723 | 7.33e-11 | 2.31e-09 | 91 |
| GO:000722919 | Thyroid | ATC | integrin-mediated signaling pathway | 63/6293 | 107/18723 | 7.09e-08 | 1.24e-06 | 63 |
| GO:000736915 | Thyroid | ATC | gastrulation | 90/6293 | 185/18723 | 1.54e-05 | 1.43e-04 | 90 |
| GO:003598712 | Thyroid | ATC | endodermal cell differentiation | 28/6293 | 45/18723 | 7.91e-05 | 5.95e-04 | 28 |
| GO:000170612 | Thyroid | ATC | endoderm formation | 32/6293 | 54/18723 | 9.72e-05 | 7.10e-04 | 32 |
| GO:000749222 | Thyroid | ATC | endoderm development | 42/6293 | 77/18723 | 1.24e-04 | 8.82e-04 | 42 |
| GO:000170414 | Thyroid | ATC | formation of primary germ layer | 60/6293 | 121/18723 | 1.96e-04 | 1.31e-03 | 60 |
| Page: 1 2 |
| Pathway ID | Tissue | Disease Stage | Description | Gene Ratio | Bg Ratio | pvalue | p.adjust | qvalue | Count |
| Page: 1 |
Top |
Cell-cell communication analysis |
| Identification of potential cell-cell interactions between two cell types and their ligand-receptor pairs for different disease states |
| Ligand | Receptor | LRpair | Pathway | Tissue | Disease Stage |
| LAMA2 | ITGA7_ITGB1 | LAMA2_ITGA7_ITGB1 | LAMININ | Breast | DCIS |
| LAMA3 | ITGA7_ITGB1 | LAMA3_ITGA7_ITGB1 | LAMININ | Breast | DCIS |
| LAMA4 | ITGA7_ITGB1 | LAMA4_ITGA7_ITGB1 | LAMININ | Breast | DCIS |
| LAMB1 | ITGA7_ITGB1 | LAMB1_ITGA7_ITGB1 | LAMININ | Breast | DCIS |
| LAMB2 | ITGA7_ITGB1 | LAMB2_ITGA7_ITGB1 | LAMININ | Breast | DCIS |
| LAMC1 | ITGA7_ITGB1 | LAMC1_ITGA7_ITGB1 | LAMININ | Breast | DCIS |
| LAMA2 | ITGA7_ITGB1 | LAMA2_ITGA7_ITGB1 | LAMININ | Breast | Healthy |
| LAMA3 | ITGA7_ITGB1 | LAMA3_ITGA7_ITGB1 | LAMININ | Breast | Healthy |
| LAMA4 | ITGA7_ITGB1 | LAMA4_ITGA7_ITGB1 | LAMININ | Breast | Healthy |
| LAMB1 | ITGA7_ITGB1 | LAMB1_ITGA7_ITGB1 | LAMININ | Breast | Healthy |
| LAMB2 | ITGA7_ITGB1 | LAMB2_ITGA7_ITGB1 | LAMININ | Breast | Healthy |
| LAMB3 | ITGA7_ITGB1 | LAMB3_ITGA7_ITGB1 | LAMININ | Breast | Healthy |
| LAMC1 | ITGA7_ITGB1 | LAMC1_ITGA7_ITGB1 | LAMININ | Breast | Healthy |
| LAMC2 | ITGA7_ITGB1 | LAMC2_ITGA7_ITGB1 | LAMININ | Breast | Healthy |
| LAMA2 | ITGA7_ITGB1 | LAMA2_ITGA7_ITGB1 | LAMININ | Cervix | ADJ |
| LAMA3 | ITGA7_ITGB1 | LAMA3_ITGA7_ITGB1 | LAMININ | Cervix | ADJ |
| LAMA4 | ITGA7_ITGB1 | LAMA4_ITGA7_ITGB1 | LAMININ | Cervix | ADJ |
| LAMA5 | ITGA7_ITGB1 | LAMA5_ITGA7_ITGB1 | LAMININ | Cervix | ADJ |
| LAMB1 | ITGA7_ITGB1 | LAMB1_ITGA7_ITGB1 | LAMININ | Cervix | ADJ |
| LAMB2 | ITGA7_ITGB1 | LAMB2_ITGA7_ITGB1 | LAMININ | Cervix | ADJ |
| Page: 1 |
Top |
Single-cell gene regulatory network inference analysis |
| Find out the significant the regulons (TFs) and the target genes of each regulon across cell types for different disease states |
| TF | Cell Type | Tissue | Disease Stage | Target Gene | RSS | Regulon Activity |
| ∗The dot plots of a searched regulon are shown for all cell subpopulations in each disease state of each tissue based on the regulon specific score inferred using pySCENIC and by calculating the average expression. |
| Page: 1 |
Top |
Somatic mutation of malignant transformation related genes |
| Annotation of somatic variants for genes involved in malignant transformation |
| Hugo Symbol | Variant Class | Variant Classification | dbSNP RS | HGVSc | HGVSp | HGVSp Short | SWISSPROT | BIOTYPE | SIFT | PolyPhen | Tumor Sample Barcode | Tissue | Histology | Sex | Age | Stage | Therapy Types | Drugs | Outcome |
| ITGA7 | SNV | Missense_Mutation | rs772845920 | c.2351N>A | p.Val784Glu | p.V784E | Q13683 | protein_coding | deleterious(0) | possibly_damaging(0.586) | TCGA-A8-A085-01 | Breast | breast invasive carcinoma | Male | <65 | I/II | Hormone Therapy | tamoxiphen | SD |
| ITGA7 | SNV | Missense_Mutation | c.2914N>C | p.Asp972His | p.D972H | Q13683 | protein_coding | deleterious(0) | probably_damaging(0.975) | TCGA-A8-A094-01 | Breast | breast invasive carcinoma | Female | >=65 | I/II | Unknown | Unknown | SD | |
| ITGA7 | SNV | Missense_Mutation | c.385N>T | p.Arg129Trp | p.R129W | Q13683 | protein_coding | deleterious(0) | possibly_damaging(0.84) | TCGA-A8-A094-01 | Breast | breast invasive carcinoma | Female | >=65 | I/II | Unknown | Unknown | SD | |
| ITGA7 | SNV | Missense_Mutation | c.1477N>A | p.Asp493Asn | p.D493N | Q13683 | protein_coding | deleterious(0.03) | probably_damaging(0.97) | TCGA-AO-A03P-01 | Breast | breast invasive carcinoma | Female | <65 | I/II | Hormone Therapy | letrozole | PD | |
| ITGA7 | SNV | Missense_Mutation | novel | c.2803N>C | p.Ser935Arg | p.S935R | Q13683 | protein_coding | tolerated(0.11) | benign(0.386) | TCGA-BH-A0BP-01 | Breast | breast invasive carcinoma | Female | >=65 | I/II | Unknown | Unknown | SD |
| ITGA7 | insertion | Frame_Shift_Ins | novel | c.2989_2990insTCGAGACCAGCCTGGACAACATGGTGAAA | p.Ser997PhefsTer14 | p.S997Ffs*14 | Q13683 | protein_coding | TCGA-A8-A06X-01 | Breast | breast invasive carcinoma | Female | >=65 | I/II | Unknown | Unknown | SD | ||
| ITGA7 | insertion | In_Frame_Ins | novel | c.2998_2999insAAATCA | p.Val1000delinsGluIleMet | p.V1000delinsEIM | Q13683 | protein_coding | TCGA-A8-A07J-01 | Breast | breast invasive carcinoma | Female | <65 | I/II | Chemotherapy | 5-fluorouracil | CR | ||
| ITGA7 | insertion | Frame_Shift_Ins | novel | c.2997_2998insAAAAA | p.Val1000LysfsTer3 | p.V1000Kfs*3 | Q13683 | protein_coding | TCGA-A8-A07J-01 | Breast | breast invasive carcinoma | Female | <65 | I/II | Chemotherapy | 5-fluorouracil | CR | ||
| ITGA7 | insertion | Frame_Shift_Ins | novel | c.2349_2350insAA | p.Val784LysfsTer2 | p.V784Kfs*2 | Q13683 | protein_coding | TCGA-A8-A085-01 | Breast | breast invasive carcinoma | Male | <65 | I/II | Hormone Therapy | tamoxiphen | SD | ||
| ITGA7 | insertion | Nonsense_Mutation | novel | c.373_374insTTCATGTTAAGT | p.Gly125delinsValHisValLysTer | p.G125delinsVHVK* | Q13683 | protein_coding | TCGA-A8-A08H-01 | Breast | breast invasive carcinoma | Female | >=65 | I/II | Unknown | Unknown | SD |
| Page: 1 2 3 4 5 6 7 8 9 10 11 12 13 14 15 |
Top |
Related drugs of malignant transformation related genes |
| Identification of chemicals and drugs interact with genes involved in malignant transfromation |
| (DGIdb 4.0) |
| Entrez ID | Symbol | Category | Interaction Types | Drug Claim Name | Drug Name | PMIDs |
| Page: 1 |

Copyright 2023-Present -The University of Texas Health Science Center at Houston |