
|
|||||
|
 | |
| |
| |
| |
| |
| |
|
Gene: ITGA6 |
Gene summary for ITGA6 |
| Gene information | Species | Human | Gene symbol | ITGA6 | Gene ID | 3655 |
| Gene name | integrin subunit alpha 6 | |
| Gene Alias | CD49f | |
| Cytomap | 2q31.1 | |
| Gene Type | protein-coding | GO ID | GO:0006139 | UniProtAcc | P23229 |
Top |
Malignant transformation analysis |
| Identification of the aberrant gene expression in precancerous and cancerous lesions by comparing the gene expression of stem-like cells in diseased tissues with normal stem cells |
| Entrez ID | Symbol | Replicates | Species | Organ | Tissue | Adj P-value | Log2FC | Malignancy |
| 3655 | ITGA6 | CA_HPV_1 | Human | Cervix | CC | 2.00e-10 | -3.77e-01 | 0.0264 |
| 3655 | ITGA6 | CA_HPV_3 | Human | Cervix | CC | 1.15e-04 | 2.09e-02 | 0.0414 |
| 3655 | ITGA6 | HSIL_HPV_1 | Human | Cervix | HSIL_HPV | 8.12e-08 | -3.68e-01 | 0.0116 |
| 3655 | ITGA6 | CCI_1 | Human | Cervix | CC | 8.35e-12 | 1.58e+00 | 0.528 |
| 3655 | ITGA6 | CCI_2 | Human | Cervix | CC | 1.54e-12 | 1.62e+00 | 0.5249 |
| 3655 | ITGA6 | CCI_3 | Human | Cervix | CC | 8.16e-12 | 1.26e+00 | 0.516 |
| 3655 | ITGA6 | Tumor | Human | Cervix | CC | 2.10e-46 | 8.77e-01 | 0.1241 |
| 3655 | ITGA6 | sample3 | Human | Cervix | CC | 3.33e-51 | 8.70e-01 | 0.1387 |
| 3655 | ITGA6 | H2 | Human | Cervix | HSIL_HPV | 2.52e-03 | 2.85e-01 | 0.0632 |
| 3655 | ITGA6 | L1 | Human | Cervix | CC | 1.79e-05 | -3.47e-01 | 0.0802 |
| 3655 | ITGA6 | T3 | Human | Cervix | CC | 4.46e-55 | 8.49e-01 | 0.1389 |
| 3655 | ITGA6 | HTA11_3410_2000001011 | Human | Colorectum | AD | 1.36e-04 | -3.85e-01 | 0.0155 |
| 3655 | ITGA6 | HTA11_3361_2000001011 | Human | Colorectum | AD | 3.02e-02 | -4.78e-01 | -0.1207 |
| 3655 | ITGA6 | HTA11_1391_2000001011 | Human | Colorectum | AD | 1.56e-08 | 8.51e-01 | -0.059 |
| 3655 | ITGA6 | HTA11_2992_2000001011 | Human | Colorectum | SER | 7.81e-04 | -6.52e-01 | -0.1706 |
| 3655 | ITGA6 | HTA11_5212_2000001011 | Human | Colorectum | AD | 2.64e-07 | -8.15e-01 | -0.2061 |
| 3655 | ITGA6 | HTA11_7696_3000711011 | Human | Colorectum | AD | 1.90e-08 | 7.41e-01 | 0.0674 |
| 3655 | ITGA6 | HTA11_99999965104_69814 | Human | Colorectum | MSS | 4.66e-05 | 5.96e-01 | 0.281 |
| 3655 | ITGA6 | F007 | Human | Colorectum | FAP | 8.44e-04 | 2.10e-01 | 0.1176 |
| 3655 | ITGA6 | A002-C-010 | Human | Colorectum | FAP | 8.96e-17 | 4.05e-01 | 0.242 |
| Page: 1 2 3 4 5 6 7 8 9 10 |
| Tissue | Expression Dynamics | Abbreviation |
| Cervix | 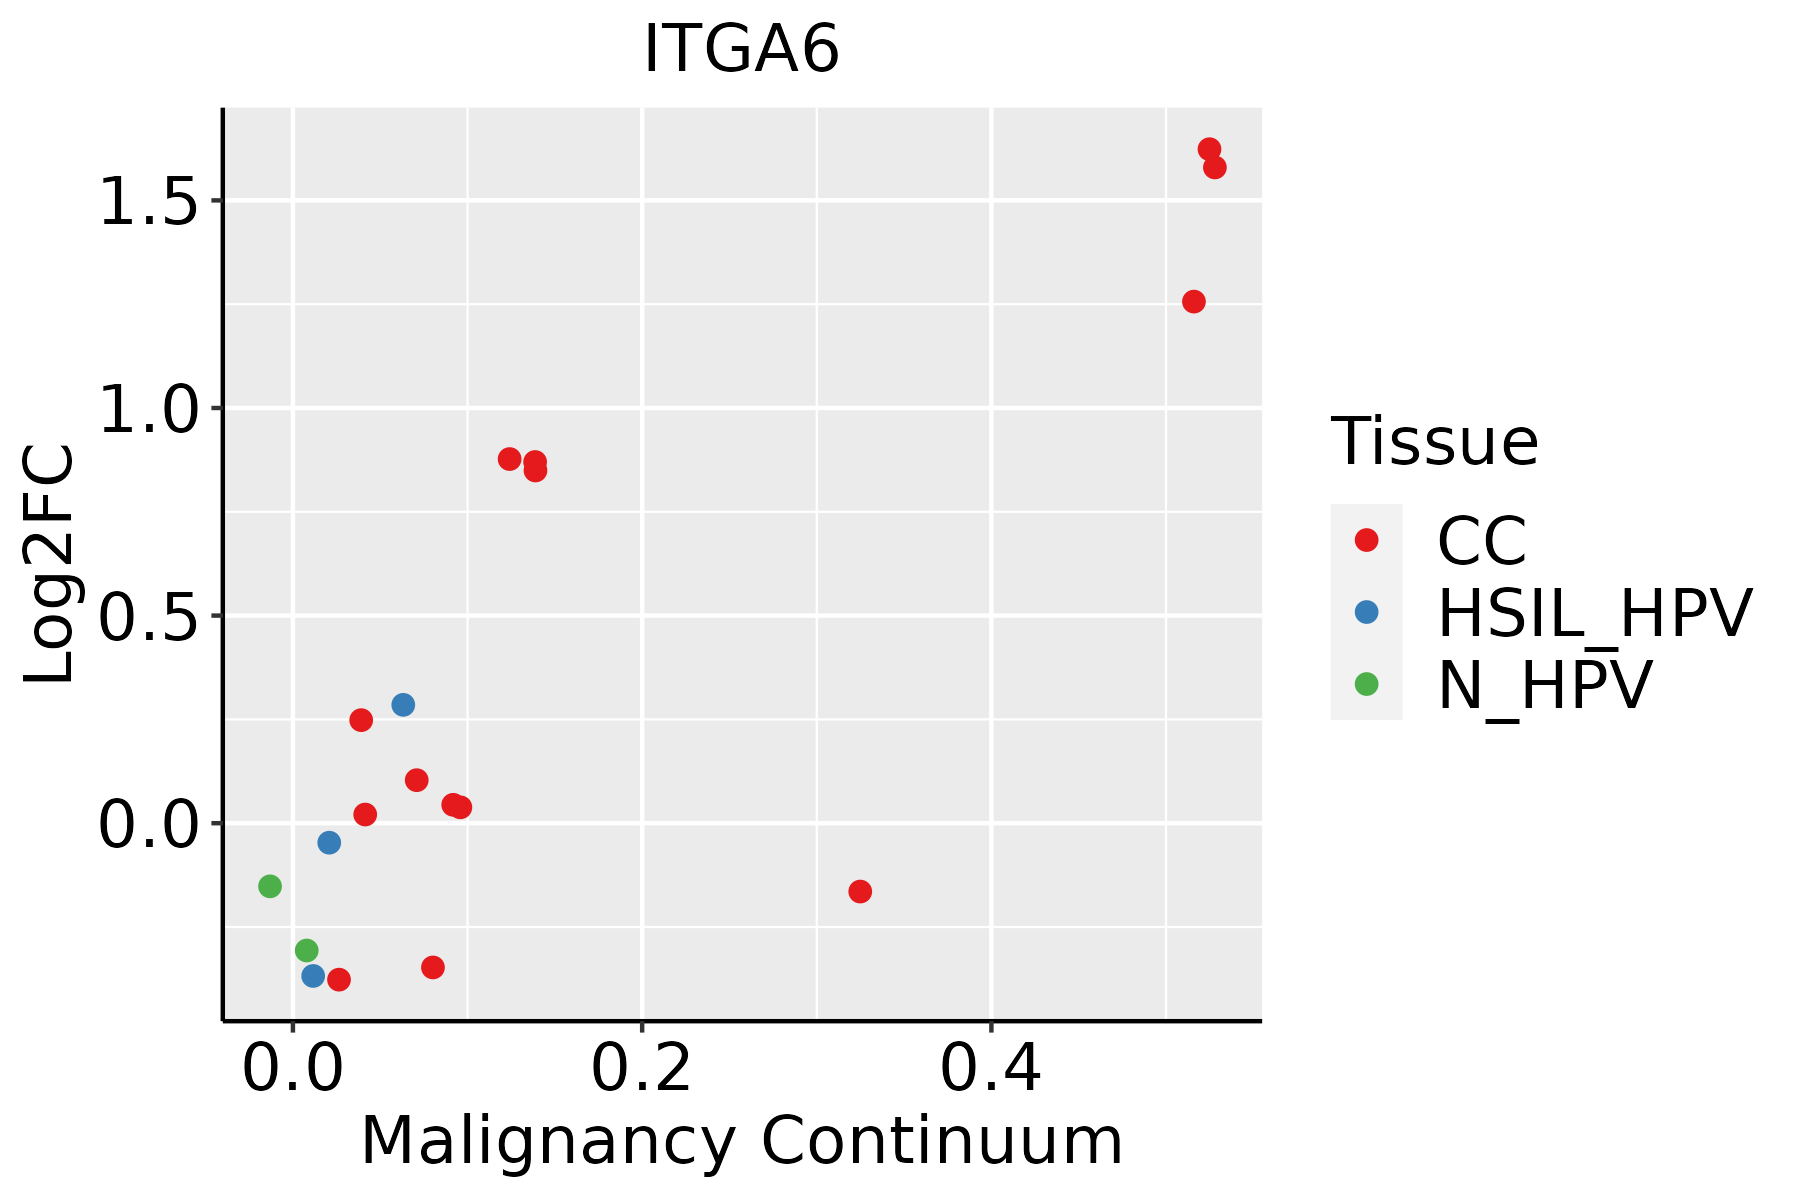 | CC: Cervix cancer |
| HSIL_HPV: HPV-infected high-grade squamous intraepithelial lesions | ||
| N_HPV: HPV-infected normal cervix | ||
| Colorectum (GSE201348) |  | FAP: Familial adenomatous polyposis |
| CRC: Colorectal cancer | ||
| Colorectum (HTA11) |  | AD: Adenomas |
| SER: Sessile serrated lesions | ||
| MSI-H: Microsatellite-high colorectal cancer | ||
| MSS: Microsatellite stable colorectal cancer | ||
| Esophagus | 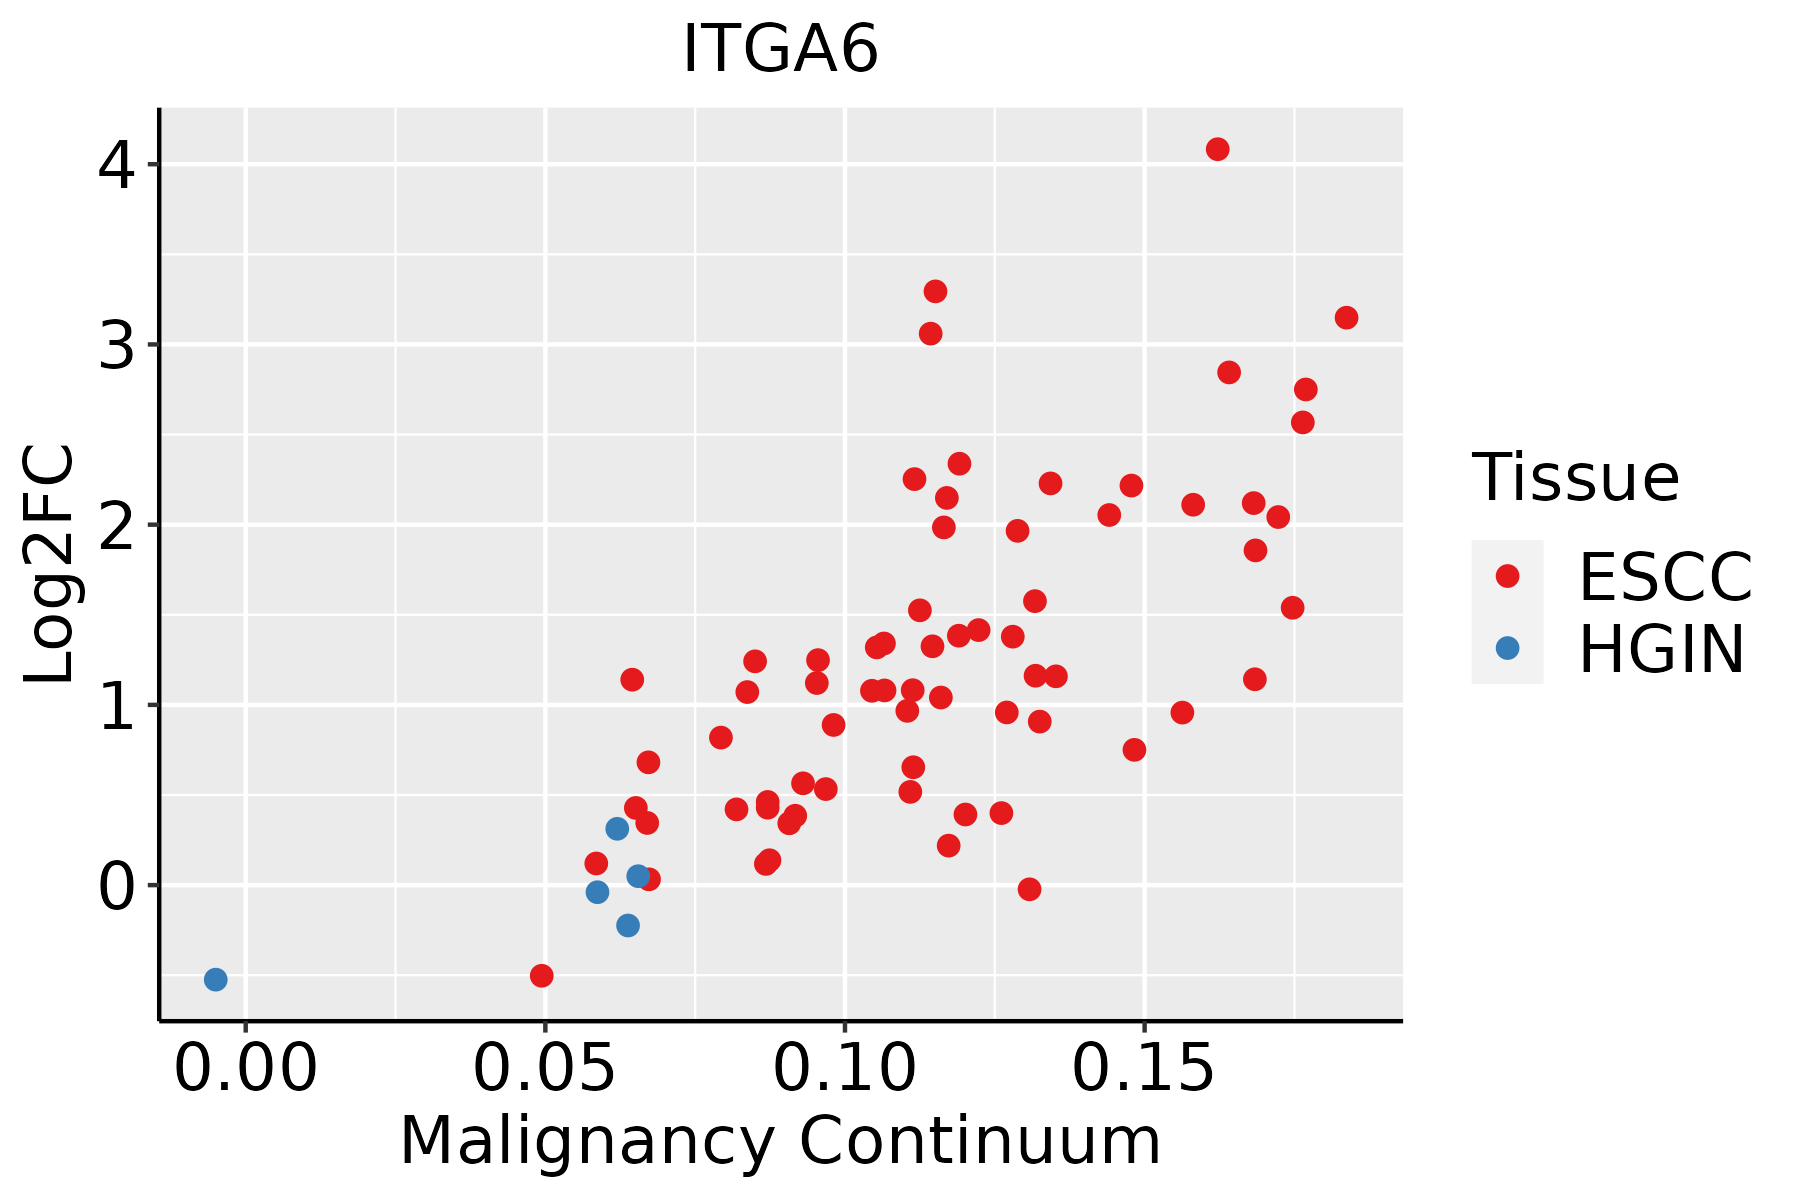 | ESCC: Esophageal squamous cell carcinoma |
| HGIN: High-grade intraepithelial neoplasias | ||
| LGIN: Low-grade intraepithelial neoplasias | ||
| Liver |  | HCC: Hepatocellular carcinoma |
| NAFLD: Non-alcoholic fatty liver disease | ||
| Oral Cavity |  | EOLP: Erosive Oral lichen planus |
| LP: leukoplakia | ||
| NEOLP: Non-erosive oral lichen planus | ||
| OSCC: Oral squamous cell carcinoma | ||
| Prostate | 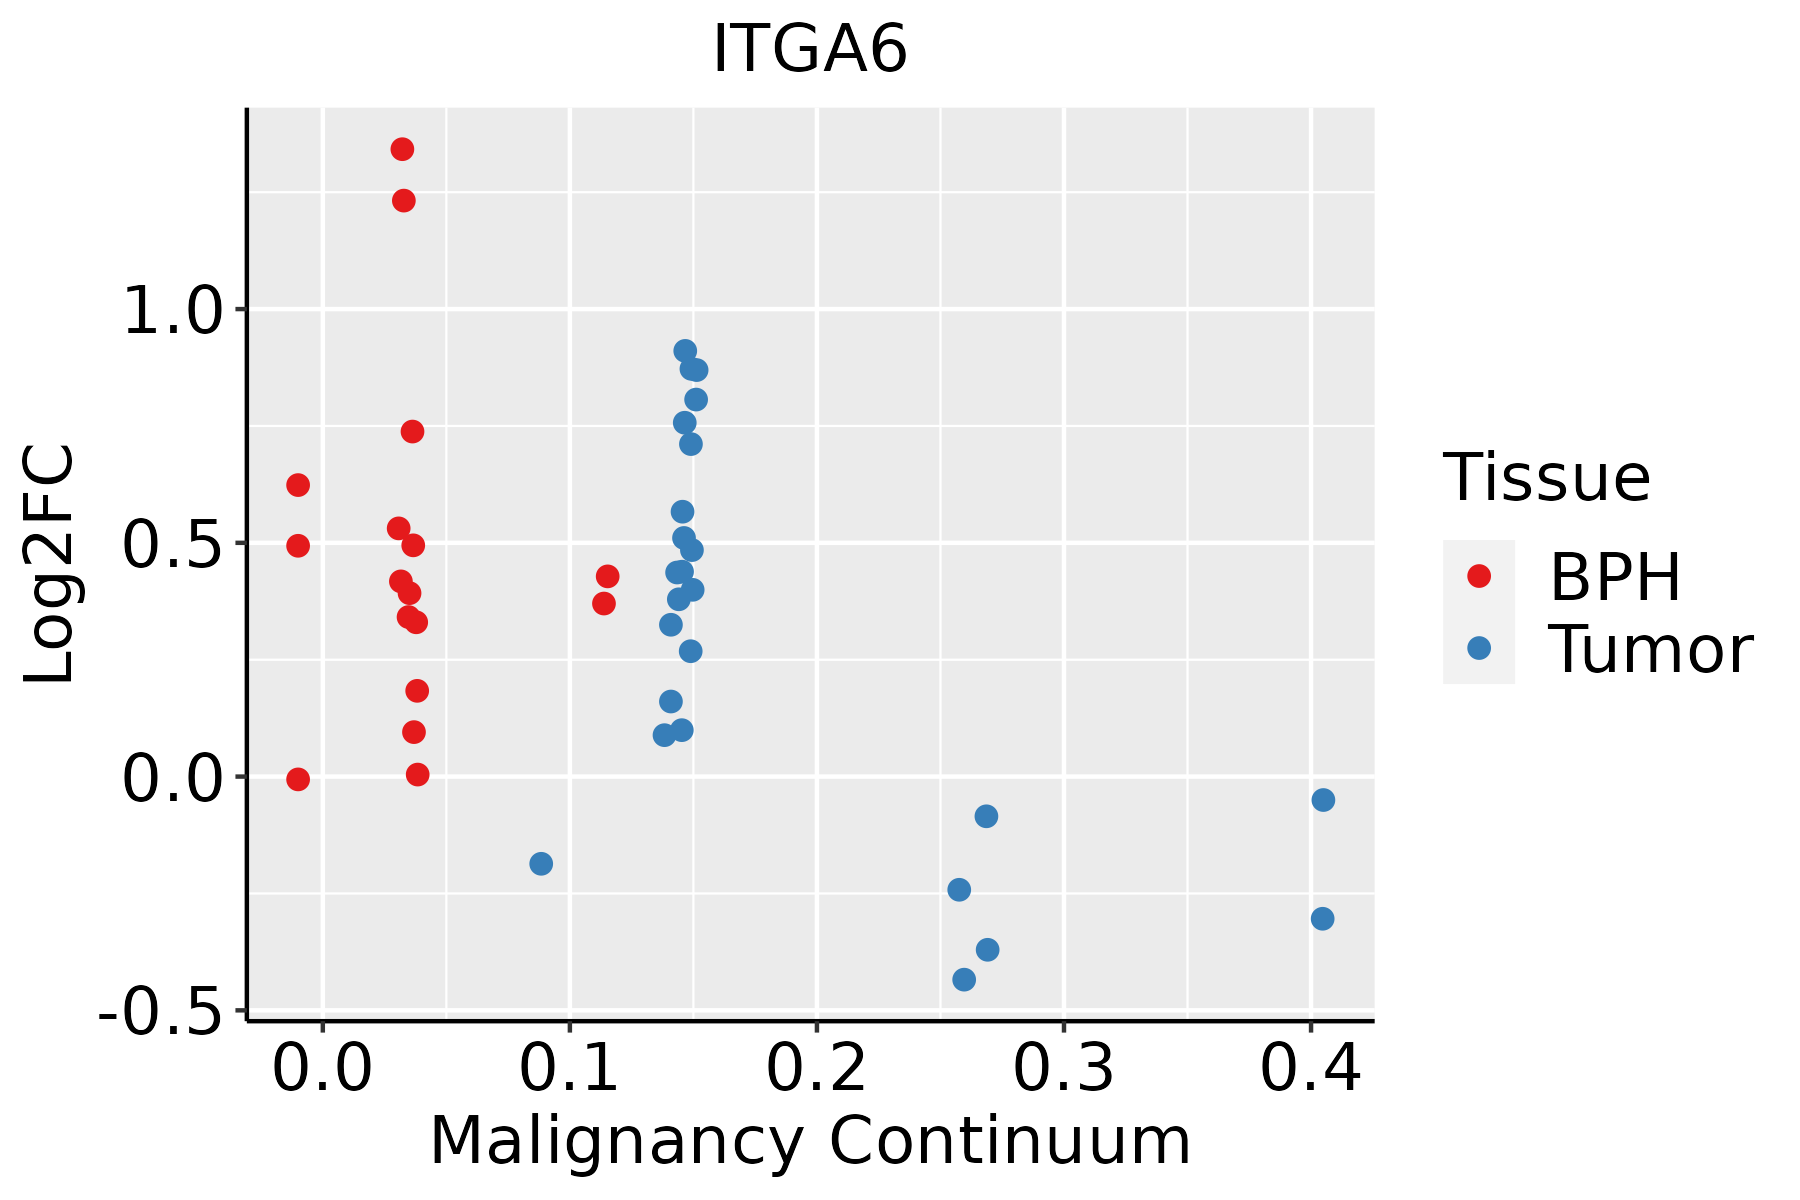 | BPH: Benign Prostatic Hyperplasia |
| Skin |  | AK: Actinic keratosis |
| cSCC: Cutaneous squamous cell carcinoma | ||
| SCCIS:squamous cell carcinoma in situ | ||
| Thyroid |  | ATC: Anaplastic thyroid cancer |
| HT: Hashimoto's thyroiditis | ||
| PTC: Papillary thyroid cancer |
| ∗log2FC in expression of this searched gene in stem-like cells from each diseased tissue sample relative to stem-like cells in normal samples in each tissue plotted against the malignancy continuum. Samples are colored based on if they are from different disease stage. |
Top |
Malignant transformation related pathway analysis |
| Find out the enriched GO biological processes and KEGG pathways involved in transition from healthy to precancer to cancer |
| Tissue | Disease Stage | Enriched GO biological Processes |
| Colorectum | AD |  |
| Colorectum | SER |  |
| Colorectum | MSS |  |
| Colorectum | MSI-H |  |
| Colorectum | FAP |  |
| ∗Top 15 enriched GO BP terms are showed in the bar plot of each disease state in each tissue. Each row represents a significant GO biological process which is colored according to the -log10(p.adjust). |
| Page: 1 2 3 4 5 6 7 8 9 |
| GO ID | Tissue | Disease Stage | Description | Gene Ratio | Bg Ratio | pvalue | p.adjust | Count |
| GO:200123310 | Cervix | CC | regulation of apoptotic signaling pathway | 96/2311 | 356/18723 | 4.08e-14 | 3.05e-11 | 96 |
| GO:001081010 | Cervix | CC | regulation of cell-substrate adhesion | 69/2311 | 221/18723 | 8.57e-14 | 5.69e-11 | 69 |
| GO:00315898 | Cervix | CC | cell-substrate adhesion | 96/2311 | 363/18723 | 1.48e-13 | 8.85e-11 | 96 |
| GO:00435884 | Cervix | CC | skin development | 71/2311 | 263/18723 | 8.04e-11 | 1.46e-08 | 71 |
| GO:004578510 | Cervix | CC | positive regulation of cell adhesion | 101/2311 | 437/18723 | 1.96e-10 | 3.08e-08 | 101 |
| GO:01501159 | Cervix | CC | cell-substrate junction organization | 37/2311 | 101/18723 | 3.20e-10 | 4.46e-08 | 37 |
| GO:00070448 | Cervix | CC | cell-substrate junction assembly | 34/2311 | 95/18723 | 3.35e-09 | 3.45e-07 | 34 |
| GO:00430877 | Cervix | CC | regulation of GTPase activity | 79/2311 | 348/18723 | 4.21e-08 | 2.60e-06 | 79 |
| GO:00072295 | Cervix | CC | integrin-mediated signaling pathway | 34/2311 | 107/18723 | 1.01e-07 | 5.25e-06 | 34 |
| GO:200123410 | Cervix | CC | negative regulation of apoptotic signaling pathway | 56/2311 | 224/18723 | 1.39e-07 | 6.70e-06 | 56 |
| GO:00343298 | Cervix | CC | cell junction assembly | 88/2311 | 420/18723 | 3.42e-07 | 1.38e-05 | 88 |
| GO:009719110 | Cervix | CC | extrinsic apoptotic signaling pathway | 52/2311 | 219/18723 | 2.06e-06 | 6.34e-05 | 52 |
| GO:001081110 | Cervix | CC | positive regulation of cell-substrate adhesion | 34/2311 | 123/18723 | 3.66e-06 | 9.68e-05 | 34 |
| GO:00109757 | Cervix | CC | regulation of neuron projection development | 88/2311 | 445/18723 | 4.26e-06 | 1.09e-04 | 88 |
| GO:00435893 | Cervix | CC | skin morphogenesis | 8/2311 | 11/18723 | 6.22e-06 | 1.51e-04 | 8 |
| GO:00313467 | Cervix | CC | positive regulation of cell projection organization | 72/2311 | 353/18723 | 1.04e-05 | 2.32e-04 | 72 |
| GO:200123610 | Cervix | CC | regulation of extrinsic apoptotic signaling pathway | 37/2311 | 151/18723 | 2.80e-05 | 4.65e-04 | 37 |
| GO:00435476 | Cervix | CC | positive regulation of GTPase activity | 53/2311 | 255/18723 | 8.72e-05 | 1.16e-03 | 53 |
| GO:200123710 | Cervix | CC | negative regulation of extrinsic apoptotic signaling pathway | 23/2311 | 97/18723 | 1.39e-03 | 1.10e-02 | 23 |
| GO:00487365 | Cervix | CC | appendage development | 35/2311 | 172/18723 | 1.88e-03 | 1.39e-02 | 35 |
| Page: 1 2 3 4 5 6 7 8 9 10 11 12 13 14 15 16 17 |
| Pathway ID | Tissue | Disease Stage | Description | Gene Ratio | Bg Ratio | pvalue | p.adjust | qvalue | Count |
| hsa0451010 | Cervix | CC | Focal adhesion | 59/1267 | 203/8465 | 1.53e-07 | 1.84e-06 | 1.09e-06 | 59 |
| hsa0481016 | Cervix | CC | Regulation of actin cytoskeleton | 64/1267 | 229/8465 | 2.24e-07 | 2.59e-06 | 1.53e-06 | 64 |
| hsa0514514 | Cervix | CC | Toxoplasmosis | 34/1267 | 112/8465 | 2.42e-05 | 1.82e-04 | 1.08e-04 | 34 |
| hsa052226 | Cervix | CC | Small cell lung cancer | 29/1267 | 92/8465 | 4.38e-05 | 3.09e-04 | 1.83e-04 | 29 |
| hsa051657 | Cervix | CC | Human papillomavirus infection | 74/1267 | 331/8465 | 1.70e-04 | 1.02e-03 | 6.03e-04 | 74 |
| hsa045147 | Cervix | CC | Cell adhesion molecules | 36/1267 | 157/8465 | 4.94e-03 | 1.67e-02 | 9.86e-03 | 36 |
| hsa0451014 | Cervix | CC | Focal adhesion | 59/1267 | 203/8465 | 1.53e-07 | 1.84e-06 | 1.09e-06 | 59 |
| hsa0481017 | Cervix | CC | Regulation of actin cytoskeleton | 64/1267 | 229/8465 | 2.24e-07 | 2.59e-06 | 1.53e-06 | 64 |
| hsa0514515 | Cervix | CC | Toxoplasmosis | 34/1267 | 112/8465 | 2.42e-05 | 1.82e-04 | 1.08e-04 | 34 |
| hsa0522213 | Cervix | CC | Small cell lung cancer | 29/1267 | 92/8465 | 4.38e-05 | 3.09e-04 | 1.83e-04 | 29 |
| hsa0516512 | Cervix | CC | Human papillomavirus infection | 74/1267 | 331/8465 | 1.70e-04 | 1.02e-03 | 6.03e-04 | 74 |
| hsa0451412 | Cervix | CC | Cell adhesion molecules | 36/1267 | 157/8465 | 4.94e-03 | 1.67e-02 | 9.86e-03 | 36 |
| hsa0514522 | Cervix | HSIL_HPV | Toxoplasmosis | 22/459 | 112/8465 | 1.07e-07 | 3.14e-06 | 2.54e-06 | 22 |
| hsa04640 | Cervix | HSIL_HPV | Hematopoietic cell lineage | 18/459 | 99/8465 | 4.97e-06 | 8.10e-05 | 6.54e-05 | 18 |
| hsa0451421 | Cervix | HSIL_HPV | Cell adhesion molecules | 20/459 | 157/8465 | 3.03e-04 | 3.06e-03 | 2.47e-03 | 20 |
| hsa0522222 | Cervix | HSIL_HPV | Small cell lung cancer | 13/459 | 92/8465 | 1.30e-03 | 9.51e-03 | 7.68e-03 | 13 |
| hsa045124 | Cervix | HSIL_HPV | ECM-receptor interaction | 12/459 | 89/8465 | 2.95e-03 | 1.88e-02 | 1.52e-02 | 12 |
| hsa0451023 | Cervix | HSIL_HPV | Focal adhesion | 21/459 | 203/8465 | 3.24e-03 | 2.02e-02 | 1.63e-02 | 21 |
| hsa054127 | Cervix | HSIL_HPV | Arrhythmogenic right ventricular cardiomyopathy | 10/459 | 77/8465 | 8.34e-03 | 4.70e-02 | 3.80e-02 | 10 |
| hsa0514532 | Cervix | HSIL_HPV | Toxoplasmosis | 22/459 | 112/8465 | 1.07e-07 | 3.14e-06 | 2.54e-06 | 22 |
| Page: 1 2 3 4 5 6 7 |
Top |
Cell-cell communication analysis |
| Identification of potential cell-cell interactions between two cell types and their ligand-receptor pairs for different disease states |
| Ligand | Receptor | LRpair | Pathway | Tissue | Disease Stage |
| MDK | ITGA6_ITGB1 | MDK_ITGA6_ITGB1 | MK | Breast | DCIS |
| LAMA2 | ITGA6_ITGB1 | LAMA2_ITGA6_ITGB1 | LAMININ | Breast | DCIS |
| LAMA3 | ITGA6_ITGB1 | LAMA3_ITGA6_ITGB1 | LAMININ | Breast | DCIS |
| LAMA4 | ITGA6_ITGB1 | LAMA4_ITGA6_ITGB1 | LAMININ | Breast | DCIS |
| LAMB1 | ITGA6_ITGB1 | LAMB1_ITGA6_ITGB1 | LAMININ | Breast | DCIS |
| LAMB2 | ITGA6_ITGB1 | LAMB2_ITGA6_ITGB1 | LAMININ | Breast | DCIS |
| LAMC1 | ITGA6_ITGB1 | LAMC1_ITGA6_ITGB1 | LAMININ | Breast | DCIS |
| LAMA2 | ITGA6_ITGB4 | LAMA2_ITGA6_ITGB4 | LAMININ | Breast | DCIS |
| LAMA3 | ITGA6_ITGB4 | LAMA3_ITGA6_ITGB4 | LAMININ | Breast | DCIS |
| LAMA4 | ITGA6_ITGB4 | LAMA4_ITGA6_ITGB4 | LAMININ | Breast | DCIS |
| LAMB1 | ITGA6_ITGB4 | LAMB1_ITGA6_ITGB4 | LAMININ | Breast | DCIS |
| LAMB2 | ITGA6_ITGB4 | LAMB2_ITGA6_ITGB4 | LAMININ | Breast | DCIS |
| LAMC1 | ITGA6_ITGB4 | LAMC1_ITGA6_ITGB4 | LAMININ | Breast | DCIS |
| IGF1 | ITGA6_ITGB4 | IGF1_ITGA6_ITGB4 | IGF | Breast | DCIS |
| LAMA2 | ITGA6_ITGB1 | LAMA2_ITGA6_ITGB1 | LAMININ | Breast | Healthy |
| LAMA3 | ITGA6_ITGB1 | LAMA3_ITGA6_ITGB1 | LAMININ | Breast | Healthy |
| LAMA4 | ITGA6_ITGB1 | LAMA4_ITGA6_ITGB1 | LAMININ | Breast | Healthy |
| LAMB1 | ITGA6_ITGB1 | LAMB1_ITGA6_ITGB1 | LAMININ | Breast | Healthy |
| LAMB2 | ITGA6_ITGB1 | LAMB2_ITGA6_ITGB1 | LAMININ | Breast | Healthy |
| LAMB3 | ITGA6_ITGB1 | LAMB3_ITGA6_ITGB1 | LAMININ | Breast | Healthy |
| Page: 1 |
Top |
Single-cell gene regulatory network inference analysis |
| Find out the significant the regulons (TFs) and the target genes of each regulon across cell types for different disease states |
| TF | Cell Type | Tissue | Disease Stage | Target Gene | RSS | Regulon Activity |
| ∗The dot plots of a searched regulon are shown for all cell subpopulations in each disease state of each tissue based on the regulon specific score inferred using pySCENIC and by calculating the average expression. |
| Page: 1 |
Top |
Somatic mutation of malignant transformation related genes |
| Annotation of somatic variants for genes involved in malignant transformation |
| Hugo Symbol | Variant Class | Variant Classification | dbSNP RS | HGVSc | HGVSp | HGVSp Short | SWISSPROT | BIOTYPE | SIFT | PolyPhen | Tumor Sample Barcode | Tissue | Histology | Sex | Age | Stage | Therapy Types | Drugs | Outcome |
| ITGA6 | SNV | Missense_Mutation | rs745435250 | c.817N>A | p.Glu273Lys | p.E273K | P23229 | protein_coding | tolerated(0.1) | benign(0.007) | TCGA-AC-A23H-01 | Breast | breast invasive carcinoma | Female | >=65 | I/II | Unknown | Unknown | PD |
| ITGA6 | SNV | Missense_Mutation | c.819N>C | p.Glu273Asp | p.E273D | P23229 | protein_coding | tolerated(0.09) | benign(0.007) | TCGA-AC-A23H-01 | Breast | breast invasive carcinoma | Female | >=65 | I/II | Unknown | Unknown | PD | |
| ITGA6 | SNV | Missense_Mutation | c.2080N>A | p.Asp694Asn | p.D694N | P23229 | protein_coding | deleterious(0) | probably_damaging(0.991) | TCGA-AC-A23H-01 | Breast | breast invasive carcinoma | Female | >=65 | I/II | Unknown | Unknown | PD | |
| ITGA6 | SNV | Missense_Mutation | c.308C>T | p.Ala103Val | p.A103V | P23229 | protein_coding | tolerated(0.44) | benign(0.03) | TCGA-AR-A0TR-01 | Breast | breast invasive carcinoma | Female | >=65 | I/II | Hormone Therapy | tamoxiphen | SD | |
| ITGA6 | SNV | Missense_Mutation | novel | c.3050N>C | p.Ile1017Thr | p.I1017T | P23229 | protein_coding | deleterious(0) | possibly_damaging(0.732) | TCGA-AR-A2LL-01 | Breast | breast invasive carcinoma | Female | >=65 | I/II | Hormone Therapy | tamoxiphen | SD |
| ITGA6 | SNV | Missense_Mutation | c.2347N>T | p.Ala783Ser | p.A783S | P23229 | protein_coding | tolerated(0.82) | benign(0.022) | TCGA-B6-A401-01 | Breast | breast invasive carcinoma | Female | <65 | I/II | Chemotherapy | cyclophosphamide | SD | |
| ITGA6 | SNV | Missense_Mutation | novel | c.700N>A | p.Asp234Asn | p.D234N | P23229 | protein_coding | deleterious(0.01) | benign(0.382) | TCGA-BH-A0B6-01 | Breast | breast invasive carcinoma | Female | <65 | I/II | Unknown | Unknown | SD |
| ITGA6 | SNV | Missense_Mutation | rs749659576 | c.2744N>A | p.Phe915Tyr | p.F915Y | P23229 | protein_coding | tolerated(0.64) | benign(0.251) | TCGA-BH-A0DK-01 | Breast | breast invasive carcinoma | Female | <65 | I/II | Hormone Therapy | tamoxiphen | SD |
| ITGA6 | SNV | Missense_Mutation | c.666N>C | p.Lys222Asn | p.K222N | P23229 | protein_coding | tolerated(0.37) | benign(0.02) | TCGA-BH-A209-01 | Breast | breast invasive carcinoma | Female | >=65 | I/II | Unknown | Unknown | SD | |
| ITGA6 | SNV | Missense_Mutation | c.1723N>A | p.Asp575Asn | p.D575N | P23229 | protein_coding | deleterious(0) | probably_damaging(0.998) | TCGA-C8-A1HM-01 | Breast | breast invasive carcinoma | Female | >=65 | I/II | Chemotherapy | doxorubicin | CR |
| Page: 1 2 3 4 5 6 7 8 9 10 11 |
Top |
Related drugs of malignant transformation related genes |
| Identification of chemicals and drugs interact with genes involved in malignant transfromation |
| (DGIdb 4.0) |
| Entrez ID | Symbol | Category | Interaction Types | Drug Claim Name | Drug Name | PMIDs |
| Page: 1 |

Copyright 2023-Present -The University of Texas Health Science Center at Houston |