
|
|||||
|
 | |
| |
| |
| |
| |
| |
|
Gene: ITGA2 |
Gene summary for ITGA2 |
| Gene information | Species | Human | Gene symbol | ITGA2 | Gene ID | 3673 |
| Gene name | integrin subunit alpha 2 | |
| Gene Alias | BR | |
| Cytomap | 5q11.2 | |
| Gene Type | protein-coding | GO ID | GO:0000003 | UniProtAcc | P17301 |
Top |
Malignant transformation analysis |
| Identification of the aberrant gene expression in precancerous and cancerous lesions by comparing the gene expression of stem-like cells in diseased tissues with normal stem cells |
| Entrez ID | Symbol | Replicates | Species | Organ | Tissue | Adj P-value | Log2FC | Malignancy |
| 3673 | ITGA2 | CA_HPV_1 | Human | Cervix | CC | 3.03e-08 | -3.42e-01 | 0.0264 |
| 3673 | ITGA2 | CA_HPV_3 | Human | Cervix | CC | 2.02e-08 | 1.17e-01 | 0.0414 |
| 3673 | ITGA2 | HSIL_HPV_1 | Human | Cervix | HSIL_HPV | 4.43e-03 | -2.33e-01 | 0.0116 |
| 3673 | ITGA2 | CCI_1 | Human | Cervix | CC | 1.64e-02 | 6.27e-01 | 0.528 |
| 3673 | ITGA2 | CCI_2 | Human | Cervix | CC | 1.62e-09 | 1.51e+00 | 0.5249 |
| 3673 | ITGA2 | CCI_3 | Human | Cervix | CC | 1.34e-22 | 1.46e+00 | 0.516 |
| 3673 | ITGA2 | sample3 | Human | Cervix | CC | 2.68e-05 | 2.72e-01 | 0.1387 |
| 3673 | ITGA2 | HTA11_99999965062_69753 | Human | Colorectum | MSI-H | 6.51e-04 | 8.92e-01 | 0.3487 |
| 3673 | ITGA2 | HTA11_99999965104_69814 | Human | Colorectum | MSS | 4.58e-04 | 6.02e-01 | 0.281 |
| 3673 | ITGA2 | HTA11_99999974143_84620 | Human | Colorectum | MSS | 9.17e-03 | -2.82e-01 | 0.3005 |
| 3673 | ITGA2 | A015-C-203 | Human | Colorectum | FAP | 9.64e-19 | -2.39e-01 | -0.1294 |
| 3673 | ITGA2 | A002-C-201 | Human | Colorectum | FAP | 1.06e-10 | -3.79e-01 | 0.0324 |
| 3673 | ITGA2 | A001-C-119 | Human | Colorectum | FAP | 1.59e-06 | -4.45e-01 | -0.1557 |
| 3673 | ITGA2 | A001-C-108 | Human | Colorectum | FAP | 3.68e-09 | -9.34e-02 | -0.0272 |
| 3673 | ITGA2 | A002-C-205 | Human | Colorectum | FAP | 4.44e-14 | -3.70e-01 | -0.1236 |
| 3673 | ITGA2 | A015-C-005 | Human | Colorectum | FAP | 4.97e-02 | -2.34e-01 | -0.0336 |
| 3673 | ITGA2 | A015-C-006 | Human | Colorectum | FAP | 7.82e-10 | -3.80e-01 | -0.0994 |
| 3673 | ITGA2 | A015-C-106 | Human | Colorectum | FAP | 1.78e-06 | -1.28e-01 | -0.0511 |
| 3673 | ITGA2 | A002-C-114 | Human | Colorectum | FAP | 8.56e-09 | -2.36e-01 | -0.1561 |
| 3673 | ITGA2 | A015-C-104 | Human | Colorectum | FAP | 1.72e-21 | -2.43e-01 | -0.1899 |
| Page: 1 2 3 4 5 6 7 8 9 |
| Tissue | Expression Dynamics | Abbreviation |
| Cervix | 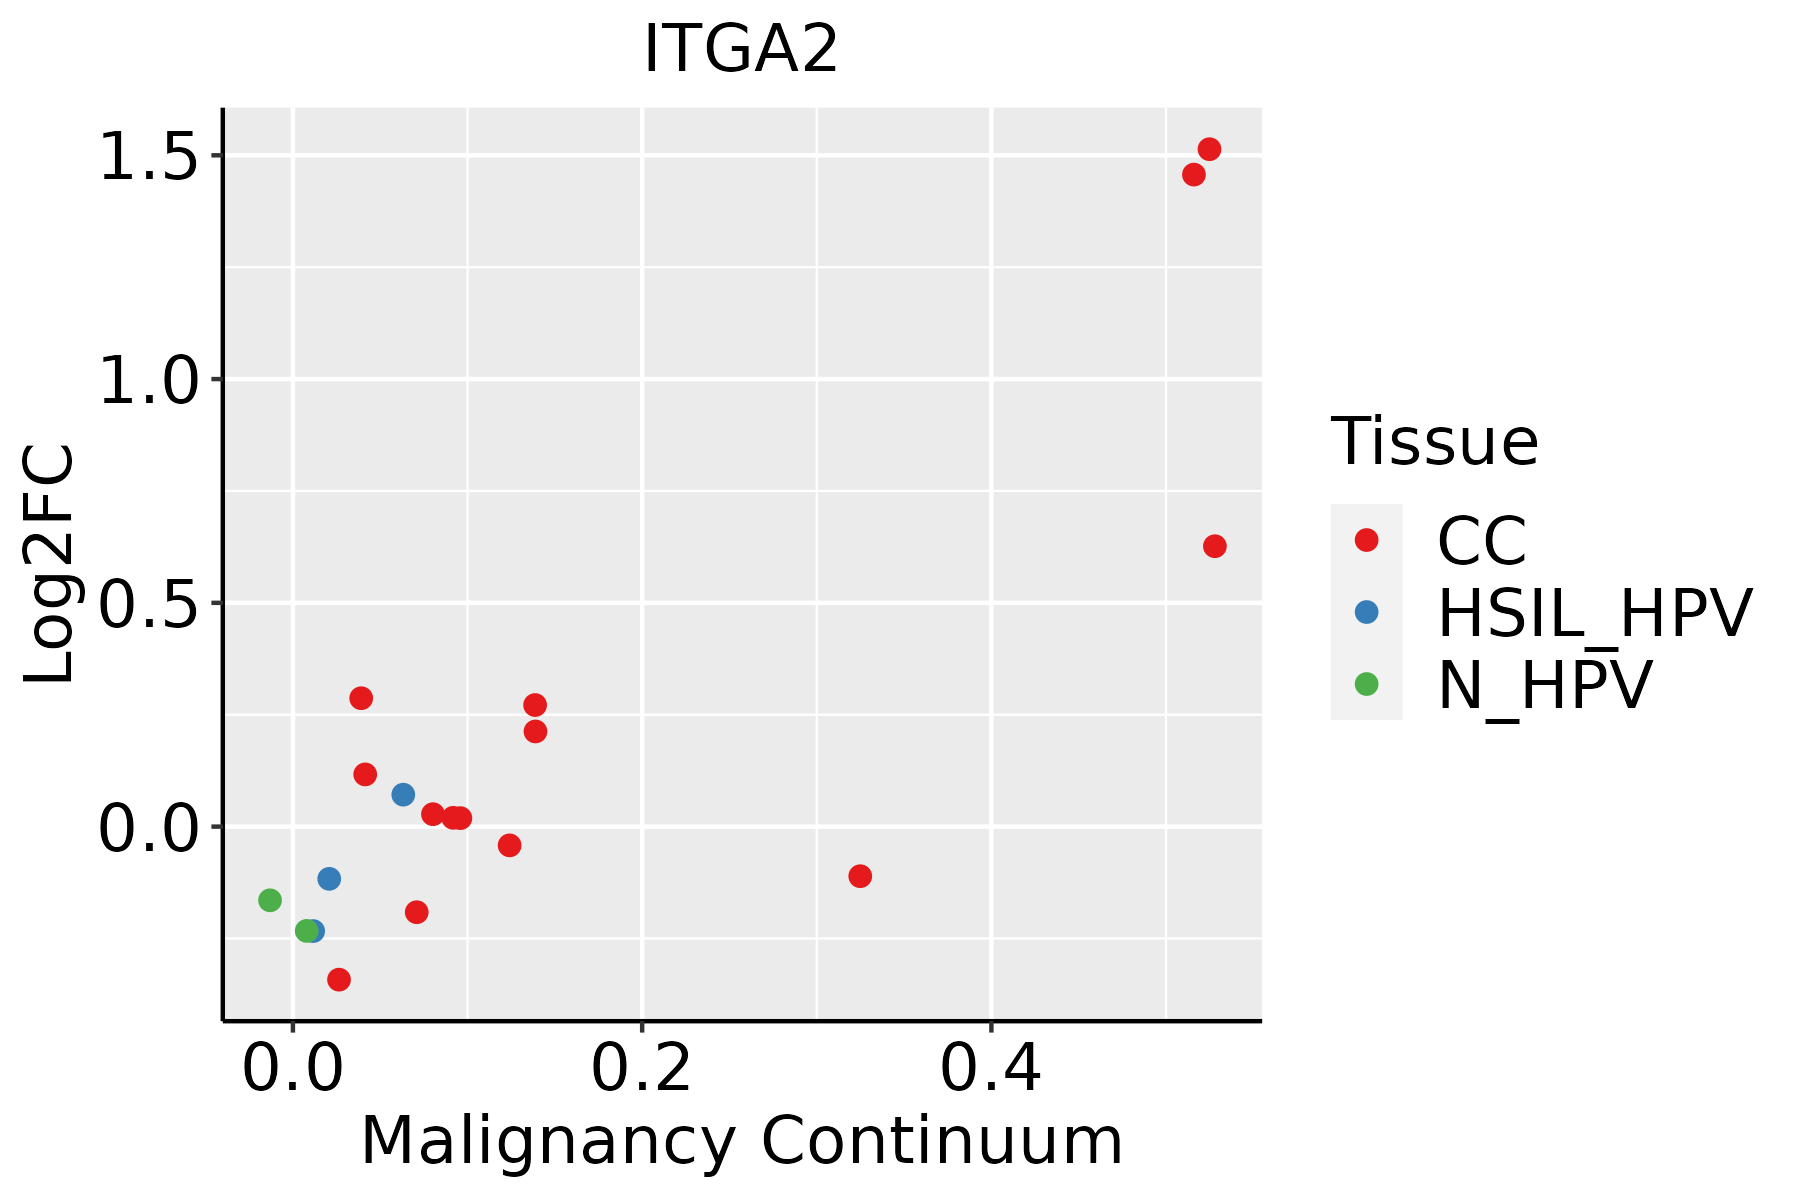 | CC: Cervix cancer |
| HSIL_HPV: HPV-infected high-grade squamous intraepithelial lesions | ||
| N_HPV: HPV-infected normal cervix | ||
| Colorectum (GSE201348) |  | FAP: Familial adenomatous polyposis |
| CRC: Colorectal cancer | ||
| Colorectum (HTA11) |  | AD: Adenomas |
| SER: Sessile serrated lesions | ||
| MSI-H: Microsatellite-high colorectal cancer | ||
| MSS: Microsatellite stable colorectal cancer | ||
| Esophagus | 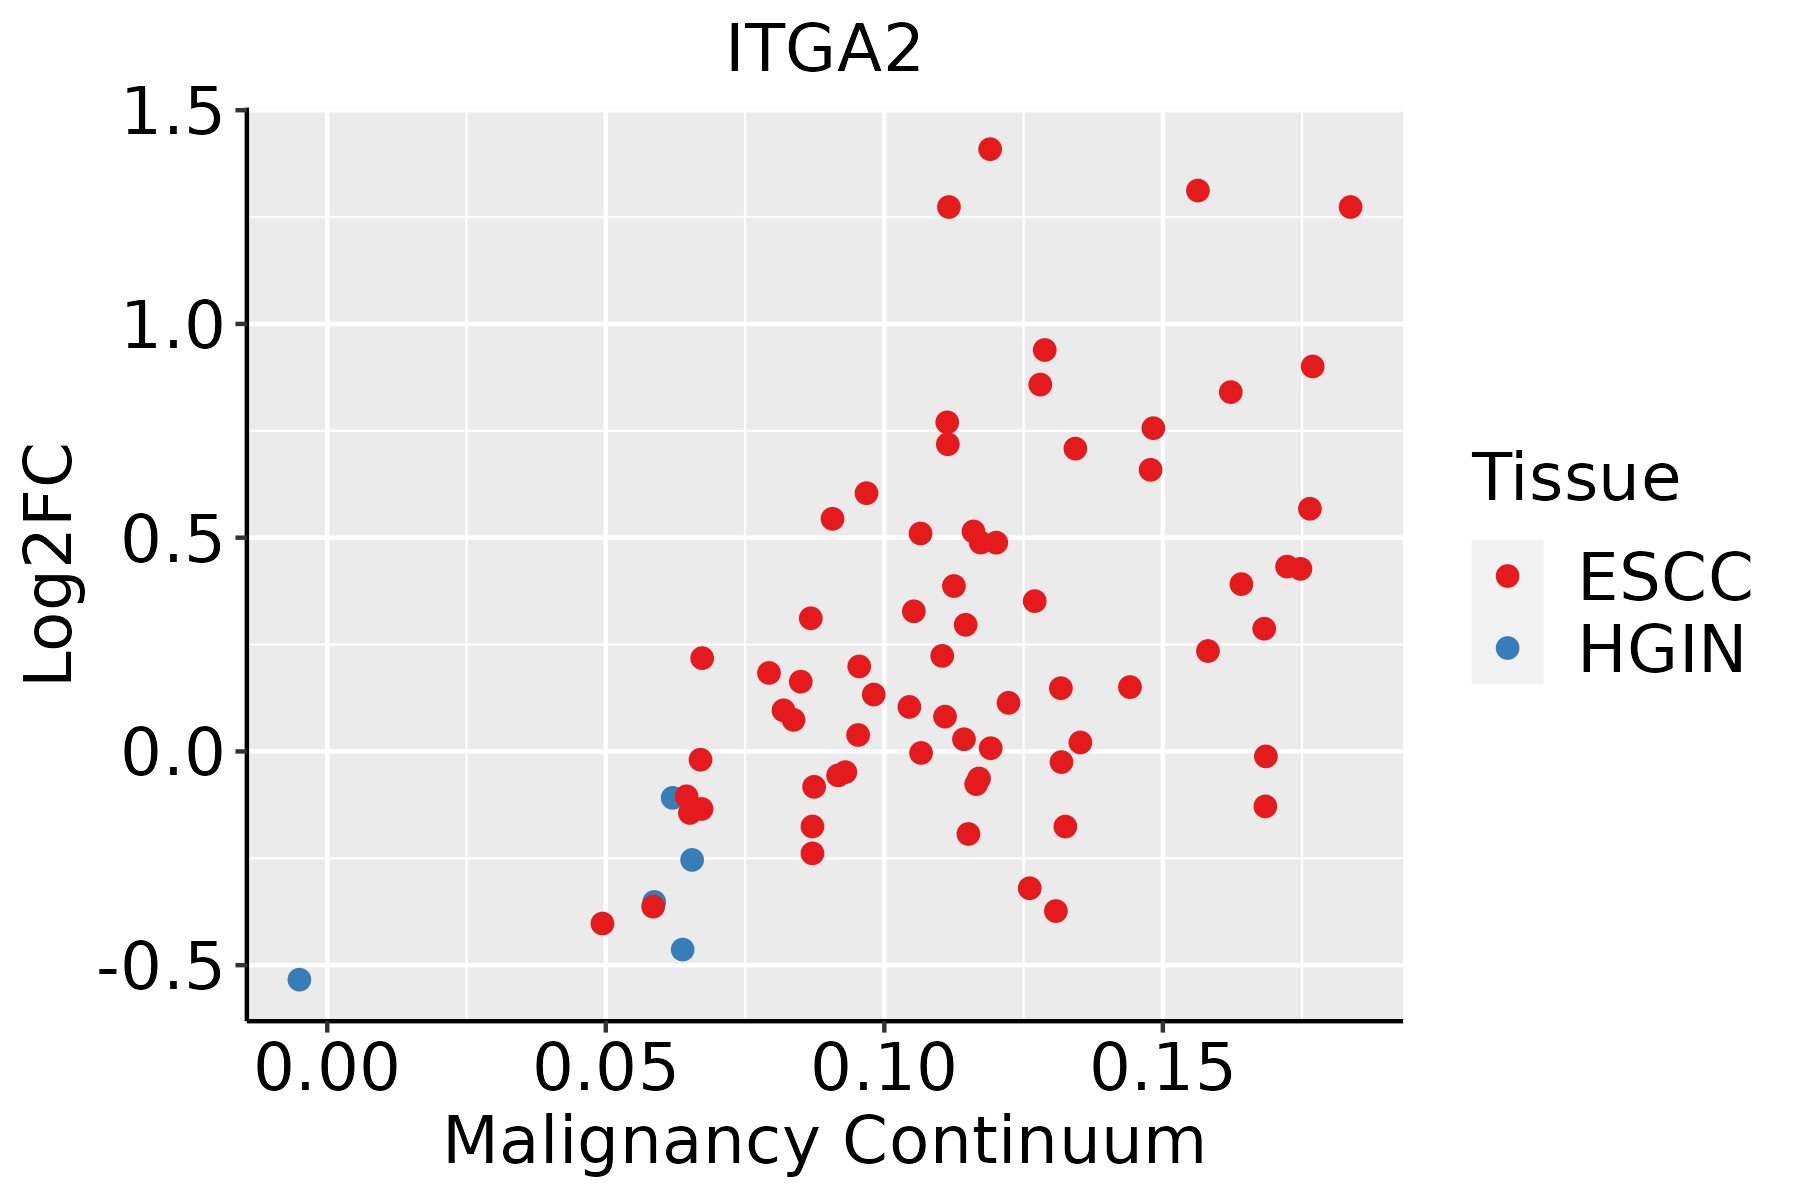 | ESCC: Esophageal squamous cell carcinoma |
| HGIN: High-grade intraepithelial neoplasias | ||
| LGIN: Low-grade intraepithelial neoplasias | ||
| Liver |  | HCC: Hepatocellular carcinoma |
| NAFLD: Non-alcoholic fatty liver disease | ||
| Lung |  | AAH: Atypical adenomatous hyperplasia |
| AIS: Adenocarcinoma in situ | ||
| IAC: Invasive lung adenocarcinoma | ||
| MIA: Minimally invasive adenocarcinoma | ||
| Oral Cavity |  | EOLP: Erosive Oral lichen planus |
| LP: leukoplakia | ||
| NEOLP: Non-erosive oral lichen planus | ||
| OSCC: Oral squamous cell carcinoma | ||
| Prostate |  | BPH: Benign Prostatic Hyperplasia |
| Skin | 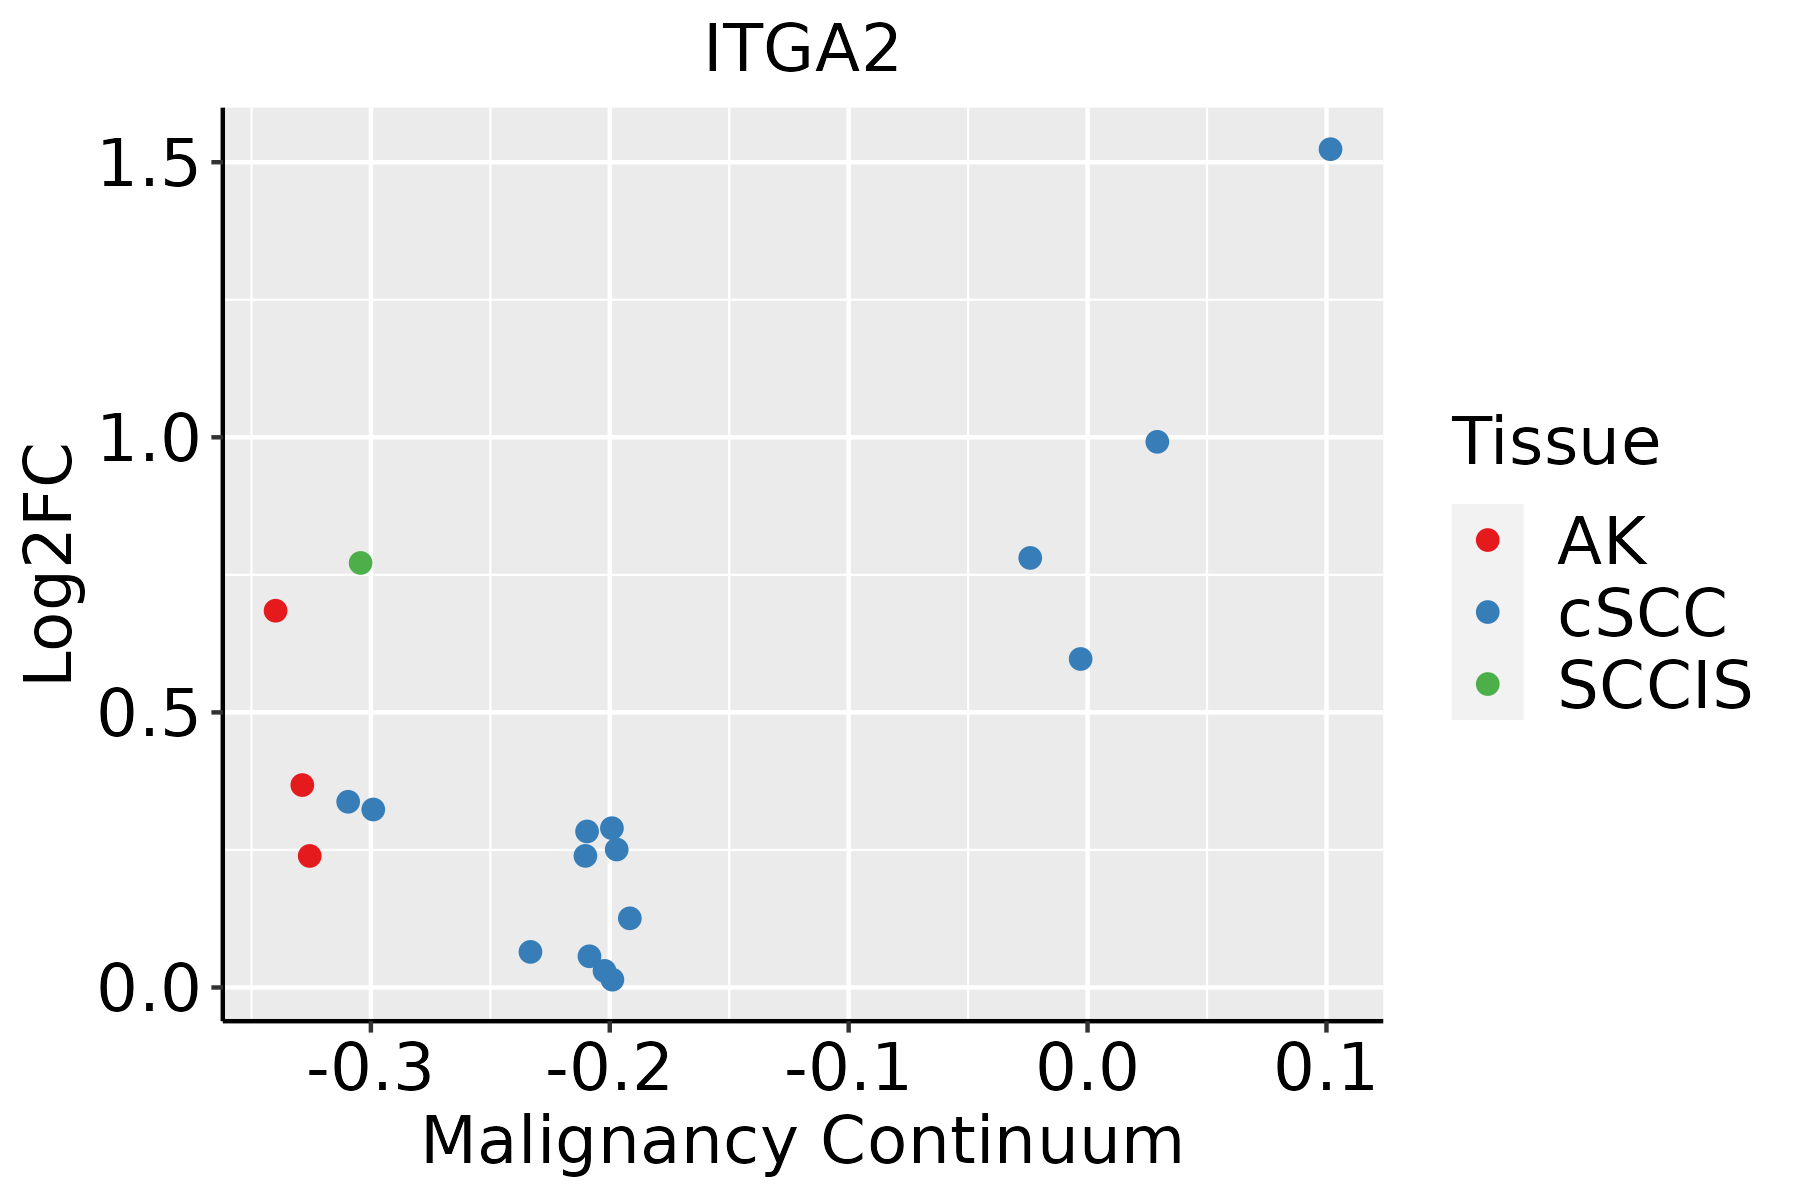 | AK: Actinic keratosis |
| cSCC: Cutaneous squamous cell carcinoma | ||
| SCCIS:squamous cell carcinoma in situ | ||
| Thyroid | 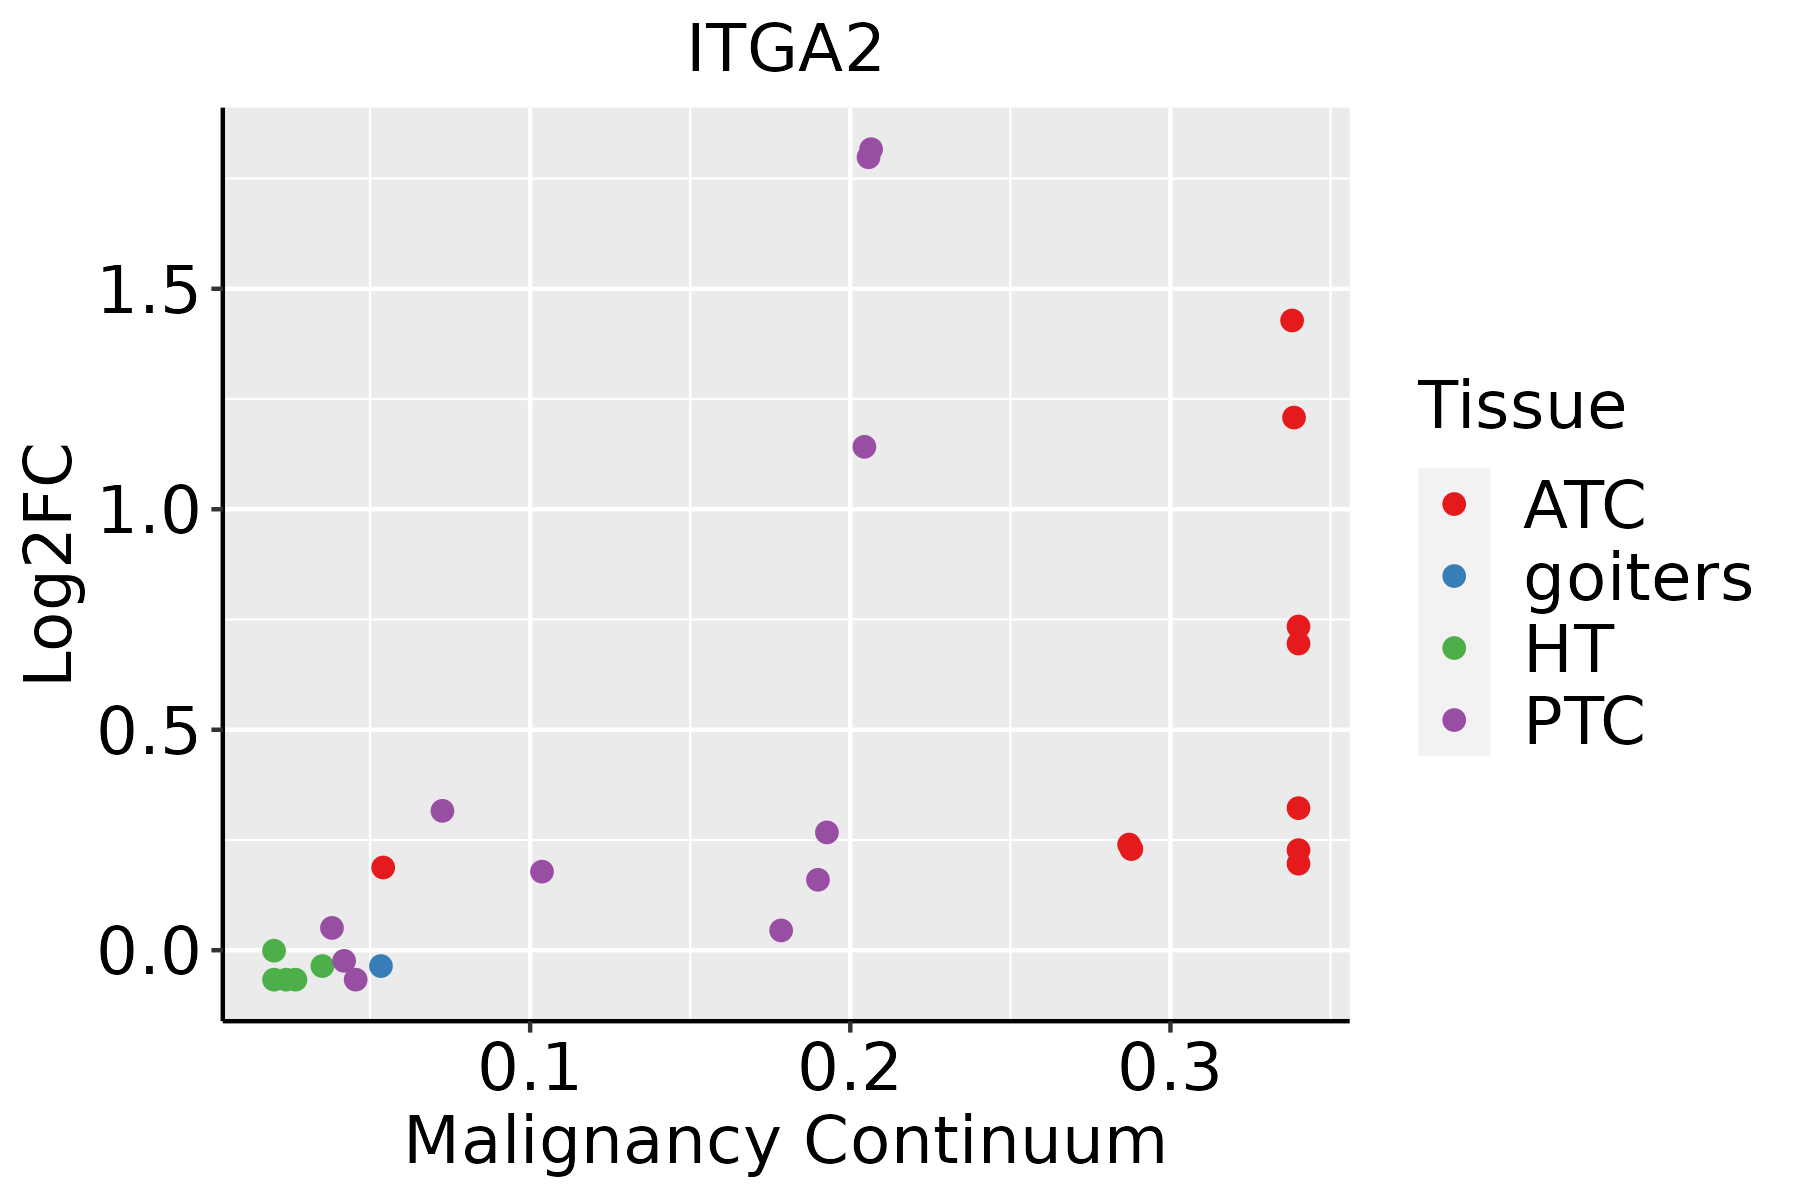 | ATC: Anaplastic thyroid cancer |
| HT: Hashimoto's thyroiditis | ||
| PTC: Papillary thyroid cancer |
| ∗log2FC in expression of this searched gene in stem-like cells from each diseased tissue sample relative to stem-like cells in normal samples in each tissue plotted against the malignancy continuum. Samples are colored based on if they are from different disease stage. |
Top |
Malignant transformation related pathway analysis |
| Find out the enriched GO biological processes and KEGG pathways involved in transition from healthy to precancer to cancer |
| Tissue | Disease Stage | Enriched GO biological Processes |
| Colorectum | AD |  |
| Colorectum | SER |  |
| Colorectum | MSS |  |
| Colorectum | MSI-H |  |
| Colorectum | FAP |  |
| ∗Top 15 enriched GO BP terms are showed in the bar plot of each disease state in each tissue. Each row represents a significant GO biological process which is colored according to the -log10(p.adjust). |
| Page: 1 2 3 4 5 6 7 8 9 |
| GO ID | Tissue | Disease Stage | Description | Gene Ratio | Bg Ratio | pvalue | p.adjust | Count |
| GO:001603210 | Cervix | CC | viral process | 109/2311 | 415/18723 | 5.40e-15 | 6.46e-12 | 109 |
| GO:004206010 | Cervix | CC | wound healing | 109/2311 | 422/18723 | 1.84e-14 | 1.57e-11 | 109 |
| GO:00315898 | Cervix | CC | cell-substrate adhesion | 96/2311 | 363/18723 | 1.48e-13 | 8.85e-11 | 96 |
| GO:001905810 | Cervix | CC | viral life cycle | 87/2311 | 317/18723 | 2.20e-13 | 1.20e-10 | 87 |
| GO:009013210 | Cervix | CC | epithelium migration | 90/2311 | 360/18723 | 2.45e-11 | 6.11e-09 | 90 |
| GO:00016679 | Cervix | CC | ameboidal-type cell migration | 110/2311 | 475/18723 | 2.66e-11 | 6.36e-09 | 110 |
| GO:001063110 | Cervix | CC | epithelial cell migration | 89/2311 | 357/18723 | 3.72e-11 | 8.54e-09 | 89 |
| GO:009013010 | Cervix | CC | tissue migration | 90/2311 | 365/18723 | 5.42e-11 | 1.05e-08 | 90 |
| GO:00435884 | Cervix | CC | skin development | 71/2311 | 263/18723 | 8.04e-11 | 1.46e-08 | 71 |
| GO:004578510 | Cervix | CC | positive regulation of cell adhesion | 101/2311 | 437/18723 | 1.96e-10 | 3.08e-08 | 101 |
| GO:01501159 | Cervix | CC | cell-substrate junction organization | 37/2311 | 101/18723 | 3.20e-10 | 4.46e-08 | 37 |
| GO:005212610 | Cervix | CC | movement in host environment | 52/2311 | 175/18723 | 7.03e-10 | 8.76e-08 | 52 |
| GO:004440910 | Cervix | CC | entry into host | 47/2311 | 151/18723 | 8.45e-10 | 1.03e-07 | 47 |
| GO:005170110 | Cervix | CC | biological process involved in interaction with host | 57/2311 | 203/18723 | 1.18e-09 | 1.41e-07 | 57 |
| GO:007149610 | Cervix | CC | cellular response to external stimulus | 78/2311 | 320/18723 | 1.82e-09 | 1.98e-07 | 78 |
| GO:00070448 | Cervix | CC | cell-substrate junction assembly | 34/2311 | 95/18723 | 3.35e-09 | 3.45e-07 | 34 |
| GO:001063210 | Cervix | CC | regulation of epithelial cell migration | 72/2311 | 292/18723 | 4.52e-09 | 4.43e-07 | 72 |
| GO:00321035 | Cervix | CC | positive regulation of response to external stimulus | 95/2311 | 427/18723 | 5.44e-09 | 5.03e-07 | 95 |
| GO:004671810 | Cervix | CC | viral entry into host cell | 44/2311 | 144/18723 | 5.47e-09 | 5.03e-07 | 44 |
| GO:004440310 | Cervix | CC | biological process involved in symbiotic interaction | 71/2311 | 290/18723 | 7.94e-09 | 6.98e-07 | 71 |
| Page: 1 2 3 4 5 6 7 8 9 10 11 12 13 14 15 16 17 18 19 20 21 22 23 24 25 26 27 28 29 30 31 32 33 34 35 36 37 38 39 40 41 42 43 44 45 46 47 48 49 50 51 52 53 54 55 56 57 58 59 60 61 |
| Pathway ID | Tissue | Disease Stage | Description | Gene Ratio | Bg Ratio | pvalue | p.adjust | qvalue | Count |
| hsa0520516 | Cervix | CC | Proteoglycans in cancer | 60/1267 | 205/8465 | 9.13e-08 | 1.18e-06 | 7.00e-07 | 60 |
| hsa0451010 | Cervix | CC | Focal adhesion | 59/1267 | 203/8465 | 1.53e-07 | 1.84e-06 | 1.09e-06 | 59 |
| hsa0481016 | Cervix | CC | Regulation of actin cytoskeleton | 64/1267 | 229/8465 | 2.24e-07 | 2.59e-06 | 1.53e-06 | 64 |
| hsa0414520 | Cervix | CC | Phagosome | 47/1267 | 152/8465 | 3.95e-07 | 4.26e-06 | 2.52e-06 | 47 |
| hsa052226 | Cervix | CC | Small cell lung cancer | 29/1267 | 92/8465 | 4.38e-05 | 3.09e-04 | 1.83e-04 | 29 |
| hsa051657 | Cervix | CC | Human papillomavirus infection | 74/1267 | 331/8465 | 1.70e-04 | 1.02e-03 | 6.03e-04 | 74 |
| hsa046115 | Cervix | CC | Platelet activation | 28/1267 | 124/8465 | 1.50e-02 | 4.45e-02 | 2.63e-02 | 28 |
| hsa0520517 | Cervix | CC | Proteoglycans in cancer | 60/1267 | 205/8465 | 9.13e-08 | 1.18e-06 | 7.00e-07 | 60 |
| hsa0451014 | Cervix | CC | Focal adhesion | 59/1267 | 203/8465 | 1.53e-07 | 1.84e-06 | 1.09e-06 | 59 |
| hsa0481017 | Cervix | CC | Regulation of actin cytoskeleton | 64/1267 | 229/8465 | 2.24e-07 | 2.59e-06 | 1.53e-06 | 64 |
| hsa04145110 | Cervix | CC | Phagosome | 47/1267 | 152/8465 | 3.95e-07 | 4.26e-06 | 2.52e-06 | 47 |
| hsa0522213 | Cervix | CC | Small cell lung cancer | 29/1267 | 92/8465 | 4.38e-05 | 3.09e-04 | 1.83e-04 | 29 |
| hsa0516512 | Cervix | CC | Human papillomavirus infection | 74/1267 | 331/8465 | 1.70e-04 | 1.02e-03 | 6.03e-04 | 74 |
| hsa0461113 | Cervix | CC | Platelet activation | 28/1267 | 124/8465 | 1.50e-02 | 4.45e-02 | 2.63e-02 | 28 |
| hsa0414523 | Cervix | HSIL_HPV | Phagosome | 27/459 | 152/8465 | 3.58e-08 | 1.50e-06 | 1.21e-06 | 27 |
| hsa04640 | Cervix | HSIL_HPV | Hematopoietic cell lineage | 18/459 | 99/8465 | 4.97e-06 | 8.10e-05 | 6.54e-05 | 18 |
| hsa0522222 | Cervix | HSIL_HPV | Small cell lung cancer | 13/459 | 92/8465 | 1.30e-03 | 9.51e-03 | 7.68e-03 | 13 |
| hsa0451023 | Cervix | HSIL_HPV | Focal adhesion | 21/459 | 203/8465 | 3.24e-03 | 2.02e-02 | 1.63e-02 | 21 |
| hsa054127 | Cervix | HSIL_HPV | Arrhythmogenic right ventricular cardiomyopathy | 10/459 | 77/8465 | 8.34e-03 | 4.70e-02 | 3.80e-02 | 10 |
| hsa0414533 | Cervix | HSIL_HPV | Phagosome | 27/459 | 152/8465 | 3.58e-08 | 1.50e-06 | 1.21e-06 | 27 |
| Page: 1 2 3 4 5 6 7 8 9 |
Top |
Cell-cell communication analysis |
| Identification of potential cell-cell interactions between two cell types and their ligand-receptor pairs for different disease states |
| Ligand | Receptor | LRpair | Pathway | Tissue | Disease Stage |
| COL1A1 | ITGA2_ITGB1 | COL1A1_ITGA2_ITGB1 | COLLAGEN | Breast | ADJ |
| COL1A2 | ITGA2_ITGB1 | COL1A2_ITGA2_ITGB1 | COLLAGEN | Breast | ADJ |
| COL4A1 | ITGA2_ITGB1 | COL4A1_ITGA2_ITGB1 | COLLAGEN | Breast | ADJ |
| COL4A2 | ITGA2_ITGB1 | COL4A2_ITGA2_ITGB1 | COLLAGEN | Breast | ADJ |
| COL6A1 | ITGA2_ITGB1 | COL6A1_ITGA2_ITGB1 | COLLAGEN | Breast | ADJ |
| COL6A2 | ITGA2_ITGB1 | COL6A2_ITGA2_ITGB1 | COLLAGEN | Breast | ADJ |
| COL6A3 | ITGA2_ITGB1 | COL6A3_ITGA2_ITGB1 | COLLAGEN | Breast | ADJ |
| LAMA2 | ITGA2_ITGB1 | LAMA2_ITGA2_ITGB1 | LAMININ | Breast | ADJ |
| LAMA4 | ITGA2_ITGB1 | LAMA4_ITGA2_ITGB1 | LAMININ | Breast | ADJ |
| LAMB2 | ITGA2_ITGB1 | LAMB2_ITGA2_ITGB1 | LAMININ | Breast | ADJ |
| LAMB3 | ITGA2_ITGB1 | LAMB3_ITGA2_ITGB1 | LAMININ | Breast | ADJ |
| LAMC1 | ITGA2_ITGB1 | LAMC1_ITGA2_ITGB1 | LAMININ | Breast | ADJ |
| LAMC2 | ITGA2_ITGB1 | LAMC2_ITGA2_ITGB1 | LAMININ | Breast | ADJ |
| CDH1 | ITGA2_ITGB1 | CDH1_ITGA1_ITGB1 | CDH1 | Breast | ADJ |
| COL1A1 | ITGA2_ITGB1 | COL1A1_ITGA2_ITGB1 | COLLAGEN | Breast | DCIS |
| COL1A2 | ITGA2_ITGB1 | COL1A2_ITGA2_ITGB1 | COLLAGEN | Breast | DCIS |
| COL4A1 | ITGA2_ITGB1 | COL4A1_ITGA2_ITGB1 | COLLAGEN | Breast | DCIS |
| COL4A2 | ITGA2_ITGB1 | COL4A2_ITGA2_ITGB1 | COLLAGEN | Breast | DCIS |
| COL6A1 | ITGA2_ITGB1 | COL6A1_ITGA2_ITGB1 | COLLAGEN | Breast | DCIS |
| COL6A2 | ITGA2_ITGB1 | COL6A2_ITGA2_ITGB1 | COLLAGEN | Breast | DCIS |
| Page: 1 |
Top |
Single-cell gene regulatory network inference analysis |
| Find out the significant the regulons (TFs) and the target genes of each regulon across cell types for different disease states |
| TF | Cell Type | Tissue | Disease Stage | Target Gene | RSS | Regulon Activity |
| ∗The dot plots of a searched regulon are shown for all cell subpopulations in each disease state of each tissue based on the regulon specific score inferred using pySCENIC and by calculating the average expression. |
| Page: 1 |
Top |
Somatic mutation of malignant transformation related genes |
| Annotation of somatic variants for genes involved in malignant transformation |
| Hugo Symbol | Variant Class | Variant Classification | dbSNP RS | HGVSc | HGVSp | HGVSp Short | SWISSPROT | BIOTYPE | SIFT | PolyPhen | Tumor Sample Barcode | Tissue | Histology | Sex | Age | Stage | Therapy Types | Drugs | Outcome |
| ITGA2 | SNV | Missense_Mutation | novel | c.1972N>A | p.Glu658Lys | p.E658K | P17301 | protein_coding | tolerated(0.96) | benign(0.003) | TCGA-A8-A07W-01 | Breast | breast invasive carcinoma | Female | >=65 | III/IV | Hormone Therapy | exemestane | SD |
| ITGA2 | SNV | Missense_Mutation | novel | c.521N>C | p.Asp174Ala | p.D174A | P17301 | protein_coding | deleterious(0) | probably_damaging(1) | TCGA-AN-A046-01 | Breast | breast invasive carcinoma | Female | >=65 | I/II | Unknown | Unknown | SD |
| ITGA2 | SNV | Missense_Mutation | rs758795869 | c.3284C>T | p.Thr1095Met | p.T1095M | P17301 | protein_coding | deleterious(0.01) | benign(0.084) | TCGA-BH-A0B1-01 | Breast | breast invasive carcinoma | Female | >=65 | I/II | Chemotherapy | adriamycin | SD |
| ITGA2 | SNV | Missense_Mutation | c.2947C>T | p.Pro983Ser | p.P983S | P17301 | protein_coding | deleterious(0) | probably_damaging(0.954) | TCGA-BH-A0B8-01 | Breast | breast invasive carcinoma | Female | <65 | I/II | Hormone Therapy | arimidex | SD | |
| ITGA2 | SNV | Missense_Mutation | rs377150294 | c.1372N>T | p.Arg458Trp | p.R458W | P17301 | protein_coding | deleterious(0) | probably_damaging(1) | TCGA-BH-A0HO-01 | Breast | breast invasive carcinoma | Female | <65 | I/II | Chemotherapy | cyclophosphamide | SD |
| ITGA2 | SNV | Missense_Mutation | c.2713N>G | p.Gln905Glu | p.Q905E | P17301 | protein_coding | tolerated(0.96) | benign(0.009) | TCGA-D8-A27G-01 | Breast | breast invasive carcinoma | Female | >=65 | I/II | Unknown | Unknown | SD | |
| ITGA2 | SNV | Missense_Mutation | c.2205N>C | p.Gln735His | p.Q735H | P17301 | protein_coding | tolerated(0.09) | benign(0.06) | TCGA-E2-A152-01 | Breast | breast invasive carcinoma | Female | <65 | I/II | Targeted Molecular therapy | trastuzumab | PD | |
| ITGA2 | insertion | In_Frame_Ins | novel | c.3339_3340insGATATA | p.Asn1113_Thr1114insAspIle | p.N1113_T1114insDI | P17301 | protein_coding | TCGA-B6-A0RE-01 | Breast | breast invasive carcinoma | Female | <65 | I/II | Unknown | Unknown | SD | ||
| ITGA2 | insertion | Nonsense_Mutation | novel | c.3341_3342insAAGGTGAAAGGTTCAGGGCCATGGGTGGTCAAG | p.Thr1114_Val1115insArgTerLysValGlnGlyHisGlyTrpSerSer | p.T1114_V1115insR*KVQGHGWSS | P17301 | protein_coding | TCGA-B6-A0RE-01 | Breast | breast invasive carcinoma | Female | <65 | I/II | Unknown | Unknown | SD | ||
| ITGA2 | SNV | Missense_Mutation | novel | c.1366G>A | p.Ala456Thr | p.A456T | P17301 | protein_coding | deleterious(0.02) | probably_damaging(0.987) | TCGA-2W-A8YY-01 | Cervix | cervical & endocervical cancer | Female | <65 | I/II | Chemotherapy | cisplatin | CR |
| Page: 1 2 3 4 5 6 7 8 9 10 11 12 13 14 15 |
Top |
Related drugs of malignant transformation related genes |
| Identification of chemicals and drugs interact with genes involved in malignant transfromation |
| (DGIdb 4.0) |
| Entrez ID | Symbol | Category | Interaction Types | Drug Claim Name | Drug Name | PMIDs |
| 3673 | ITGA2 | DRUGGABLE GENOME, EXTERNAL SIDE OF PLASMA MEMBRANE, CELL SURFACE | E7820 | E-7820 | ||
| 3673 | ITGA2 | DRUGGABLE GENOME, EXTERNAL SIDE OF PLASMA MEMBRANE, CELL SURFACE | aspirin | ASPIRIN | 17157856,16493486,15205592,22940005,16214444 | |
| 3673 | ITGA2 | DRUGGABLE GENOME, EXTERNAL SIDE OF PLASMA MEMBRANE, CELL SURFACE | antagonist | CHEMBL1743086 | VATELIZUMAB | |
| 3673 | ITGA2 | DRUGGABLE GENOME, EXTERNAL SIDE OF PLASMA MEMBRANE, CELL SURFACE | clopidogrel | CLOPIDOGREL | 17157856,16493486,15205592,22940005,16214444 |
| Page: 1 |

Copyright 2023-Present -The University of Texas Health Science Center at Houston |