
|
|||||
|
 | |
| |
| |
| |
| |
| |
|
Gene: ITGA11 |
Gene summary for ITGA11 |
| Gene information | Species | Human | Gene symbol | ITGA11 | Gene ID | 22801 |
| Gene name | integrin subunit alpha 11 | |
| Gene Alias | HsT18964 | |
| Cytomap | 15q23 | |
| Gene Type | protein-coding | GO ID | GO:0001503 | UniProtAcc | B3KTN6 |
Top |
Malignant transformation analysis |
| Identification of the aberrant gene expression in precancerous and cancerous lesions by comparing the gene expression of stem-like cells in diseased tissues with normal stem cells |
| Entrez ID | Symbol | Replicates | Species | Organ | Tissue | Adj P-value | Log2FC | Malignancy |
| 22801 | ITGA11 | ATC11 | Human | Thyroid | ATC | 9.94e-09 | 1.02e+00 | 0.3386 |
| 22801 | ITGA11 | ATC12 | Human | Thyroid | ATC | 4.14e-42 | 8.45e-01 | 0.34 |
| 22801 | ITGA11 | ATC13 | Human | Thyroid | ATC | 3.28e-16 | 3.53e-01 | 0.34 |
| 22801 | ITGA11 | ATC3 | Human | Thyroid | ATC | 2.42e-14 | 9.33e-01 | 0.338 |
| 22801 | ITGA11 | ATC4 | Human | Thyroid | ATC | 2.05e-46 | 9.95e-01 | 0.34 |
| 22801 | ITGA11 | ATC5 | Human | Thyroid | ATC | 5.37e-18 | 3.92e-01 | 0.34 |
| Page: 1 |
| Tissue | Expression Dynamics | Abbreviation |
| Thyroid | 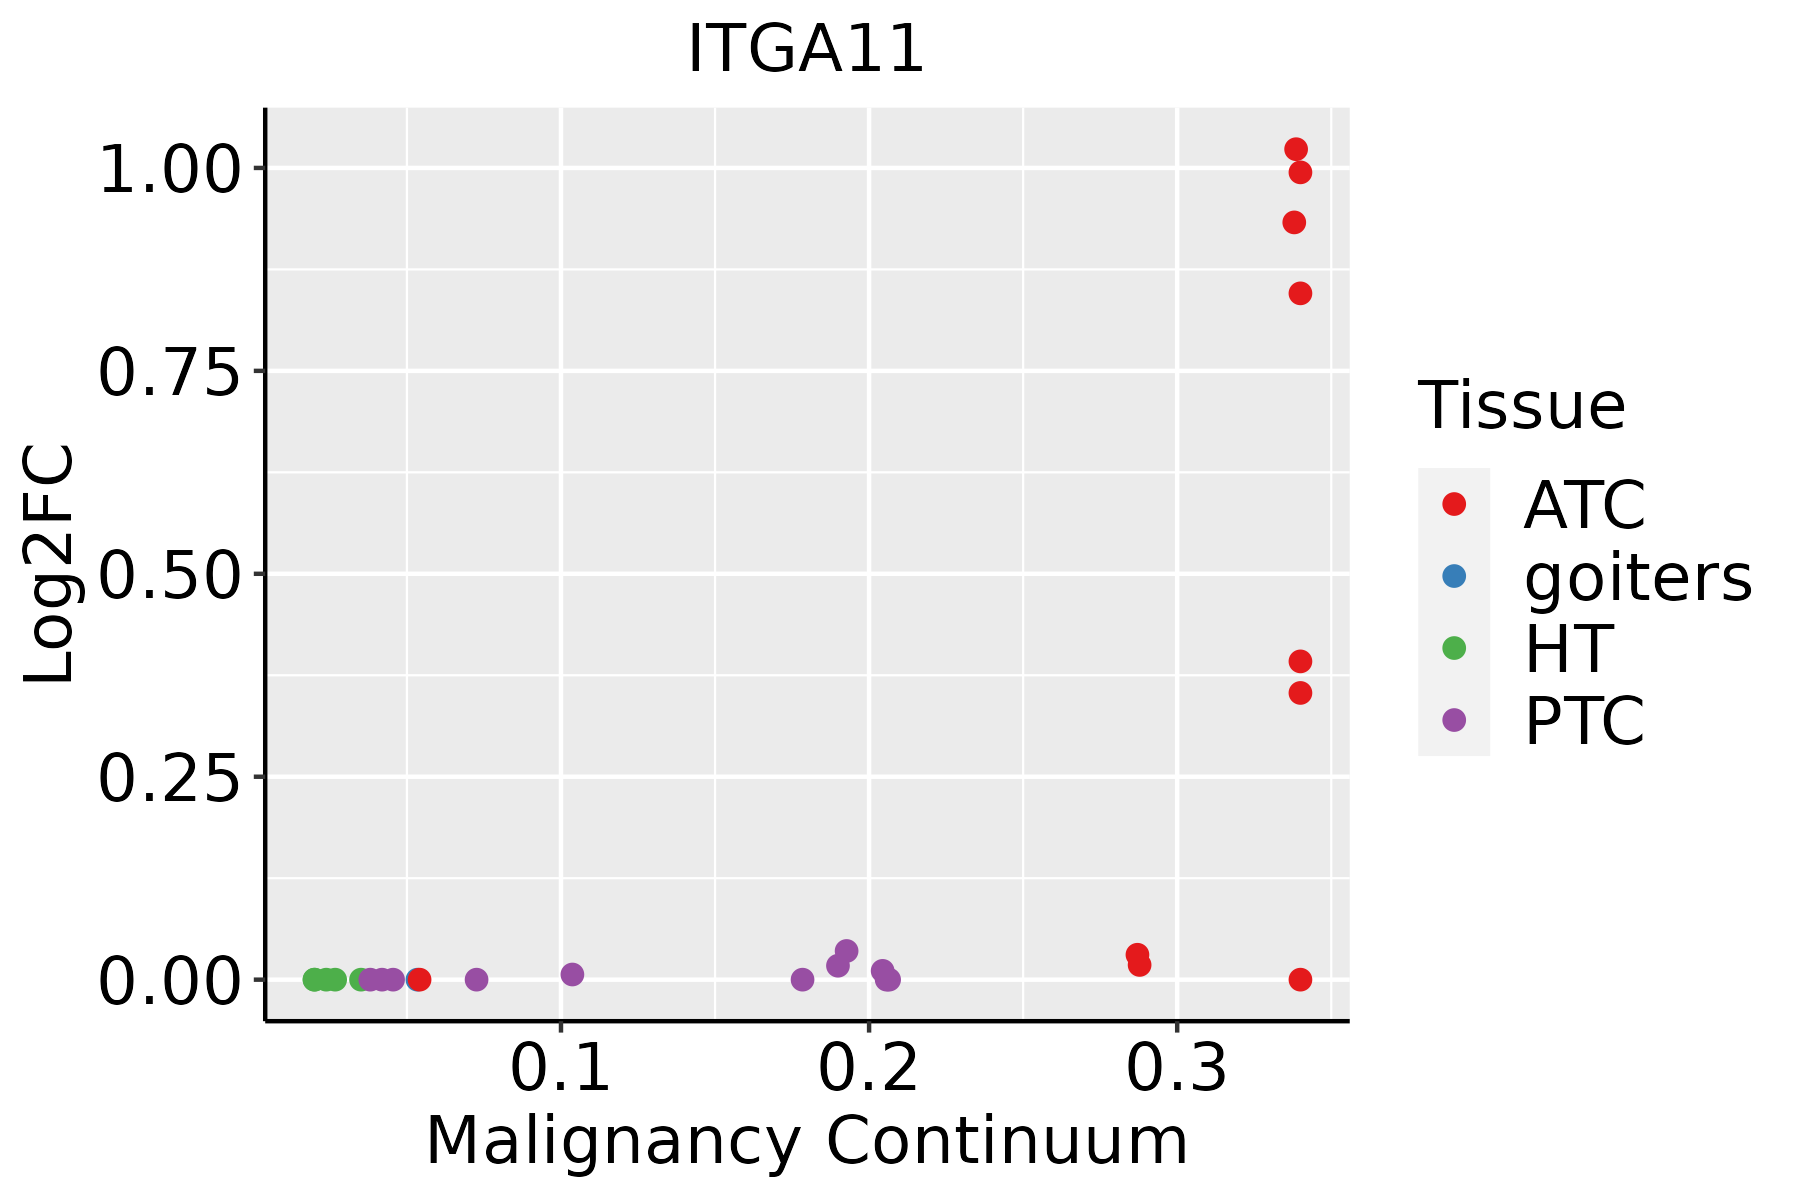 | ATC: Anaplastic thyroid cancer |
| HT: Hashimoto's thyroiditis | ||
| PTC: Papillary thyroid cancer |
| ∗log2FC in expression of this searched gene in stem-like cells from each diseased tissue sample relative to stem-like cells in normal samples in each tissue plotted against the malignancy continuum. Samples are colored based on if they are from different disease stage. |
Top |
Malignant transformation related pathway analysis |
| Find out the enriched GO biological processes and KEGG pathways involved in transition from healthy to precancer to cancer |
| Tissue | Disease Stage | Enriched GO biological Processes |
| Colorectum | AD |  |
| Colorectum | SER |  |
| Colorectum | MSS |  |
| Colorectum | MSI-H |  |
| Colorectum | FAP |  |
| ∗Top 15 enriched GO BP terms are showed in the bar plot of each disease state in each tissue. Each row represents a significant GO biological process which is colored according to the -log10(p.adjust). |
| Page: 1 2 3 4 5 6 7 8 9 |
| GO ID | Tissue | Disease Stage | Description | Gene Ratio | Bg Ratio | pvalue | p.adjust | Count |
| GO:003158928 | Thyroid | ATC | cell-substrate adhesion | 195/6293 | 363/18723 | 1.58e-15 | 1.17e-13 | 195 |
| GO:000150332 | Thyroid | ATC | ossification | 206/6293 | 408/18723 | 9.23e-13 | 3.95e-11 | 206 |
| GO:0007160111 | Thyroid | ATC | cell-matrix adhesion | 128/6293 | 233/18723 | 1.49e-11 | 5.41e-10 | 128 |
| GO:000164932 | Thyroid | ATC | osteoblast differentiation | 122/6293 | 229/18723 | 6.04e-10 | 1.60e-08 | 122 |
| GO:000722919 | Thyroid | ATC | integrin-mediated signaling pathway | 63/6293 | 107/18723 | 7.09e-08 | 1.24e-06 | 63 |
| GO:00336277 | Thyroid | ATC | cell adhesion mediated by integrin | 39/6293 | 72/18723 | 2.59e-04 | 1.66e-03 | 39 |
| GO:000751716 | Thyroid | ATC | muscle organ development | 139/6293 | 327/18723 | 4.45e-04 | 2.64e-03 | 139 |
| Page: 1 |
| Pathway ID | Tissue | Disease Stage | Description | Gene Ratio | Bg Ratio | pvalue | p.adjust | qvalue | Count |
| Page: 1 |
Top |
Cell-cell communication analysis |
| Identification of potential cell-cell interactions between two cell types and their ligand-receptor pairs for different disease states |
| Ligand | Receptor | LRpair | Pathway | Tissue | Disease Stage |
| COL1A1 | ITGA11_ITGB1 | COL1A1_ITGA11_ITGB1 | COLLAGEN | Cervix | ADJ |
| COL1A2 | ITGA11_ITGB1 | COL1A2_ITGA11_ITGB1 | COLLAGEN | Cervix | ADJ |
| COL4A1 | ITGA11_ITGB1 | COL4A1_ITGA11_ITGB1 | COLLAGEN | Cervix | ADJ |
| COL4A2 | ITGA11_ITGB1 | COL4A2_ITGA11_ITGB1 | COLLAGEN | Cervix | ADJ |
| COL6A1 | ITGA11_ITGB1 | COL6A1_ITGA11_ITGB1 | COLLAGEN | Cervix | ADJ |
| COL6A2 | ITGA11_ITGB1 | COL6A2_ITGA11_ITGB1 | COLLAGEN | Cervix | ADJ |
| COL6A3 | ITGA11_ITGB1 | COL6A3_ITGA11_ITGB1 | COLLAGEN | Cervix | ADJ |
| COL1A1 | ITGA11_ITGB1 | COL1A1_ITGA11_ITGB1 | COLLAGEN | Cervix | CC |
| COL1A2 | ITGA11_ITGB1 | COL1A2_ITGA11_ITGB1 | COLLAGEN | Cervix | CC |
| COL4A1 | ITGA11_ITGB1 | COL4A1_ITGA11_ITGB1 | COLLAGEN | Cervix | CC |
| COL4A2 | ITGA11_ITGB1 | COL4A2_ITGA11_ITGB1 | COLLAGEN | Cervix | CC |
| COL4A5 | ITGA11_ITGB1 | COL4A5_ITGA11_ITGB1 | COLLAGEN | Cervix | CC |
| COL6A1 | ITGA11_ITGB1 | COL6A1_ITGA11_ITGB1 | COLLAGEN | Cervix | CC |
| COL6A2 | ITGA11_ITGB1 | COL6A2_ITGA11_ITGB1 | COLLAGEN | Cervix | CC |
| COL6A3 | ITGA11_ITGB1 | COL6A3_ITGA11_ITGB1 | COLLAGEN | Cervix | CC |
| COL9A2 | ITGA11_ITGB1 | COL9A2_ITGA11_ITGB1 | COLLAGEN | Cervix | CC |
| COL1A1 | ITGA11_ITGB1 | COL1A1_ITGA11_ITGB1 | COLLAGEN | CRC | AD |
| COL1A2 | ITGA11_ITGB1 | COL1A2_ITGA11_ITGB1 | COLLAGEN | CRC | AD |
| COL4A1 | ITGA11_ITGB1 | COL4A1_ITGA11_ITGB1 | COLLAGEN | CRC | AD |
| COL4A2 | ITGA11_ITGB1 | COL4A2_ITGA11_ITGB1 | COLLAGEN | CRC | AD |
| Page: 1 |
Top |
Single-cell gene regulatory network inference analysis |
| Find out the significant the regulons (TFs) and the target genes of each regulon across cell types for different disease states |
| TF | Cell Type | Tissue | Disease Stage | Target Gene | RSS | Regulon Activity |
| ∗The dot plots of a searched regulon are shown for all cell subpopulations in each disease state of each tissue based on the regulon specific score inferred using pySCENIC and by calculating the average expression. |
| Page: 1 |
Top |
Somatic mutation of malignant transformation related genes |
| Annotation of somatic variants for genes involved in malignant transformation |
| Hugo Symbol | Variant Class | Variant Classification | dbSNP RS | HGVSc | HGVSp | HGVSp Short | SWISSPROT | BIOTYPE | SIFT | PolyPhen | Tumor Sample Barcode | Tissue | Histology | Sex | Age | Stage | Therapy Types | Drugs | Outcome |
| ITGA11 | SNV | Missense_Mutation | novel | c.1999N>C | p.Thr667Pro | p.T667P | Q9UKX5 | protein_coding | deleterious(0) | probably_damaging(0.933) | TCGA-A2-A0T2-01 | Breast | breast invasive carcinoma | Female | >=65 | III/IV | Chemotherapy | xeloda | PD |
| ITGA11 | SNV | Missense_Mutation | c.393N>A | p.Ser131Arg | p.S131R | Q9UKX5 | protein_coding | deleterious(0) | probably_damaging(0.999) | TCGA-A8-A07J-01 | Breast | breast invasive carcinoma | Female | <65 | I/II | Chemotherapy | 5-fluorouracil | CR | |
| ITGA11 | SNV | Missense_Mutation | rs764191309 | c.2269C>A | p.Pro757Thr | p.P757T | Q9UKX5 | protein_coding | tolerated(0.59) | benign(0.328) | TCGA-A8-A09Z-01 | Breast | breast invasive carcinoma | Female | >=65 | I/II | Unknown | Unknown | SD |
| ITGA11 | SNV | Missense_Mutation | novel | c.2651N>G | p.Glu884Gly | p.E884G | Q9UKX5 | protein_coding | tolerated(0.18) | possibly_damaging(0.859) | TCGA-AN-A0FJ-01 | Breast | breast invasive carcinoma | Female | <65 | III/IV | Unknown | Unknown | SD |
| ITGA11 | SNV | Missense_Mutation | rs754150729 | c.115N>A | p.Ala39Thr | p.A39T | Q9UKX5 | protein_coding | tolerated(0.13) | benign(0.121) | TCGA-AN-A0FJ-01 | Breast | breast invasive carcinoma | Female | <65 | III/IV | Unknown | Unknown | SD |
| ITGA11 | SNV | Missense_Mutation | c.800N>C | p.Ile267Thr | p.I267T | Q9UKX5 | protein_coding | deleterious(0) | possibly_damaging(0.737) | TCGA-BH-A0C0-01 | Breast | breast invasive carcinoma | Female | <65 | I/II | Chemotherapy | carboplatin | SD | |
| ITGA11 | SNV | Missense_Mutation | novel | c.2737N>A | p.Glu913Lys | p.E913K | Q9UKX5 | protein_coding | deleterious(0) | probably_damaging(1) | TCGA-D8-A73U-01 | Breast | breast invasive carcinoma | Female | >=65 | I/II | Hormone Therapy | tamoxiphen | SD |
| ITGA11 | SNV | Missense_Mutation | rs748013291 | c.2387N>A | p.Arg796Gln | p.R796Q | Q9UKX5 | protein_coding | tolerated(0.34) | benign(0.003) | TCGA-E2-A1BD-01 | Breast | breast invasive carcinoma | Female | <65 | I/II | Hormone Therapy | arimidex | SD |
| ITGA11 | SNV | Missense_Mutation | novel | c.1165N>C | p.Asp389His | p.D389H | Q9UKX5 | protein_coding | deleterious(0) | probably_damaging(0.957) | TCGA-OL-A5DA-01 | Breast | breast invasive carcinoma | Female | <65 | I/II | Unknown | Unknown | SD |
| ITGA11 | insertion | Nonsense_Mutation | novel | c.192_193insGTCTAAGGGAAGAGGGTGCCTGGTTGGTGGCA | p.Asn65ValfsTer2 | p.N65Vfs*2 | Q9UKX5 | protein_coding | TCGA-A8-A079-01 | Breast | breast invasive carcinoma | Female | >=65 | III/IV | Chemotherapy | 5-fluorouracil | SD |
| Page: 1 2 3 4 5 6 7 8 9 10 11 12 13 |
Top |
Related drugs of malignant transformation related genes |
| Identification of chemicals and drugs interact with genes involved in malignant transfromation |
| (DGIdb 4.0) |
| Entrez ID | Symbol | Category | Interaction Types | Drug Claim Name | Drug Name | PMIDs |
| 22801 | ITGA11 | DRUGGABLE GENOME, EXTERNAL SIDE OF PLASMA MEMBRANE | IFN | 16697656 |
| Page: 1 |

Copyright 2023-Present -The University of Texas Health Science Center at Houston |