
|
|||||
|
 | |
| |
| |
| |
| |
| |
|
Gene: ITFG2 |
Gene summary for ITFG2 |
| Gene information | Species | Human | Gene symbol | ITFG2 | Gene ID | 55846 |
| Gene name | integrin alpha FG-GAP repeat containing 2 | |
| Gene Alias | FGGAP1 | |
| Cytomap | 12p13.33 | |
| Gene Type | protein-coding | GO ID | GO:0001775 | UniProtAcc | A0A0S2Z5P1 |
Top |
Malignant transformation analysis |
| Identification of the aberrant gene expression in precancerous and cancerous lesions by comparing the gene expression of stem-like cells in diseased tissues with normal stem cells |
| Entrez ID | Symbol | Replicates | Species | Organ | Tissue | Adj P-value | Log2FC | Malignancy |
| 55846 | ITFG2 | CCI_2 | Human | Cervix | CC | 8.22e-05 | 5.85e-01 | 0.5249 |
| 55846 | ITFG2 | CCI_3 | Human | Cervix | CC | 9.83e-12 | 7.11e-01 | 0.516 |
| 55846 | ITFG2 | LZE4T | Human | Esophagus | ESCC | 4.37e-02 | 1.38e-01 | 0.0811 |
| 55846 | ITFG2 | LZE7T | Human | Esophagus | ESCC | 3.27e-03 | 2.59e-01 | 0.0667 |
| 55846 | ITFG2 | LZE8T | Human | Esophagus | ESCC | 5.08e-03 | 1.65e-01 | 0.067 |
| 55846 | ITFG2 | LZE20T | Human | Esophagus | ESCC | 2.36e-02 | 1.84e-01 | 0.0662 |
| 55846 | ITFG2 | LZE22T | Human | Esophagus | ESCC | 2.75e-05 | 2.84e-01 | 0.068 |
| 55846 | ITFG2 | LZE24T | Human | Esophagus | ESCC | 8.85e-04 | 1.67e-01 | 0.0596 |
| 55846 | ITFG2 | P1T-E | Human | Esophagus | ESCC | 4.74e-06 | 4.07e-01 | 0.0875 |
| 55846 | ITFG2 | P2T-E | Human | Esophagus | ESCC | 7.18e-39 | 6.75e-01 | 0.1177 |
| 55846 | ITFG2 | P4T-E | Human | Esophagus | ESCC | 6.46e-17 | 4.46e-01 | 0.1323 |
| 55846 | ITFG2 | P5T-E | Human | Esophagus | ESCC | 4.95e-05 | 1.38e-01 | 0.1327 |
| 55846 | ITFG2 | P8T-E | Human | Esophagus | ESCC | 1.75e-13 | 2.73e-01 | 0.0889 |
| 55846 | ITFG2 | P9T-E | Human | Esophagus | ESCC | 4.04e-06 | 1.31e-01 | 0.1131 |
| 55846 | ITFG2 | P10T-E | Human | Esophagus | ESCC | 1.39e-25 | 4.95e-01 | 0.116 |
| 55846 | ITFG2 | P11T-E | Human | Esophagus | ESCC | 3.92e-12 | 3.25e-01 | 0.1426 |
| 55846 | ITFG2 | P12T-E | Human | Esophagus | ESCC | 4.69e-30 | 5.68e-01 | 0.1122 |
| 55846 | ITFG2 | P15T-E | Human | Esophagus | ESCC | 5.39e-10 | 2.33e-01 | 0.1149 |
| 55846 | ITFG2 | P16T-E | Human | Esophagus | ESCC | 4.54e-17 | 3.41e-01 | 0.1153 |
| 55846 | ITFG2 | P17T-E | Human | Esophagus | ESCC | 8.94e-08 | 3.19e-01 | 0.1278 |
| Page: 1 2 3 4 |
| Tissue | Expression Dynamics | Abbreviation |
| Cervix |  | CC: Cervix cancer |
| HSIL_HPV: HPV-infected high-grade squamous intraepithelial lesions | ||
| N_HPV: HPV-infected normal cervix | ||
| Esophagus | 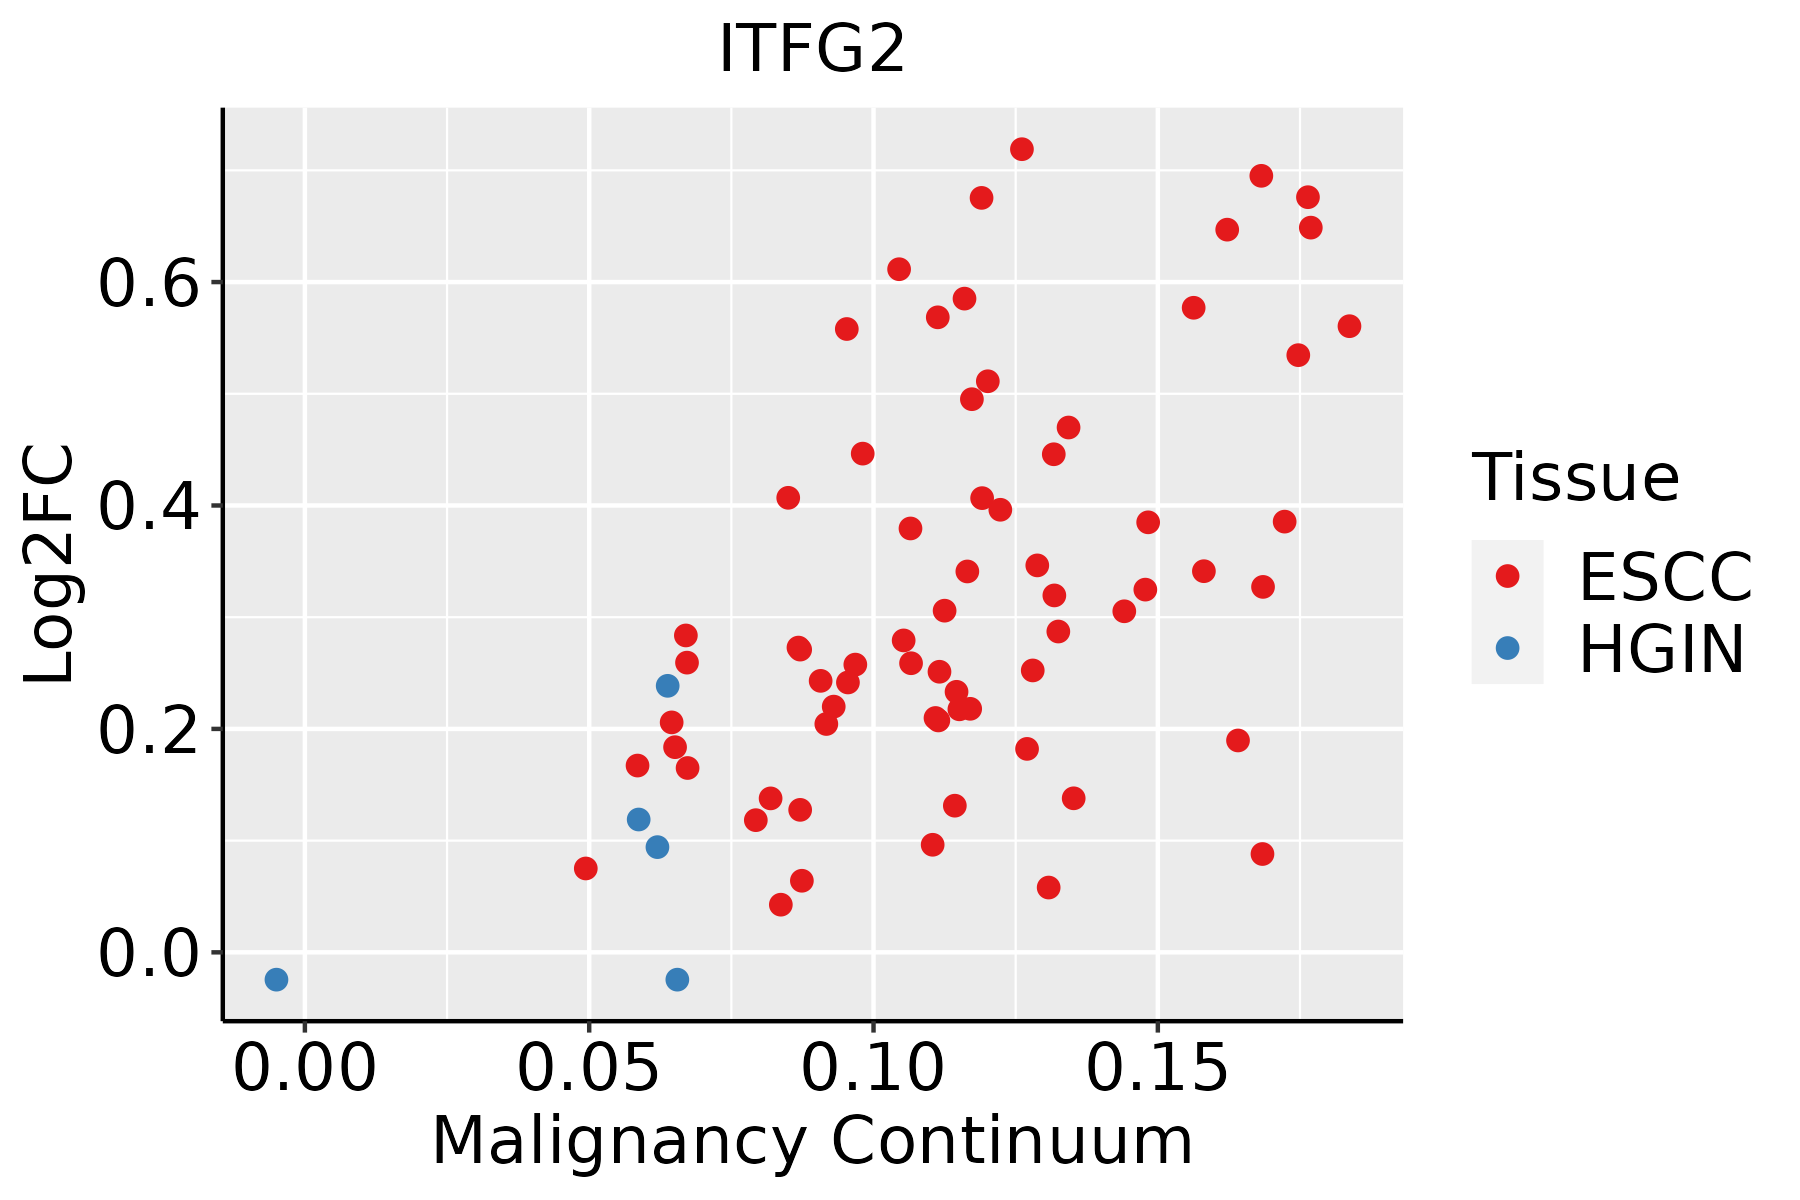 | ESCC: Esophageal squamous cell carcinoma |
| HGIN: High-grade intraepithelial neoplasias | ||
| LGIN: Low-grade intraepithelial neoplasias | ||
| Oral Cavity | 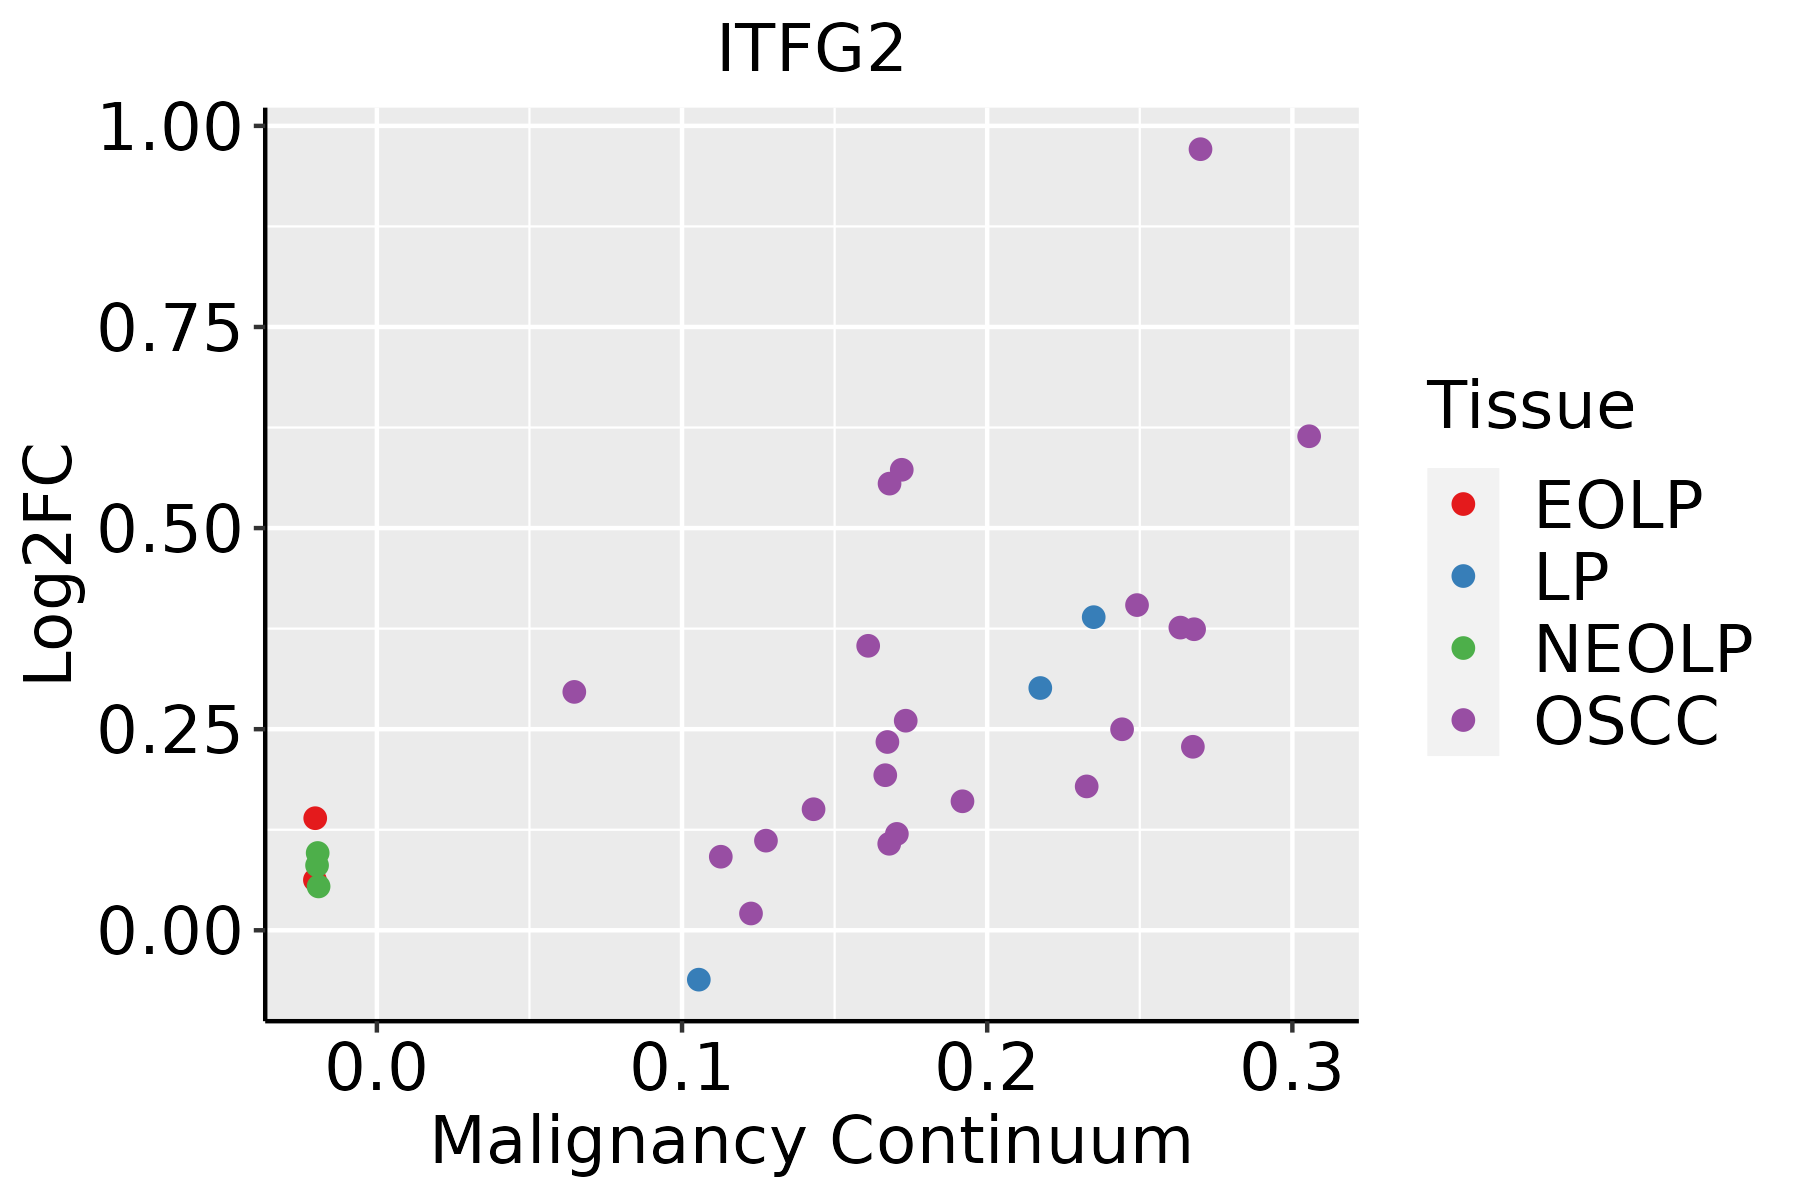 | EOLP: Erosive Oral lichen planus |
| LP: leukoplakia | ||
| NEOLP: Non-erosive oral lichen planus | ||
| OSCC: Oral squamous cell carcinoma |
| ∗log2FC in expression of this searched gene in stem-like cells from each diseased tissue sample relative to stem-like cells in normal samples in each tissue plotted against the malignancy continuum. Samples are colored based on if they are from different disease stage. |
Top |
Malignant transformation related pathway analysis |
| Find out the enriched GO biological processes and KEGG pathways involved in transition from healthy to precancer to cancer |
| Tissue | Disease Stage | Enriched GO biological Processes |
| Colorectum | AD |  |
| Colorectum | SER |  |
| Colorectum | MSS |  |
| Colorectum | MSI-H |  |
| Colorectum | FAP |  |
| ∗Top 15 enriched GO BP terms are showed in the bar plot of each disease state in each tissue. Each row represents a significant GO biological process which is colored according to the -log10(p.adjust). |
| Page: 1 2 3 4 5 6 7 8 9 |
| GO ID | Tissue | Disease Stage | Description | Gene Ratio | Bg Ratio | pvalue | p.adjust | Count |
| GO:007149610 | Cervix | CC | cellular response to external stimulus | 78/2311 | 320/18723 | 1.82e-09 | 1.98e-07 | 78 |
| GO:00316689 | Cervix | CC | cellular response to extracellular stimulus | 59/2311 | 246/18723 | 3.03e-07 | 1.24e-05 | 59 |
| GO:003166710 | Cervix | CC | response to nutrient levels | 92/2311 | 474/18723 | 5.80e-06 | 1.42e-04 | 92 |
| GO:00092678 | Cervix | CC | cellular response to starvation | 39/2311 | 156/18723 | 1.04e-05 | 2.32e-04 | 39 |
| GO:00425948 | Cervix | CC | response to starvation | 46/2311 | 197/18723 | 1.24e-05 | 2.59e-04 | 46 |
| GO:00316698 | Cervix | CC | cellular response to nutrient levels | 49/2311 | 215/18723 | 1.32e-05 | 2.68e-04 | 49 |
| GO:19031314 | Cervix | CC | mononuclear cell differentiation | 76/2311 | 426/18723 | 5.66e-04 | 5.42e-03 | 76 |
| GO:0002263 | Cervix | CC | cell activation involved in immune response | 50/2311 | 279/18723 | 4.16e-03 | 2.57e-02 | 50 |
| GO:00300981 | Cervix | CC | lymphocyte differentiation | 63/2311 | 374/18723 | 6.21e-03 | 3.52e-02 | 63 |
| GO:0071496111 | Esophagus | ESCC | cellular response to external stimulus | 215/8552 | 320/18723 | 4.29e-15 | 2.43e-13 | 215 |
| GO:0031668111 | Esophagus | ESCC | cellular response to extracellular stimulus | 168/8552 | 246/18723 | 4.93e-13 | 2.23e-11 | 168 |
| GO:0031669110 | Esophagus | ESCC | cellular response to nutrient levels | 148/8552 | 215/18723 | 4.58e-12 | 1.76e-10 | 148 |
| GO:0031667111 | Esophagus | ESCC | response to nutrient levels | 289/8552 | 474/18723 | 9.25e-12 | 3.47e-10 | 289 |
| GO:0009267110 | Esophagus | ESCC | cellular response to starvation | 110/8552 | 156/18723 | 2.63e-10 | 7.37e-09 | 110 |
| GO:004259419 | Esophagus | ESCC | response to starvation | 133/8552 | 197/18723 | 4.31e-10 | 1.14e-08 | 133 |
| GO:19909284 | Esophagus | ESCC | response to amino acid starvation | 37/8552 | 49/18723 | 2.05e-05 | 1.78e-04 | 37 |
| GO:00421492 | Esophagus | ESCC | cellular response to glucose starvation | 36/8552 | 48/18723 | 3.43e-05 | 2.80e-04 | 36 |
| GO:00319294 | Esophagus | ESCC | TOR signaling | 79/8552 | 126/18723 | 8.57e-05 | 6.21e-04 | 79 |
| GO:00341984 | Esophagus | ESCC | cellular response to amino acid starvation | 34/8552 | 46/18723 | 9.39e-05 | 6.70e-04 | 34 |
| GO:19031317 | Esophagus | ESCC | mononuclear cell differentiation | 226/8552 | 426/18723 | 1.20e-03 | 5.88e-03 | 226 |
| Page: 1 2 3 |
| Pathway ID | Tissue | Disease Stage | Description | Gene Ratio | Bg Ratio | pvalue | p.adjust | qvalue | Count |
| Page: 1 |
Top |
Cell-cell communication analysis |
| Identification of potential cell-cell interactions between two cell types and their ligand-receptor pairs for different disease states |
| Ligand | Receptor | LRpair | Pathway | Tissue | Disease Stage |
| Page: 1 |
Top |
Single-cell gene regulatory network inference analysis |
| Find out the significant the regulons (TFs) and the target genes of each regulon across cell types for different disease states |
| TF | Cell Type | Tissue | Disease Stage | Target Gene | RSS | Regulon Activity |
| ∗The dot plots of a searched regulon are shown for all cell subpopulations in each disease state of each tissue based on the regulon specific score inferred using pySCENIC and by calculating the average expression. |
| Page: 1 |
Top |
Somatic mutation of malignant transformation related genes |
| Annotation of somatic variants for genes involved in malignant transformation |
| Hugo Symbol | Variant Class | Variant Classification | dbSNP RS | HGVSc | HGVSp | HGVSp Short | SWISSPROT | BIOTYPE | SIFT | PolyPhen | Tumor Sample Barcode | Tissue | Histology | Sex | Age | Stage | Therapy Types | Drugs | Outcome |
| ITFG2 | SNV | Missense_Mutation | c.340N>A | p.Glu114Lys | p.E114K | Q969R8 | protein_coding | tolerated(0.09) | benign(0.257) | TCGA-BH-A0HF-01 | Breast | breast invasive carcinoma | Female | >=65 | I/II | Hormone Therapy | arimidex | SD | |
| ITFG2 | deletion | Frame_Shift_Del | c.983delN | p.Asp329MetfsTer67 | p.D329Mfs*67 | Q969R8 | protein_coding | TCGA-EW-A2FV-01 | Breast | breast invasive carcinoma | Female | <65 | III/IV | Chemotherapy | docetaxel | SD | |||
| ITFG2 | SNV | Missense_Mutation | rs764678751 | c.37N>A | p.Glu13Lys | p.E13K | Q969R8 | protein_coding | deleterious(0.01) | benign(0.045) | TCGA-VS-A958-01 | Cervix | cervical & endocervical cancer | Female | <65 | I/II | Chemotherapy | cisplatin | CR |
| ITFG2 | SNV | Missense_Mutation | novel | c.224A>T | p.Asn75Ile | p.N75I | Q969R8 | protein_coding | deleterious(0) | probably_damaging(0.997) | TCGA-AA-3837-01 | Colorectum | colon adenocarcinoma | Male | >=65 | I/II | Unknown | Unknown | SD |
| ITFG2 | SNV | Missense_Mutation | c.268T>C | p.Phe90Leu | p.F90L | Q969R8 | protein_coding | tolerated(0.5) | benign(0.003) | TCGA-AD-6964-01 | Colorectum | colon adenocarcinoma | Male | <65 | III/IV | Chemotherapy | folfox | PD | |
| ITFG2 | SNV | Missense_Mutation | c.547G>T | p.Val183Leu | p.V183L | Q969R8 | protein_coding | deleterious(0.01) | probably_damaging(0.978) | TCGA-CK-4951-01 | Colorectum | colon adenocarcinoma | Female | >=65 | I/II | Unknown | Unknown | PD | |
| ITFG2 | SNV | Missense_Mutation | rs150266212 | c.743G>A | p.Arg248His | p.R248H | Q969R8 | protein_coding | tolerated(0.07) | possibly_damaging(0.719) | TCGA-CK-4951-01 | Colorectum | colon adenocarcinoma | Female | >=65 | I/II | Unknown | Unknown | PD |
| ITFG2 | SNV | Missense_Mutation | c.560N>T | p.Ser187Leu | p.S187L | Q969R8 | protein_coding | deleterious(0) | benign(0.335) | TCGA-CK-6751-01 | Colorectum | colon adenocarcinoma | Female | >=65 | I/II | Unknown | Unknown | SD | |
| ITFG2 | SNV | Missense_Mutation | rs751542855 | c.1162C>T | p.Arg388Trp | p.R388W | Q969R8 | protein_coding | deleterious(0) | probably_damaging(0.998) | TCGA-AG-3592-01 | Colorectum | rectum adenocarcinoma | Male | >=65 | I/II | Unknown | Unknown | SD |
| ITFG2 | SNV | Missense_Mutation | c.525N>T | p.Lys175Asn | p.K175N | Q969R8 | protein_coding | tolerated(0.28) | probably_damaging(0.994) | TCGA-AG-A002-01 | Colorectum | rectum adenocarcinoma | Male | <65 | I/II | Unknown | Unknown | SD |
| Page: 1 2 3 4 5 |
Top |
Related drugs of malignant transformation related genes |
| Identification of chemicals and drugs interact with genes involved in malignant transfromation |
| (DGIdb 4.0) |
| Entrez ID | Symbol | Category | Interaction Types | Drug Claim Name | Drug Name | PMIDs |
| Page: 1 |

Copyright 2023-Present -The University of Texas Health Science Center at Houston |