
|
|||||
|
 | |
| |
| |
| |
| |
| |
|
Gene: ISYNA1 |
Gene summary for ISYNA1 |
| Gene information | Species | Human | Gene symbol | ISYNA1 | Gene ID | 51477 |
| Gene name | inositol-3-phosphate synthase 1 | |
| Gene Alias | INO1 | |
| Cytomap | 19p13.11 | |
| Gene Type | protein-coding | GO ID | GO:0005975 | UniProtAcc | Q9NPH2 |
Top |
Malignant transformation analysis |
| Identification of the aberrant gene expression in precancerous and cancerous lesions by comparing the gene expression of stem-like cells in diseased tissues with normal stem cells |
| Entrez ID | Symbol | Replicates | Species | Organ | Tissue | Adj P-value | Log2FC | Malignancy |
| 51477 | ISYNA1 | LZE4T | Human | Esophagus | ESCC | 3.00e-17 | 4.25e-01 | 0.0811 |
| 51477 | ISYNA1 | LZE5T | Human | Esophagus | ESCC | 1.24e-02 | 4.08e-01 | 0.0514 |
| 51477 | ISYNA1 | LZE7T | Human | Esophagus | ESCC | 5.29e-21 | 1.00e+00 | 0.0667 |
| 51477 | ISYNA1 | LZE8T | Human | Esophagus | ESCC | 9.88e-08 | 3.29e-01 | 0.067 |
| 51477 | ISYNA1 | LZE21D1 | Human | Esophagus | HGIN | 2.77e-04 | 4.28e-01 | 0.0632 |
| 51477 | ISYNA1 | LZE22T | Human | Esophagus | ESCC | 1.35e-09 | 7.40e-01 | 0.068 |
| 51477 | ISYNA1 | LZE24T | Human | Esophagus | ESCC | 1.31e-20 | 5.25e-01 | 0.0596 |
| 51477 | ISYNA1 | LZE21T | Human | Esophagus | ESCC | 1.17e-03 | 2.87e-01 | 0.0655 |
| 51477 | ISYNA1 | LZE6T | Human | Esophagus | ESCC | 8.47e-11 | 5.58e-01 | 0.0845 |
| 51477 | ISYNA1 | P1T-E | Human | Esophagus | ESCC | 1.31e-06 | 4.22e-01 | 0.0875 |
| 51477 | ISYNA1 | P2T-E | Human | Esophagus | ESCC | 6.42e-82 | 1.41e+00 | 0.1177 |
| 51477 | ISYNA1 | P4T-E | Human | Esophagus | ESCC | 1.11e-46 | 1.02e+00 | 0.1323 |
| 51477 | ISYNA1 | P5T-E | Human | Esophagus | ESCC | 4.32e-35 | 9.25e-01 | 0.1327 |
| 51477 | ISYNA1 | P8T-E | Human | Esophagus | ESCC | 3.86e-59 | 1.29e+00 | 0.0889 |
| 51477 | ISYNA1 | P9T-E | Human | Esophagus | ESCC | 1.27e-19 | 4.69e-01 | 0.1131 |
| 51477 | ISYNA1 | P10T-E | Human | Esophagus | ESCC | 7.74e-41 | 8.94e-01 | 0.116 |
| 51477 | ISYNA1 | P11T-E | Human | Esophagus | ESCC | 2.09e-28 | 9.68e-01 | 0.1426 |
| 51477 | ISYNA1 | P12T-E | Human | Esophagus | ESCC | 4.20e-68 | 1.36e+00 | 0.1122 |
| 51477 | ISYNA1 | P15T-E | Human | Esophagus | ESCC | 1.63e-39 | 8.26e-01 | 0.1149 |
| 51477 | ISYNA1 | P16T-E | Human | Esophagus | ESCC | 1.43e-53 | 8.81e-01 | 0.1153 |
| Page: 1 2 3 4 5 6 |
| Tissue | Expression Dynamics | Abbreviation |
| Esophagus | 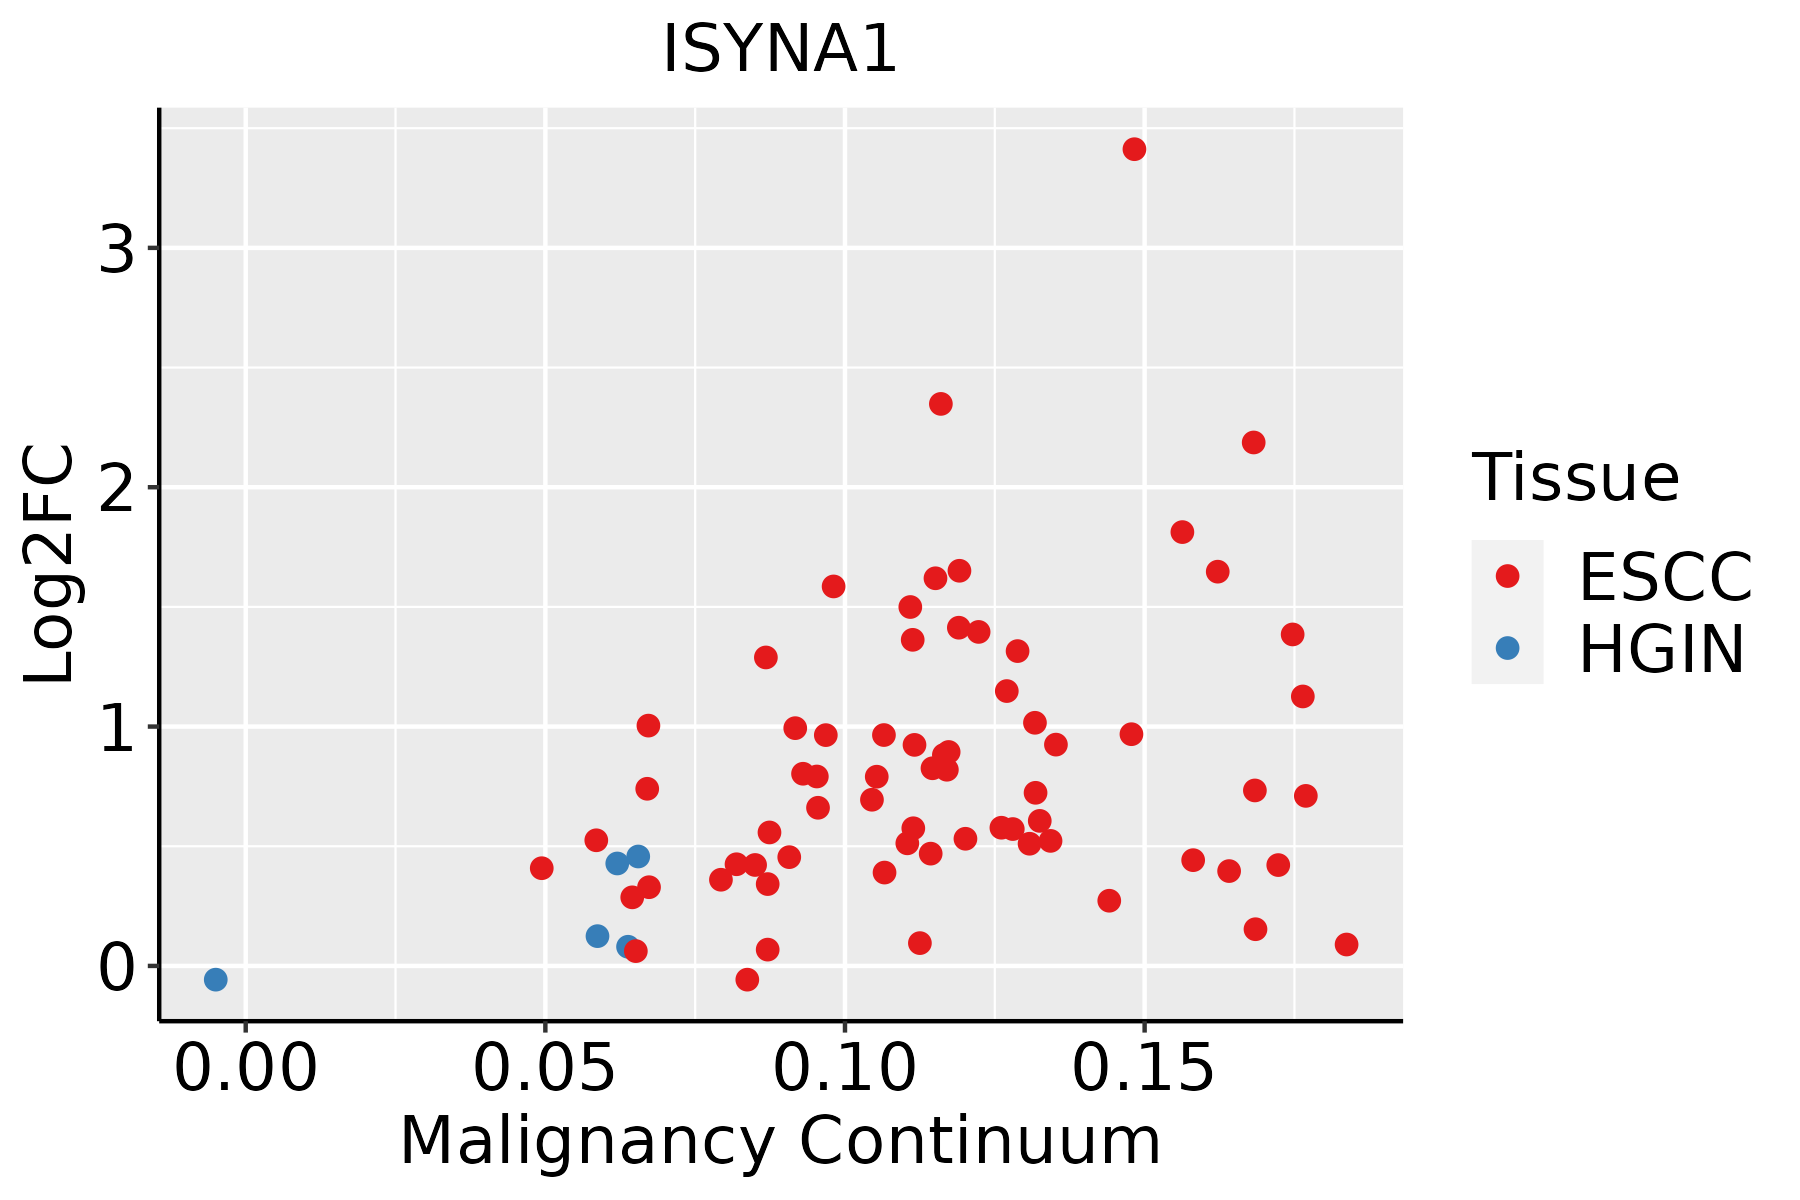 | ESCC: Esophageal squamous cell carcinoma |
| HGIN: High-grade intraepithelial neoplasias | ||
| LGIN: Low-grade intraepithelial neoplasias | ||
| Liver | 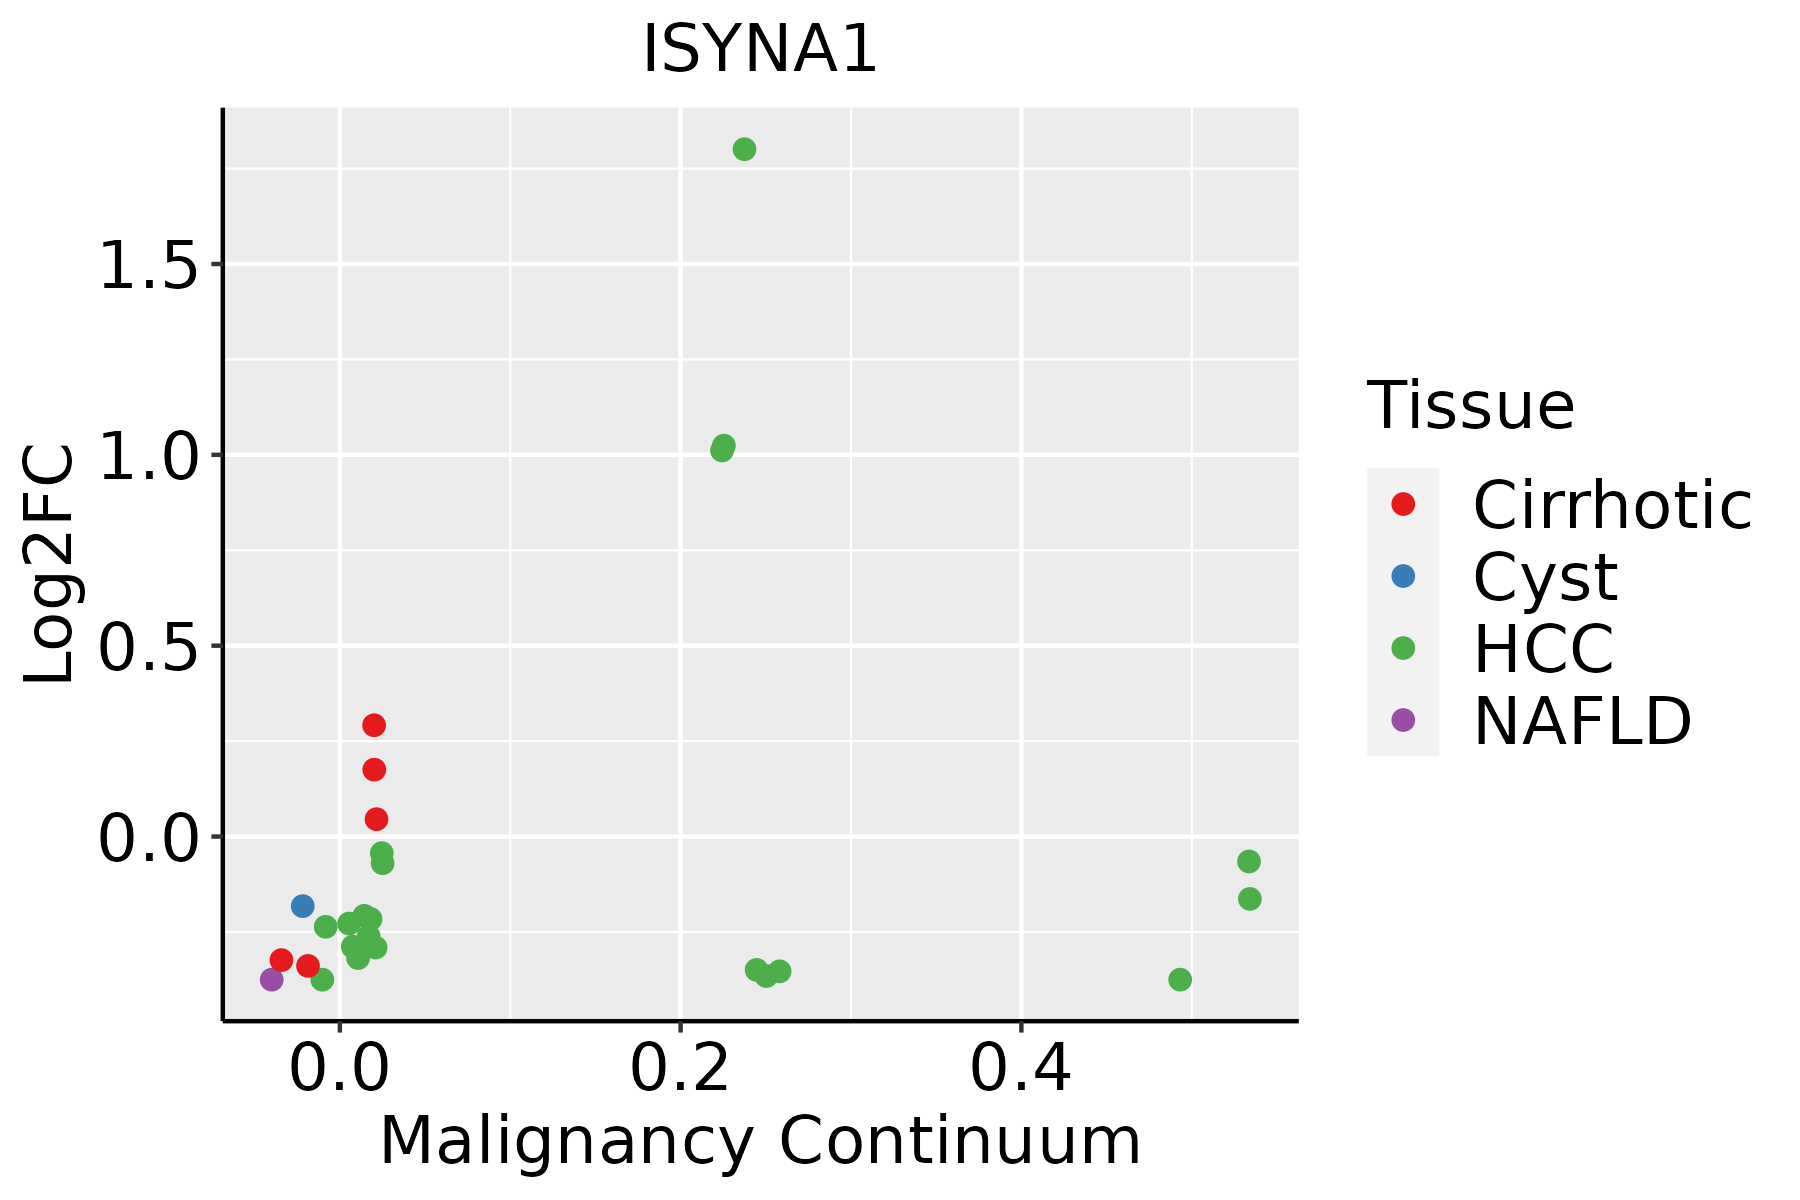 | HCC: Hepatocellular carcinoma |
| NAFLD: Non-alcoholic fatty liver disease | ||
| Oral Cavity |  | EOLP: Erosive Oral lichen planus |
| LP: leukoplakia | ||
| NEOLP: Non-erosive oral lichen planus | ||
| OSCC: Oral squamous cell carcinoma | ||
| Thyroid | 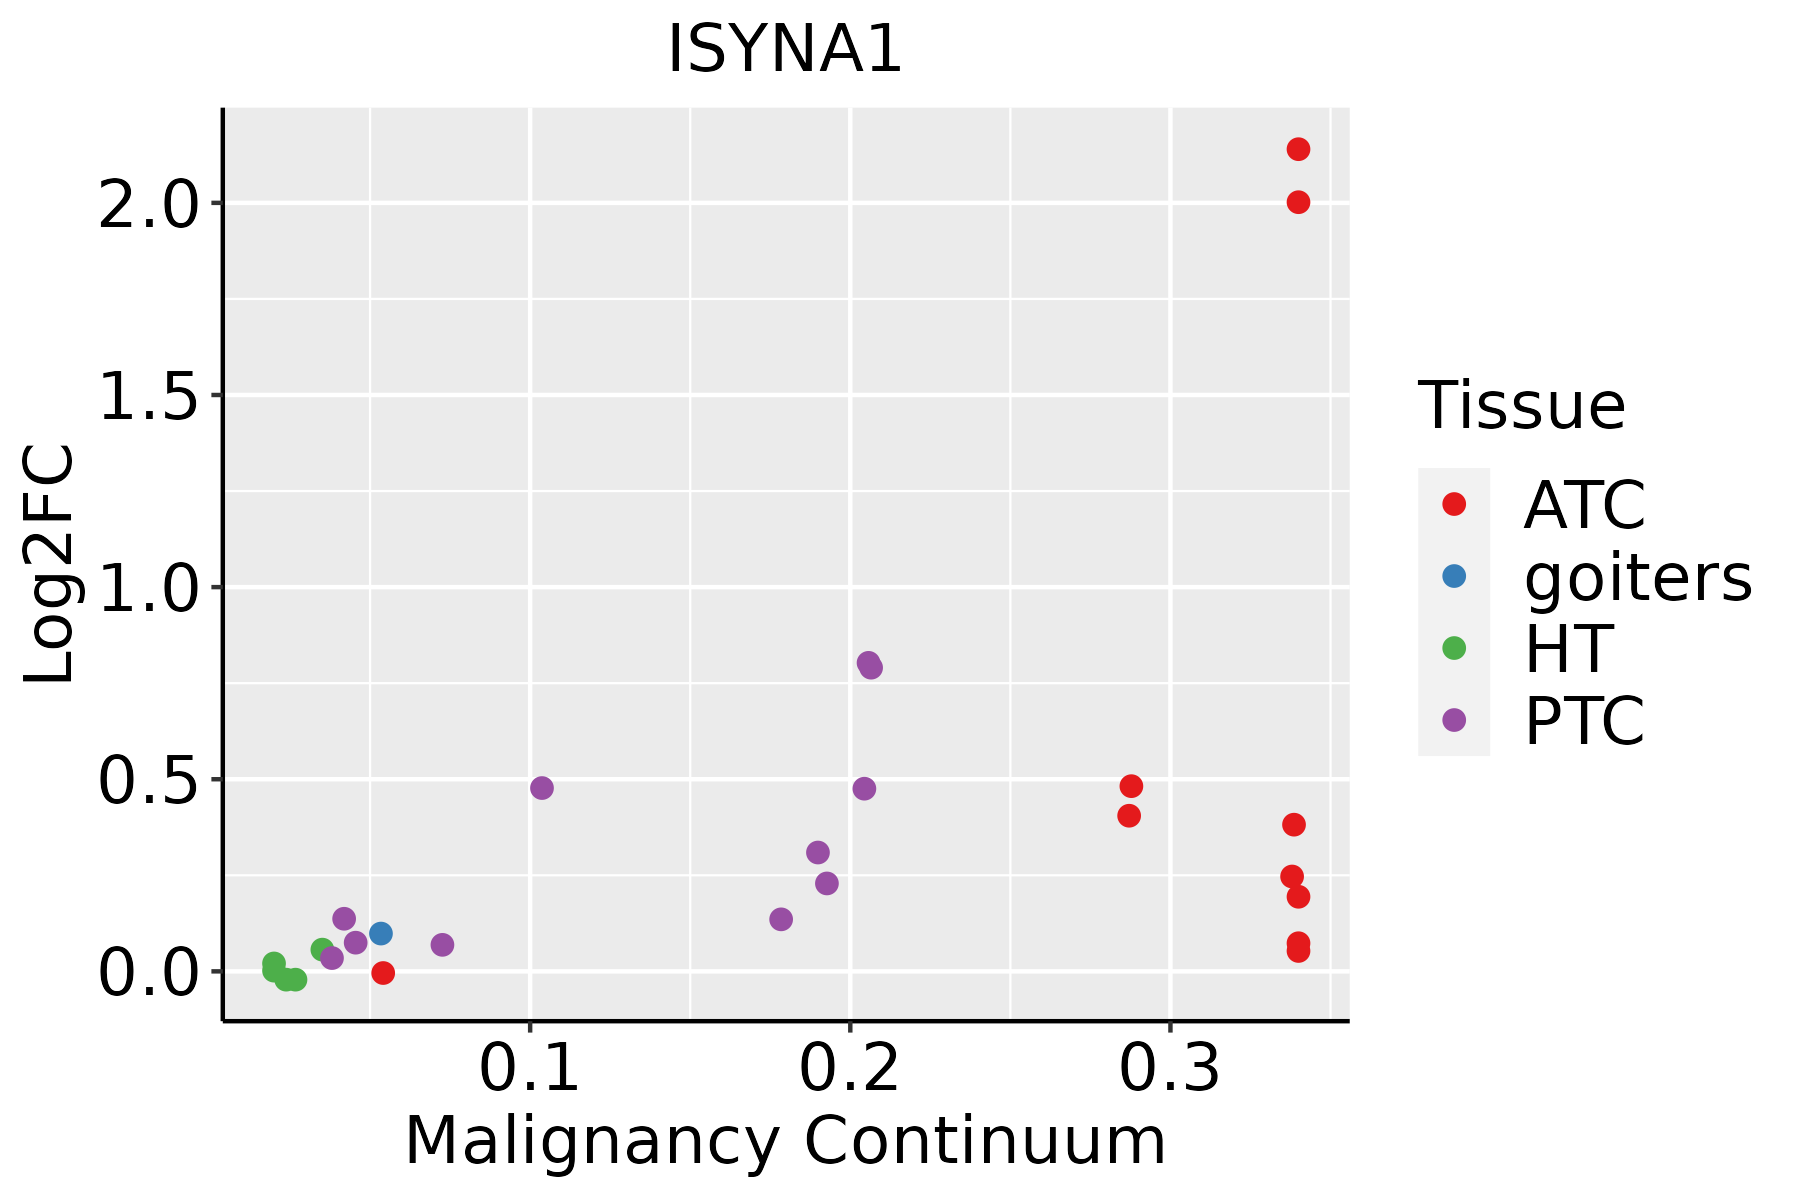 | ATC: Anaplastic thyroid cancer |
| HT: Hashimoto's thyroiditis | ||
| PTC: Papillary thyroid cancer |
| ∗log2FC in expression of this searched gene in stem-like cells from each diseased tissue sample relative to stem-like cells in normal samples in each tissue plotted against the malignancy continuum. Samples are colored based on if they are from different disease stage. |
Top |
Malignant transformation related pathway analysis |
| Find out the enriched GO biological processes and KEGG pathways involved in transition from healthy to precancer to cancer |
| Tissue | Disease Stage | Enriched GO biological Processes |
| Colorectum | AD |  |
| Colorectum | SER |  |
| Colorectum | MSS |  |
| Colorectum | MSI-H |  |
| Colorectum | FAP |  |
| ∗Top 15 enriched GO BP terms are showed in the bar plot of each disease state in each tissue. Each row represents a significant GO biological process which is colored according to the -log10(p.adjust). |
| Page: 1 2 3 4 5 6 7 8 9 |
| GO ID | Tissue | Disease Stage | Description | Gene Ratio | Bg Ratio | pvalue | p.adjust | Count |
| GO:00086544 | Esophagus | ESCC | phospholipid biosynthetic process | 162/8552 | 253/18723 | 2.59e-09 | 5.73e-08 | 162 |
| GO:00066446 | Esophagus | ESCC | phospholipid metabolic process | 218/8552 | 383/18723 | 5.37e-06 | 5.59e-05 | 218 |
| GO:00060668 | Esophagus | ESCC | alcohol metabolic process | 202/8552 | 353/18723 | 7.32e-06 | 7.26e-05 | 202 |
| GO:00442626 | Esophagus | ESCC | cellular carbohydrate metabolic process | 160/8552 | 283/18723 | 1.43e-04 | 9.66e-04 | 160 |
| GO:00160514 | Esophagus | ESCC | carbohydrate biosynthetic process | 117/8552 | 202/18723 | 2.96e-04 | 1.79e-03 | 117 |
| GO:00461653 | Esophagus | ESCC | alcohol biosynthetic process | 83/8552 | 140/18723 | 8.04e-04 | 4.16e-03 | 83 |
| GO:19016174 | Esophagus | ESCC | organic hydroxy compound biosynthetic process | 128/8552 | 237/18723 | 5.86e-03 | 2.16e-02 | 128 |
| GO:00346372 | Esophagus | ESCC | cellular carbohydrate biosynthetic process | 46/8552 | 78/18723 | 1.24e-02 | 4.13e-02 | 46 |
| GO:000606612 | Liver | Cirrhotic | alcohol metabolic process | 141/4634 | 353/18723 | 1.57e-10 | 8.03e-09 | 141 |
| GO:0046165 | Liver | Cirrhotic | alcohol biosynthetic process | 55/4634 | 140/18723 | 9.74e-05 | 1.03e-03 | 55 |
| GO:004426211 | Liver | Cirrhotic | cellular carbohydrate metabolic process | 97/4634 | 283/18723 | 1.89e-04 | 1.76e-03 | 97 |
| GO:00160511 | Liver | Cirrhotic | carbohydrate biosynthetic process | 73/4634 | 202/18723 | 1.91e-04 | 1.77e-03 | 73 |
| GO:19016171 | Liver | Cirrhotic | organic hydroxy compound biosynthetic process | 81/4634 | 237/18723 | 6.73e-04 | 5.06e-03 | 81 |
| GO:000606621 | Liver | HCC | alcohol metabolic process | 208/7958 | 353/18723 | 2.80e-10 | 9.50e-09 | 208 |
| GO:00086542 | Liver | HCC | phospholipid biosynthetic process | 150/7958 | 253/18723 | 4.77e-08 | 1.03e-06 | 150 |
| GO:00066444 | Liver | HCC | phospholipid metabolic process | 214/7958 | 383/18723 | 7.25e-08 | 1.48e-06 | 214 |
| GO:004426221 | Liver | HCC | cellular carbohydrate metabolic process | 153/7958 | 283/18723 | 5.27e-05 | 5.00e-04 | 153 |
| GO:00160512 | Liver | HCC | carbohydrate biosynthetic process | 113/7958 | 202/18723 | 7.64e-05 | 6.83e-04 | 113 |
| GO:19016172 | Liver | HCC | organic hydroxy compound biosynthetic process | 129/7958 | 237/18723 | 1.32e-04 | 1.08e-03 | 129 |
| GO:00461651 | Liver | HCC | alcohol biosynthetic process | 81/7958 | 140/18723 | 1.73e-04 | 1.36e-03 | 81 |
| Page: 1 2 |
| Pathway ID | Tissue | Disease Stage | Description | Gene Ratio | Bg Ratio | pvalue | p.adjust | qvalue | Count |
| Page: 1 |
Top |
Cell-cell communication analysis |
| Identification of potential cell-cell interactions between two cell types and their ligand-receptor pairs for different disease states |
| Ligand | Receptor | LRpair | Pathway | Tissue | Disease Stage |
| Page: 1 |
Top |
Single-cell gene regulatory network inference analysis |
| Find out the significant the regulons (TFs) and the target genes of each regulon across cell types for different disease states |
| TF | Cell Type | Tissue | Disease Stage | Target Gene | RSS | Regulon Activity |
| ∗The dot plots of a searched regulon are shown for all cell subpopulations in each disease state of each tissue based on the regulon specific score inferred using pySCENIC and by calculating the average expression. |
| Page: 1 |
Top |
Somatic mutation of malignant transformation related genes |
| Annotation of somatic variants for genes involved in malignant transformation |
| Hugo Symbol | Variant Class | Variant Classification | dbSNP RS | HGVSc | HGVSp | HGVSp Short | SWISSPROT | BIOTYPE | SIFT | PolyPhen | Tumor Sample Barcode | Tissue | Histology | Sex | Age | Stage | Therapy Types | Drugs | Outcome |
| ISYNA1 | SNV | Missense_Mutation | c.1249N>C | p.Cys417Arg | p.C417R | Q9NPH2 | protein_coding | deleterious(0) | probably_damaging(1) | TCGA-AR-A1AL-01 | Breast | breast invasive carcinoma | Female | <65 | III/IV | Hormone Therapy | anastrozole | SD | |
| ISYNA1 | SNV | Missense_Mutation | novel | c.1415N>A | p.Gly472Asp | p.G472D | Q9NPH2 | protein_coding | deleterious(0.02) | benign(0.35) | TCGA-BH-A0HI-01 | Breast | breast invasive carcinoma | Female | >=65 | I/II | Hormone Therapy | arimidex | SD |
| ISYNA1 | SNV | Missense_Mutation | c.1493N>A | p.Pro498Gln | p.P498Q | Q9NPH2 | protein_coding | deleterious(0.01) | probably_damaging(0.957) | TCGA-E2-A1IL-01 | Breast | breast invasive carcinoma | Female | >=65 | I/II | Hormone Therapy | arimidex | SD | |
| ISYNA1 | SNV | Missense_Mutation | c.1490N>T | p.Pro497Leu | p.P497L | Q9NPH2 | protein_coding | deleterious(0) | possibly_damaging(0.75) | TCGA-E9-A1RF-01 | Breast | breast invasive carcinoma | Female | >=65 | III/IV | Hormone Therapy | tamoxiphen | SD | |
| ISYNA1 | SNV | Missense_Mutation | rs772915404 | c.1433N>T | p.Ala478Val | p.A478V | Q9NPH2 | protein_coding | deleterious(0.01) | probably_damaging(0.924) | TCGA-2W-A8YY-01 | Cervix | cervical & endocervical cancer | Female | <65 | I/II | Chemotherapy | cisplatin | CR |
| ISYNA1 | SNV | Missense_Mutation | rs751639570 | c.400G>A | p.Asp134Asn | p.D134N | Q9NPH2 | protein_coding | tolerated(0.07) | benign(0.209) | TCGA-EK-A3GK-01 | Cervix | cervical & endocervical cancer | Female | <65 | I/II | Unknown | Unknown | SD |
| ISYNA1 | SNV | Missense_Mutation | novel | c.829N>G | p.Asn277Asp | p.N277D | Q9NPH2 | protein_coding | deleterious(0) | probably_damaging(0.999) | TCGA-A6-3809-01 | Colorectum | colon adenocarcinoma | Female | >=65 | I/II | Unknown | Unknown | SD |
| ISYNA1 | SNV | Missense_Mutation | c.1387C>A | p.Leu463Ile | p.L463I | Q9NPH2 | protein_coding | deleterious(0.03) | probably_damaging(0.967) | TCGA-AD-5900-01 | Colorectum | colon adenocarcinoma | Male | >=65 | I/II | Unknown | Unknown | SD | |
| ISYNA1 | SNV | Missense_Mutation | c.370N>G | p.Ser124Gly | p.S124G | Q9NPH2 | protein_coding | tolerated(0.06) | benign(0.005) | TCGA-CK-6746-01 | Colorectum | colon adenocarcinoma | Female | >=65 | I/II | Unknown | Unknown | SD | |
| ISYNA1 | SNV | Missense_Mutation | c.962N>A | p.Gly321Asp | p.G321D | Q9NPH2 | protein_coding | tolerated(0.22) | possibly_damaging(0.673) | TCGA-G4-6628-01 | Colorectum | colon adenocarcinoma | Male | >=65 | I/II | Unknown | Unknown | SD |
| Page: 1 2 3 4 |
Top |
Related drugs of malignant transformation related genes |
| Identification of chemicals and drugs interact with genes involved in malignant transfromation |
| (DGIdb 4.0) |
| Entrez ID | Symbol | Category | Interaction Types | Drug Claim Name | Drug Name | PMIDs |
| Page: 1 |

Copyright 2023-Present -The University of Texas Health Science Center at Houston |