
|
|||||
|
 | |
| |
| |
| |
| |
| |
|
Gene: ISY1 |
Gene summary for ISY1 |
| Gene information | Species | Human | Gene symbol | ISY1 | Gene ID | 57461 |
| Gene name | ISY1 splicing factor homolog | |
| Gene Alias | FSAP33 | |
| Cytomap | 3q21.3 | |
| Gene Type | protein-coding | GO ID | GO:0000245 | UniProtAcc | Q9ULR0 |
Top |
Malignant transformation analysis |
| Identification of the aberrant gene expression in precancerous and cancerous lesions by comparing the gene expression of stem-like cells in diseased tissues with normal stem cells |
| Entrez ID | Symbol | Replicates | Species | Organ | Tissue | Adj P-value | Log2FC | Malignancy |
| 57461 | ISY1 | HTA11_3410_2000001011 | Human | Colorectum | AD | 3.47e-03 | 1.00e-01 | 0.0155 |
| 57461 | ISY1 | HTA11_2487_2000001011 | Human | Colorectum | SER | 2.44e-05 | 1.78e-01 | -0.1808 |
| 57461 | ISY1 | HTA11_1938_2000001011 | Human | Colorectum | AD | 6.59e-07 | 2.41e-01 | -0.0811 |
| 57461 | ISY1 | HTA11_78_2000001011 | Human | Colorectum | AD | 7.65e-07 | 2.11e-01 | -0.1088 |
| 57461 | ISY1 | HTA11_347_2000001011 | Human | Colorectum | AD | 4.64e-18 | 3.14e-01 | -0.1954 |
| 57461 | ISY1 | HTA11_411_2000001011 | Human | Colorectum | SER | 7.44e-09 | 5.36e-01 | -0.2602 |
| 57461 | ISY1 | HTA11_3361_2000001011 | Human | Colorectum | AD | 3.26e-04 | 1.55e-01 | -0.1207 |
| 57461 | ISY1 | HTA11_83_2000001011 | Human | Colorectum | SER | 8.73e-04 | 1.89e-01 | -0.1526 |
| 57461 | ISY1 | HTA11_696_2000001011 | Human | Colorectum | AD | 1.66e-12 | 2.70e-01 | -0.1464 |
| 57461 | ISY1 | HTA11_866_2000001011 | Human | Colorectum | AD | 2.28e-09 | 2.34e-01 | -0.1001 |
| 57461 | ISY1 | HTA11_1391_2000001011 | Human | Colorectum | AD | 1.00e-14 | 3.36e-01 | -0.059 |
| 57461 | ISY1 | HTA11_2992_2000001011 | Human | Colorectum | SER | 1.94e-06 | 2.85e-01 | -0.1706 |
| 57461 | ISY1 | HTA11_5212_2000001011 | Human | Colorectum | AD | 2.28e-02 | 1.91e-01 | -0.2061 |
| 57461 | ISY1 | HTA11_546_2000001011 | Human | Colorectum | AD | 2.65e-04 | 2.28e-01 | -0.0842 |
| 57461 | ISY1 | HTA11_866_3004761011 | Human | Colorectum | AD | 1.67e-10 | 2.31e-01 | 0.096 |
| 57461 | ISY1 | HTA11_7663_2000001011 | Human | Colorectum | SER | 6.29e-03 | 2.29e-01 | 0.0131 |
| 57461 | ISY1 | HTA11_10623_2000001011 | Human | Colorectum | AD | 6.46e-07 | 2.79e-01 | -0.0177 |
| 57461 | ISY1 | HTA11_10711_2000001011 | Human | Colorectum | AD | 6.02e-03 | 1.23e-01 | 0.0338 |
| 57461 | ISY1 | HTA11_7696_3000711011 | Human | Colorectum | AD | 8.44e-08 | 2.21e-01 | 0.0674 |
| 57461 | ISY1 | HTA11_6818_2000001011 | Human | Colorectum | AD | 2.70e-04 | 2.72e-01 | 0.0112 |
| Page: 1 2 3 4 5 6 7 |
| Tissue | Expression Dynamics | Abbreviation |
| Colorectum (GSE201348) |  | FAP: Familial adenomatous polyposis |
| CRC: Colorectal cancer | ||
| Colorectum (HTA11) |  | AD: Adenomas |
| SER: Sessile serrated lesions | ||
| MSI-H: Microsatellite-high colorectal cancer | ||
| MSS: Microsatellite stable colorectal cancer | ||
| Esophagus | 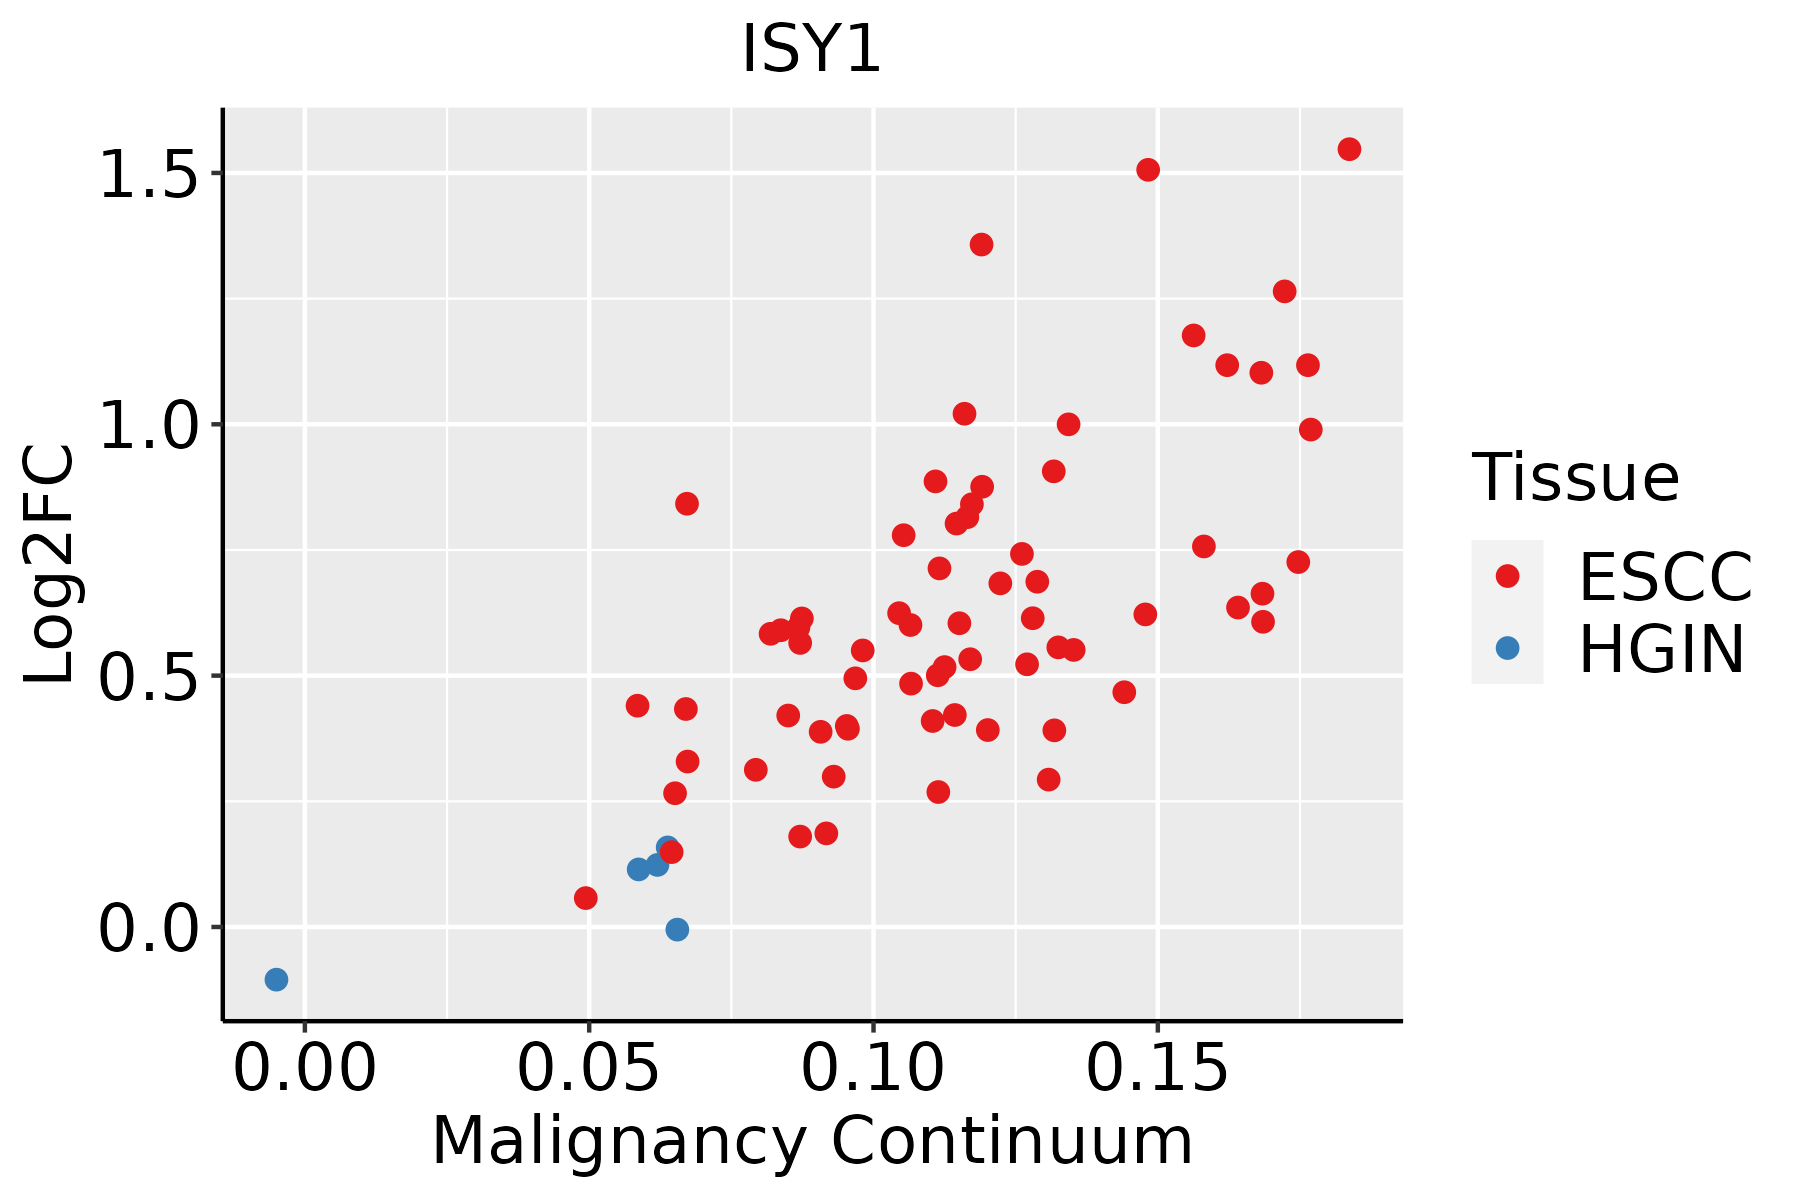 | ESCC: Esophageal squamous cell carcinoma |
| HGIN: High-grade intraepithelial neoplasias | ||
| LGIN: Low-grade intraepithelial neoplasias | ||
| Liver | 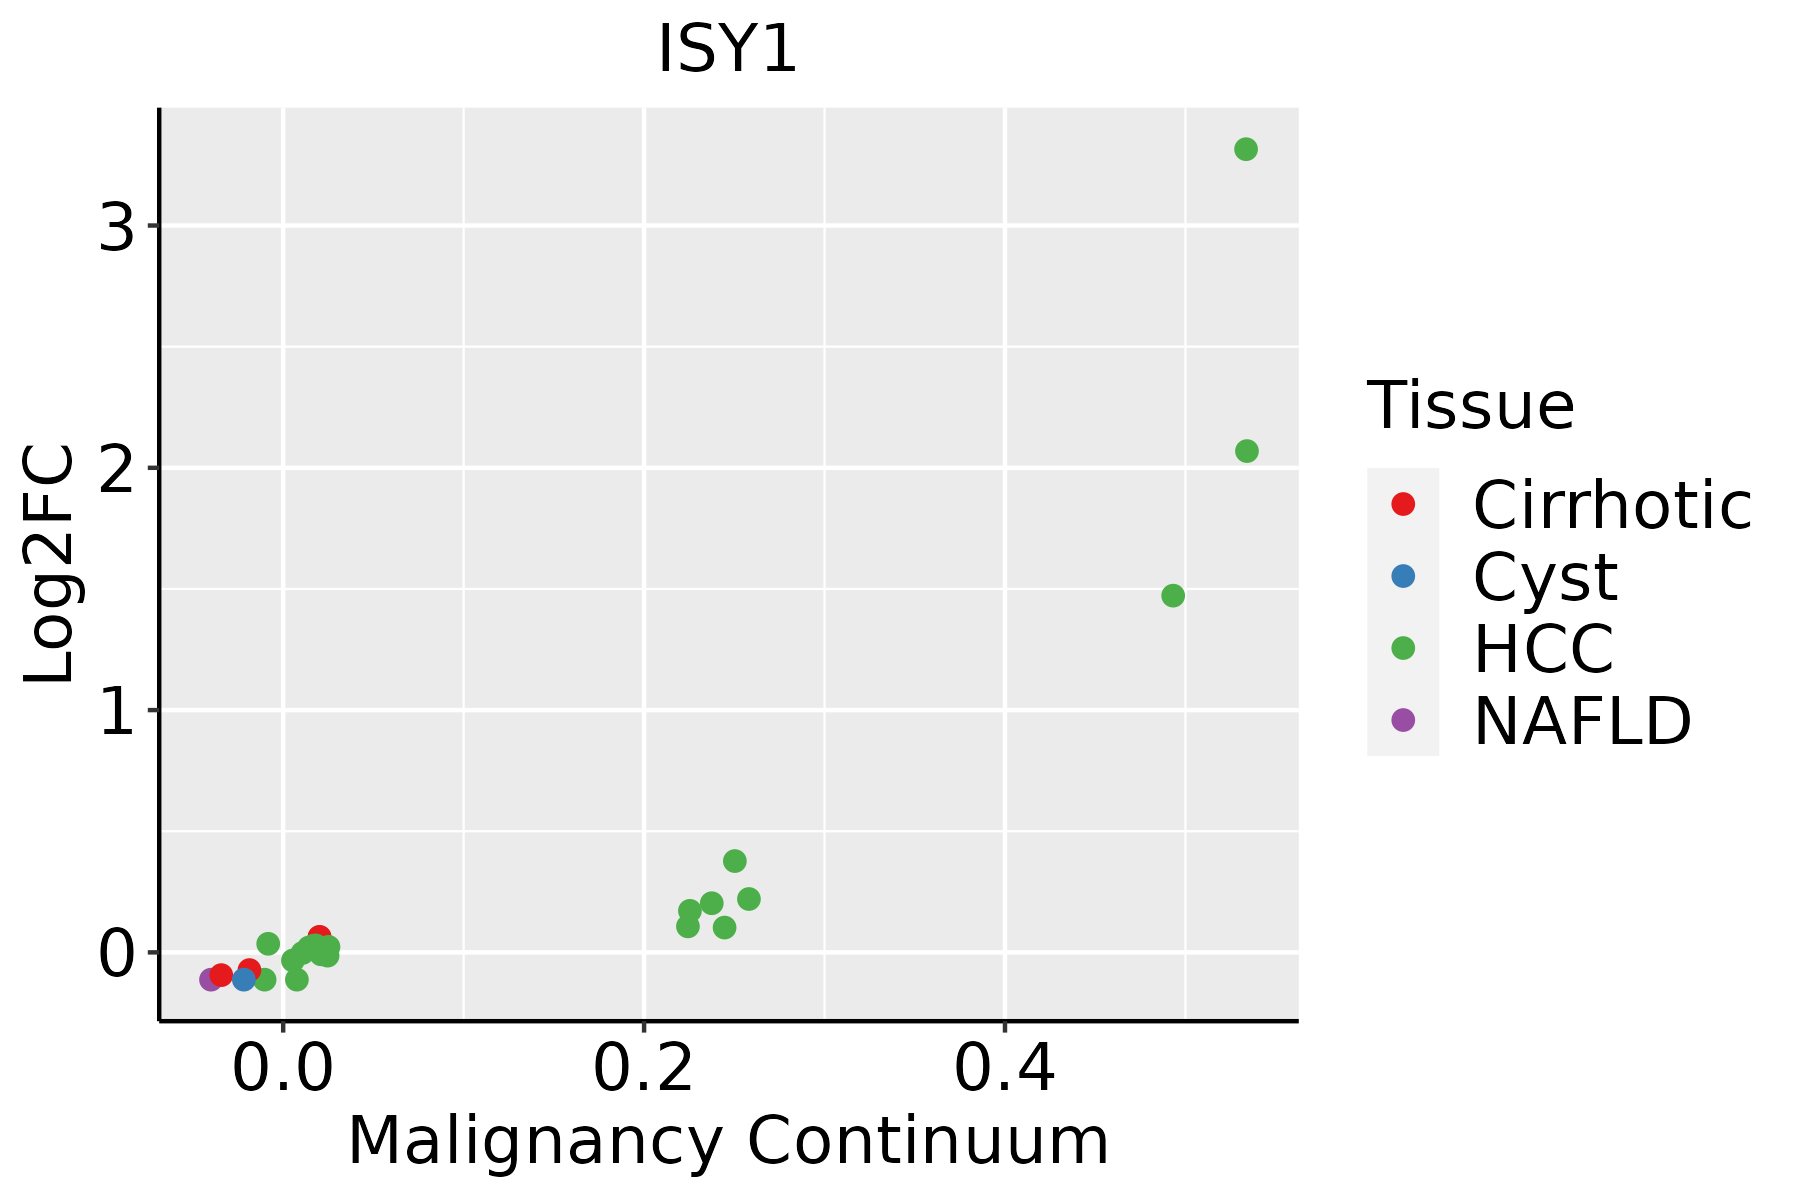 | HCC: Hepatocellular carcinoma |
| NAFLD: Non-alcoholic fatty liver disease | ||
| Oral Cavity | 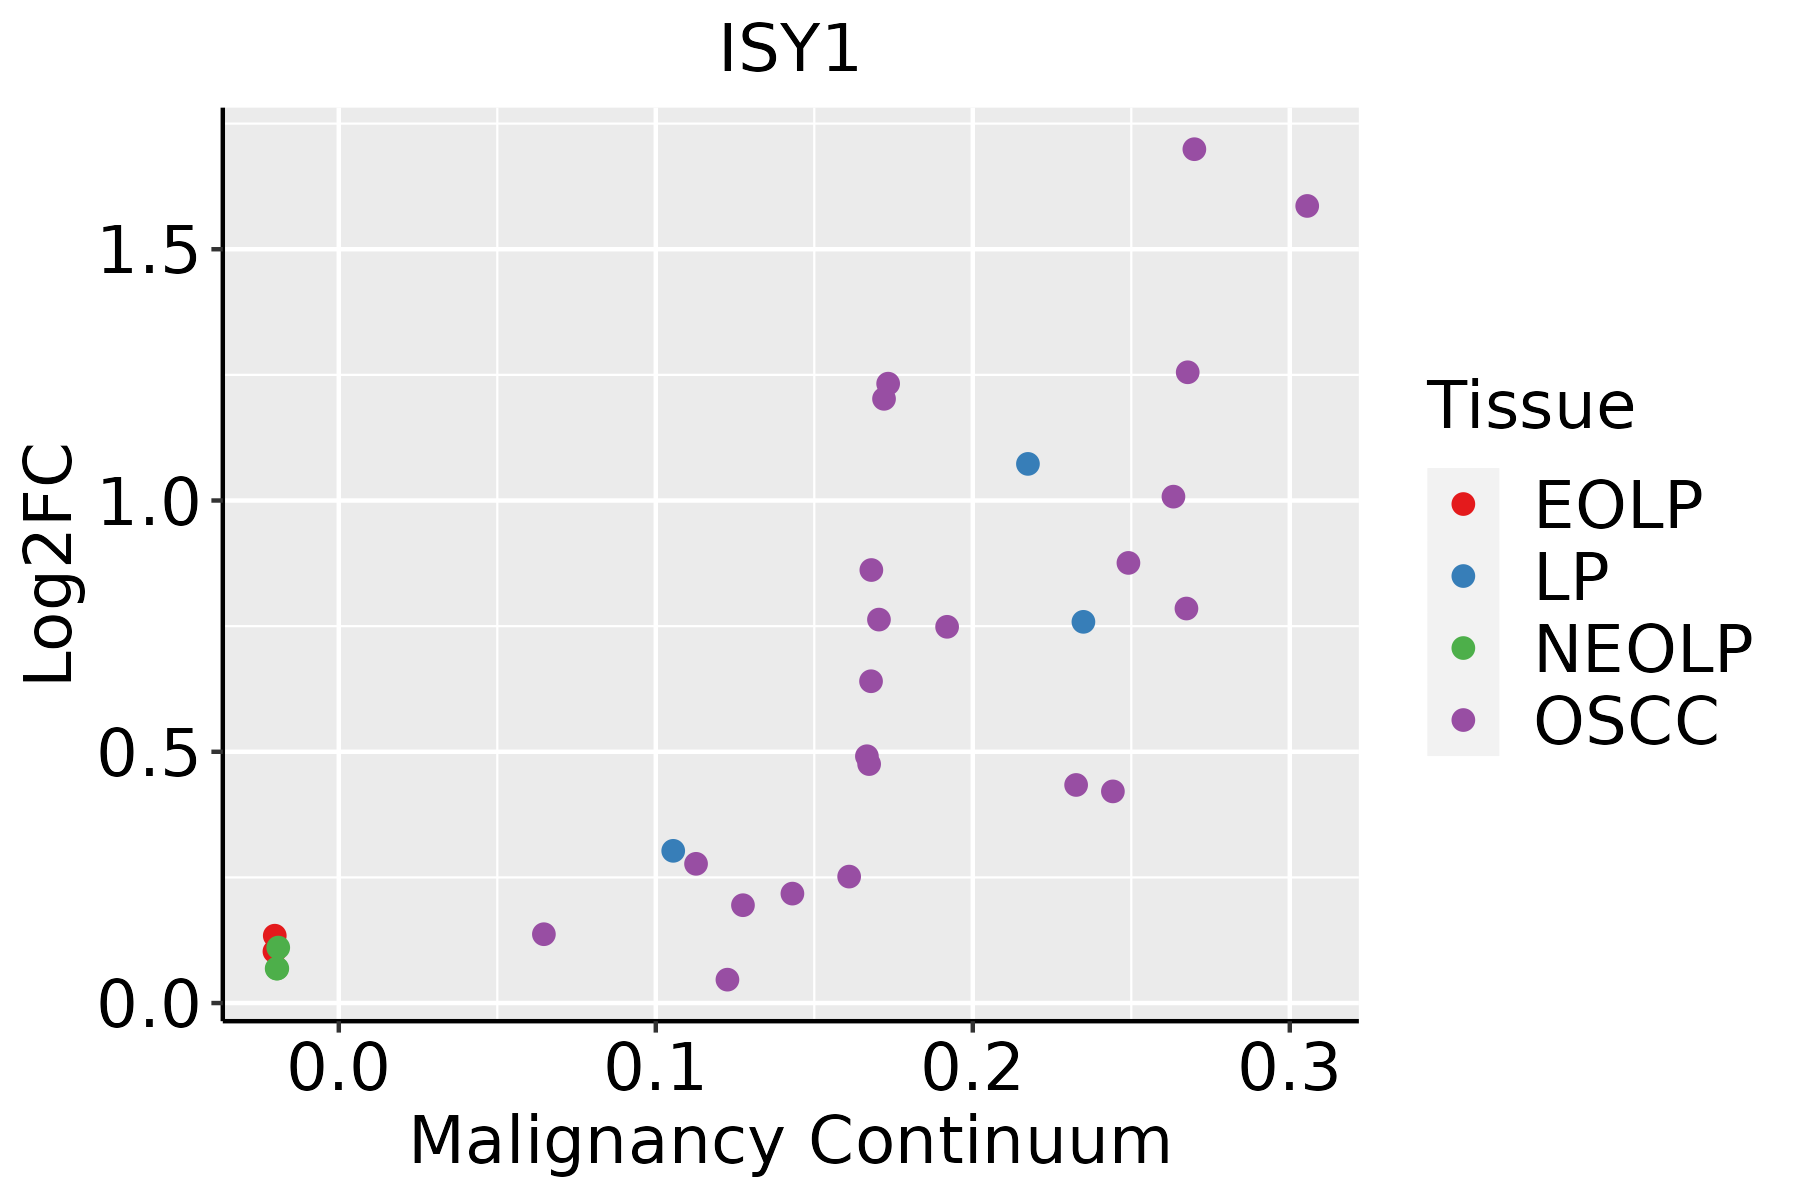 | EOLP: Erosive Oral lichen planus |
| LP: leukoplakia | ||
| NEOLP: Non-erosive oral lichen planus | ||
| OSCC: Oral squamous cell carcinoma | ||
| Skin |  | AK: Actinic keratosis |
| cSCC: Cutaneous squamous cell carcinoma | ||
| SCCIS:squamous cell carcinoma in situ |
| ∗log2FC in expression of this searched gene in stem-like cells from each diseased tissue sample relative to stem-like cells in normal samples in each tissue plotted against the malignancy continuum. Samples are colored based on if they are from different disease stage. |
Top |
Malignant transformation related pathway analysis |
| Find out the enriched GO biological processes and KEGG pathways involved in transition from healthy to precancer to cancer |
| Tissue | Disease Stage | Enriched GO biological Processes |
| Colorectum | AD |  |
| Colorectum | SER |  |
| Colorectum | MSS |  |
| Colorectum | MSI-H |  |
| Colorectum | FAP |  |
| ∗Top 15 enriched GO BP terms are showed in the bar plot of each disease state in each tissue. Each row represents a significant GO biological process which is colored according to the -log10(p.adjust). |
| Page: 1 2 3 4 5 6 7 8 9 |
| GO ID | Tissue | Disease Stage | Description | Gene Ratio | Bg Ratio | pvalue | p.adjust | Count |
| GO:0008380 | Colorectum | AD | RNA splicing | 169/3918 | 434/18723 | 3.59e-18 | 2.04e-15 | 169 |
| GO:0000377 | Colorectum | AD | RNA splicing, via transesterification reactions with bulged adenosine as nucleophile | 130/3918 | 320/18723 | 5.88e-16 | 2.16e-13 | 130 |
| GO:0000398 | Colorectum | AD | mRNA splicing, via spliceosome | 130/3918 | 320/18723 | 5.88e-16 | 2.16e-13 | 130 |
| GO:0000375 | Colorectum | AD | RNA splicing, via transesterification reactions | 131/3918 | 324/18723 | 7.11e-16 | 2.22e-13 | 131 |
| GO:0022618 | Colorectum | AD | ribonucleoprotein complex assembly | 92/3918 | 220/18723 | 1.49e-12 | 2.60e-10 | 92 |
| GO:0071826 | Colorectum | AD | ribonucleoprotein complex subunit organization | 94/3918 | 227/18723 | 1.70e-12 | 2.87e-10 | 94 |
| GO:0022613 | Colorectum | AD | ribonucleoprotein complex biogenesis | 151/3918 | 463/18723 | 1.96e-09 | 1.39e-07 | 151 |
| GO:0000245 | Colorectum | AD | spliceosomal complex assembly | 33/3918 | 79/18723 | 2.15e-05 | 4.33e-04 | 33 |
| GO:0006376 | Colorectum | AD | mRNA splice site selection | 18/3918 | 49/18723 | 7.93e-03 | 4.73e-02 | 18 |
| GO:00083801 | Colorectum | SER | RNA splicing | 123/2897 | 434/18723 | 3.84e-12 | 8.41e-10 | 123 |
| GO:00226181 | Colorectum | SER | ribonucleoprotein complex assembly | 69/2897 | 220/18723 | 2.25e-09 | 2.15e-07 | 69 |
| GO:00718261 | Colorectum | SER | ribonucleoprotein complex subunit organization | 70/2897 | 227/18723 | 3.83e-09 | 3.51e-07 | 70 |
| GO:00003751 | Colorectum | SER | RNA splicing, via transesterification reactions | 90/2897 | 324/18723 | 8.68e-09 | 7.50e-07 | 90 |
| GO:00003771 | Colorectum | SER | RNA splicing, via transesterification reactions with bulged adenosine as nucleophile | 89/2897 | 320/18723 | 9.82e-09 | 8.14e-07 | 89 |
| GO:00003981 | Colorectum | SER | mRNA splicing, via spliceosome | 89/2897 | 320/18723 | 9.82e-09 | 8.14e-07 | 89 |
| GO:00226131 | Colorectum | SER | ribonucleoprotein complex biogenesis | 112/2897 | 463/18723 | 5.01e-07 | 2.48e-05 | 112 |
| GO:00083802 | Colorectum | MSS | RNA splicing | 159/3467 | 434/18723 | 1.75e-19 | 1.22e-16 | 159 |
| GO:00003772 | Colorectum | MSS | RNA splicing, via transesterification reactions with bulged adenosine as nucleophile | 121/3467 | 320/18723 | 2.52e-16 | 8.27e-14 | 121 |
| GO:00003982 | Colorectum | MSS | mRNA splicing, via spliceosome | 121/3467 | 320/18723 | 2.52e-16 | 8.27e-14 | 121 |
| GO:00003752 | Colorectum | MSS | RNA splicing, via transesterification reactions | 122/3467 | 324/18723 | 2.75e-16 | 8.58e-14 | 122 |
| Page: 1 2 3 4 5 |
| Pathway ID | Tissue | Disease Stage | Description | Gene Ratio | Bg Ratio | pvalue | p.adjust | qvalue | Count |
| hsa03040 | Colorectum | AD | Spliceosome | 73/2092 | 217/8465 | 1.73e-03 | 9.68e-03 | 6.18e-03 | 73 |
| hsa030401 | Colorectum | AD | Spliceosome | 73/2092 | 217/8465 | 1.73e-03 | 9.68e-03 | 6.18e-03 | 73 |
| hsa030402 | Colorectum | MSS | Spliceosome | 66/1875 | 217/8465 | 2.58e-03 | 1.27e-02 | 7.81e-03 | 66 |
| hsa030403 | Colorectum | MSS | Spliceosome | 66/1875 | 217/8465 | 2.58e-03 | 1.27e-02 | 7.81e-03 | 66 |
| hsa030404 | Colorectum | MSI-H | Spliceosome | 37/797 | 217/8465 | 2.49e-04 | 3.23e-03 | 2.70e-03 | 37 |
| hsa030405 | Colorectum | MSI-H | Spliceosome | 37/797 | 217/8465 | 2.49e-04 | 3.23e-03 | 2.70e-03 | 37 |
| hsa0304018 | Esophagus | HGIN | Spliceosome | 79/1383 | 217/8465 | 3.22e-13 | 7.00e-12 | 5.56e-12 | 79 |
| hsa0304019 | Esophagus | HGIN | Spliceosome | 79/1383 | 217/8465 | 3.22e-13 | 7.00e-12 | 5.56e-12 | 79 |
| hsa0304027 | Esophagus | ESCC | Spliceosome | 128/4205 | 217/8465 | 3.31e-03 | 8.79e-03 | 4.50e-03 | 128 |
| hsa0304037 | Esophagus | ESCC | Spliceosome | 128/4205 | 217/8465 | 3.31e-03 | 8.79e-03 | 4.50e-03 | 128 |
| hsa030407 | Liver | Cirrhotic | Spliceosome | 102/2530 | 217/8465 | 5.69e-08 | 9.47e-07 | 5.84e-07 | 102 |
| hsa0304012 | Liver | Cirrhotic | Spliceosome | 102/2530 | 217/8465 | 5.69e-08 | 9.47e-07 | 5.84e-07 | 102 |
| hsa0304022 | Liver | HCC | Spliceosome | 122/4020 | 217/8465 | 5.55e-03 | 1.60e-02 | 8.91e-03 | 122 |
| hsa0304032 | Liver | HCC | Spliceosome | 122/4020 | 217/8465 | 5.55e-03 | 1.60e-02 | 8.91e-03 | 122 |
| hsa0304016 | Oral cavity | OSCC | Spliceosome | 123/3704 | 217/8465 | 7.21e-05 | 2.74e-04 | 1.40e-04 | 123 |
| hsa0304017 | Oral cavity | OSCC | Spliceosome | 123/3704 | 217/8465 | 7.21e-05 | 2.74e-04 | 1.40e-04 | 123 |
| hsa0304026 | Oral cavity | LP | Spliceosome | 106/2418 | 217/8465 | 1.30e-10 | 2.40e-09 | 1.55e-09 | 106 |
| hsa0304036 | Oral cavity | LP | Spliceosome | 106/2418 | 217/8465 | 1.30e-10 | 2.40e-09 | 1.55e-09 | 106 |
| Page: 1 |
Top |
Cell-cell communication analysis |
| Identification of potential cell-cell interactions between two cell types and their ligand-receptor pairs for different disease states |
| Ligand | Receptor | LRpair | Pathway | Tissue | Disease Stage |
| Page: 1 |
Top |
Single-cell gene regulatory network inference analysis |
| Find out the significant the regulons (TFs) and the target genes of each regulon across cell types for different disease states |
| TF | Cell Type | Tissue | Disease Stage | Target Gene | RSS | Regulon Activity |
| ∗The dot plots of a searched regulon are shown for all cell subpopulations in each disease state of each tissue based on the regulon specific score inferred using pySCENIC and by calculating the average expression. |
| Page: 1 |
Top |
Somatic mutation of malignant transformation related genes |
| Annotation of somatic variants for genes involved in malignant transformation |
| Hugo Symbol | Variant Class | Variant Classification | dbSNP RS | HGVSc | HGVSp | HGVSp Short | SWISSPROT | BIOTYPE | SIFT | PolyPhen | Tumor Sample Barcode | Tissue | Histology | Sex | Age | Stage | Therapy Types | Drugs | Outcome |
| ISY1 | SNV | Missense_Mutation | novel | c.670N>C | p.Lys224Gln | p.K224Q | Q9ULR0 | protein_coding | tolerated(0.43) | possibly_damaging(0.677) | TCGA-AN-A046-01 | Breast | breast invasive carcinoma | Female | >=65 | I/II | Unknown | Unknown | SD |
| ISY1 | insertion | Nonsense_Mutation | novel | c.758_759insTGGAGGTTGAAGTGAGCCAAGATCGTGCCATTGCACTC | p.Asp255GlyfsTer2 | p.D255Gfs*2 | Q9ULR0 | protein_coding | TCGA-B6-A0IJ-01 | Breast | breast invasive carcinoma | Female | <65 | I/II | Unknown | Unknown | SD | ||
| ISY1 | SNV | Missense_Mutation | c.676N>A | p.Glu226Lys | p.E226K | Q9ULR0 | protein_coding | tolerated(0.6) | benign(0.083) | TCGA-EK-A3GJ-01 | Cervix | cervical & endocervical cancer | Female | <65 | I/II | Unknown | Unknown | SD | |
| ISY1 | SNV | Missense_Mutation | c.500N>C | p.Arg167Thr | p.R167T | Q9ULR0 | protein_coding | deleterious(0) | probably_damaging(0.986) | TCGA-EK-A3GJ-01 | Cervix | cervical & endocervical cancer | Female | <65 | I/II | Unknown | Unknown | SD | |
| ISY1 | SNV | Missense_Mutation | novel | c.820N>A | p.Glu274Lys | p.E274K | Q9ULR0 | protein_coding | deleterious(0.03) | probably_damaging(0.915) | TCGA-JW-A5VL-01 | Cervix | cervical & endocervical cancer | Female | <65 | I/II | Unknown | Unknown | SD |
| ISY1 | SNV | Missense_Mutation | c.814N>A | p.Glu272Lys | p.E272K | Q9ULR0 | protein_coding | deleterious(0) | probably_damaging(0.948) | TCGA-Q1-A6DT-01 | Cervix | cervical & endocervical cancer | Female | <65 | I/II | Unknown | Unknown | PD | |
| ISY1 | SNV | Missense_Mutation | novel | c.427N>T | p.Arg143Trp | p.R143W | Q9ULR0 | protein_coding | deleterious(0.02) | benign(0.048) | TCGA-ZJ-AB0I-01 | Cervix | cervical & endocervical cancer | Female | <65 | I/II | Unknown | Unknown | SD |
| ISY1 | SNV | Missense_Mutation | novel | c.532N>A | p.Asp178Asn | p.D178N | Q9ULR0 | protein_coding | tolerated(0.1) | possibly_damaging(0.63) | TCGA-AA-3984-01 | Colorectum | colon adenocarcinoma | Female | <65 | I/II | Unknown | Unknown | SD |
| ISY1 | SNV | Missense_Mutation | novel | c.380N>G | p.Lys127Arg | p.K127R | Q9ULR0 | protein_coding | tolerated(0.22) | benign(0.205) | TCGA-CA-6717-01 | Colorectum | colon adenocarcinoma | Male | <65 | I/II | Chemotherapy | oxaliplatin | CR |
| ISY1 | SNV | Missense_Mutation | c.83N>A | p.Arg28Gln | p.R28Q | Q9ULR0 | protein_coding | deleterious(0) | possibly_damaging(0.674) | TCGA-CM-5861-01 | Colorectum | colon adenocarcinoma | Female | <65 | I/II | Unknown | Unknown | PD |
| Page: 1 2 3 |
Top |
Related drugs of malignant transformation related genes |
| Identification of chemicals and drugs interact with genes involved in malignant transfromation |
| (DGIdb 4.0) |
| Entrez ID | Symbol | Category | Interaction Types | Drug Claim Name | Drug Name | PMIDs |
| Page: 1 |

Copyright 2023-Present -The University of Texas Health Science Center at Houston |