
|
|||||
|
 | |
| |
| |
| |
| |
| |
|
Gene: ISOC1 |
Gene summary for ISOC1 |
| Gene information | Species | Human | Gene symbol | ISOC1 | Gene ID | 51015 |
| Gene name | isochorismatase domain containing 1 | |
| Gene Alias | CGI-111 | |
| Cytomap | 5q23.3 | |
| Gene Type | protein-coding | GO ID | GO:0008150 | UniProtAcc | Q96CN7 |
Top |
Malignant transformation analysis |
| Identification of the aberrant gene expression in precancerous and cancerous lesions by comparing the gene expression of stem-like cells in diseased tissues with normal stem cells |
| Entrez ID | Symbol | Replicates | Species | Organ | Tissue | Adj P-value | Log2FC | Malignancy |
| 51015 | ISOC1 | AEH-subject1 | Human | Endometrium | AEH | 5.47e-10 | -3.79e-01 | -0.3059 |
| 51015 | ISOC1 | AEH-subject2 | Human | Endometrium | AEH | 4.16e-09 | -3.26e-01 | -0.2525 |
| 51015 | ISOC1 | AEH-subject3 | Human | Endometrium | AEH | 5.61e-04 | -2.83e-01 | -0.2576 |
| 51015 | ISOC1 | AEH-subject4 | Human | Endometrium | AEH | 5.59e-03 | -1.91e-01 | -0.2657 |
| 51015 | ISOC1 | AEH-subject5 | Human | Endometrium | AEH | 4.55e-14 | -3.95e-01 | -0.2953 |
| 51015 | ISOC1 | EEC-subject1 | Human | Endometrium | EEC | 4.28e-11 | -3.82e-01 | -0.2682 |
| 51015 | ISOC1 | EEC-subject2 | Human | Endometrium | EEC | 8.80e-18 | -4.36e-01 | -0.2607 |
| 51015 | ISOC1 | EEC-subject3 | Human | Endometrium | EEC | 6.43e-32 | -4.75e-01 | -0.2525 |
| 51015 | ISOC1 | EEC-subject4 | Human | Endometrium | EEC | 3.65e-03 | -3.33e-01 | -0.2571 |
| 51015 | ISOC1 | EEC-subject5 | Human | Endometrium | EEC | 4.47e-05 | -3.19e-01 | -0.249 |
| 51015 | ISOC1 | GSM5276934 | Human | Endometrium | EEC | 5.37e-06 | -2.21e-01 | -0.0913 |
| 51015 | ISOC1 | GSM5276935 | Human | Endometrium | EEC | 4.29e-03 | -2.40e-01 | -0.123 |
| 51015 | ISOC1 | GSM6177620_NYU_UCEC1_lib1_lib1 | Human | Endometrium | EEC | 5.75e-22 | -2.99e-01 | -0.1869 |
| 51015 | ISOC1 | GSM6177620_NYU_UCEC1_lib2_lib2 | Human | Endometrium | EEC | 8.32e-23 | -3.00e-01 | -0.1875 |
| 51015 | ISOC1 | GSM6177620_NYU_UCEC1_lib3_lib3 | Human | Endometrium | EEC | 6.81e-28 | -2.97e-01 | -0.1883 |
| 51015 | ISOC1 | GSM6177621_NYU_UCEC2_lib1_lib1 | Human | Endometrium | EEC | 2.01e-20 | -1.35e-01 | -0.1934 |
| 51015 | ISOC1 | GSM6177622_NYU_UCEC3_lib1_lib1 | Human | Endometrium | EEC | 1.77e-33 | -2.89e-01 | -0.1917 |
| 51015 | ISOC1 | GSM6177622_NYU_UCEC3_lib2_lib2 | Human | Endometrium | EEC | 7.47e-33 | -3.10e-01 | -0.1916 |
| 51015 | ISOC1 | GSM6177623_NYU_UCEC3_Vis | Human | Endometrium | EEC | 1.59e-03 | -2.64e-01 | -0.1269 |
| 51015 | ISOC1 | LZE4T | Human | Esophagus | ESCC | 5.08e-03 | 1.78e-01 | 0.0811 |
| Page: 1 2 3 4 5 6 |
| Tissue | Expression Dynamics | Abbreviation |
| Endometrium | 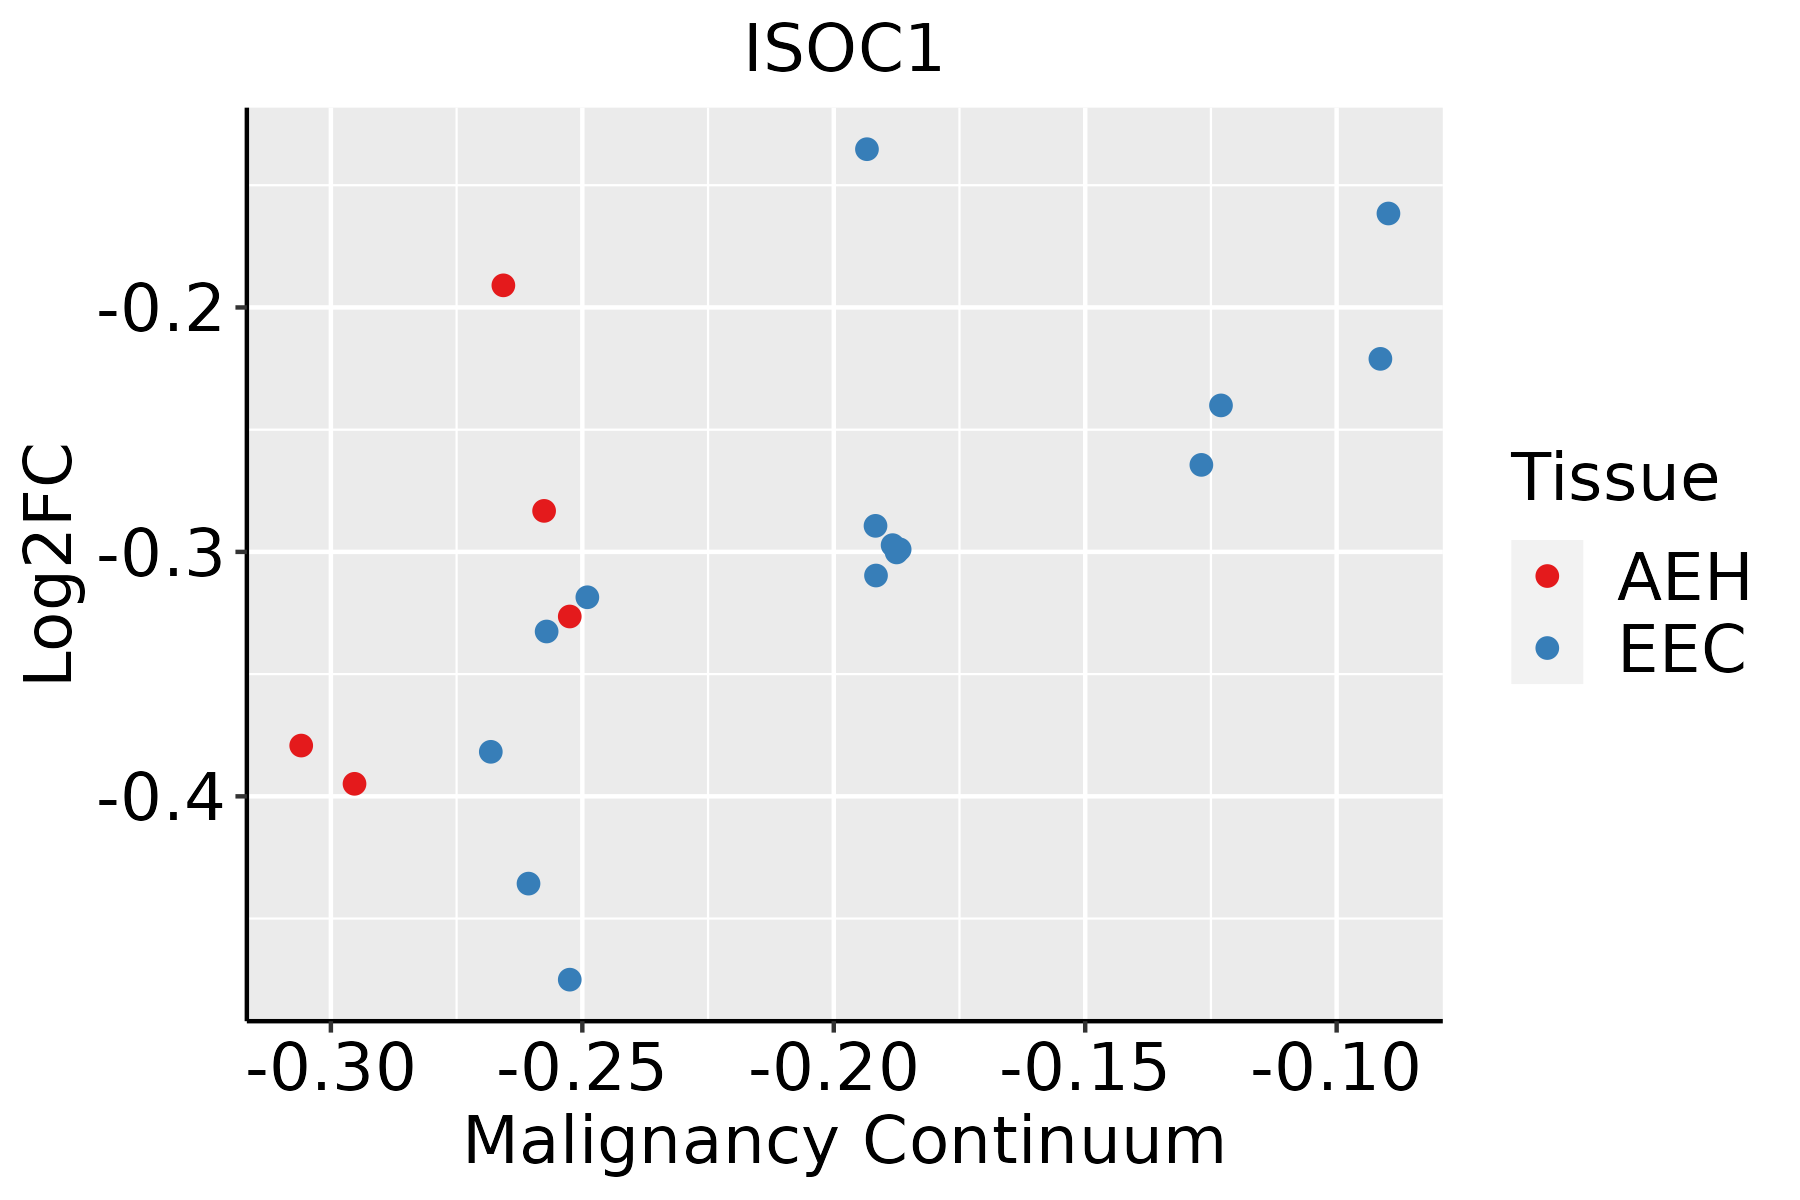 | AEH: Atypical endometrial hyperplasia |
| EEC: Endometrioid Cancer | ||
| Esophagus |  | ESCC: Esophageal squamous cell carcinoma |
| HGIN: High-grade intraepithelial neoplasias | ||
| LGIN: Low-grade intraepithelial neoplasias | ||
| Liver | 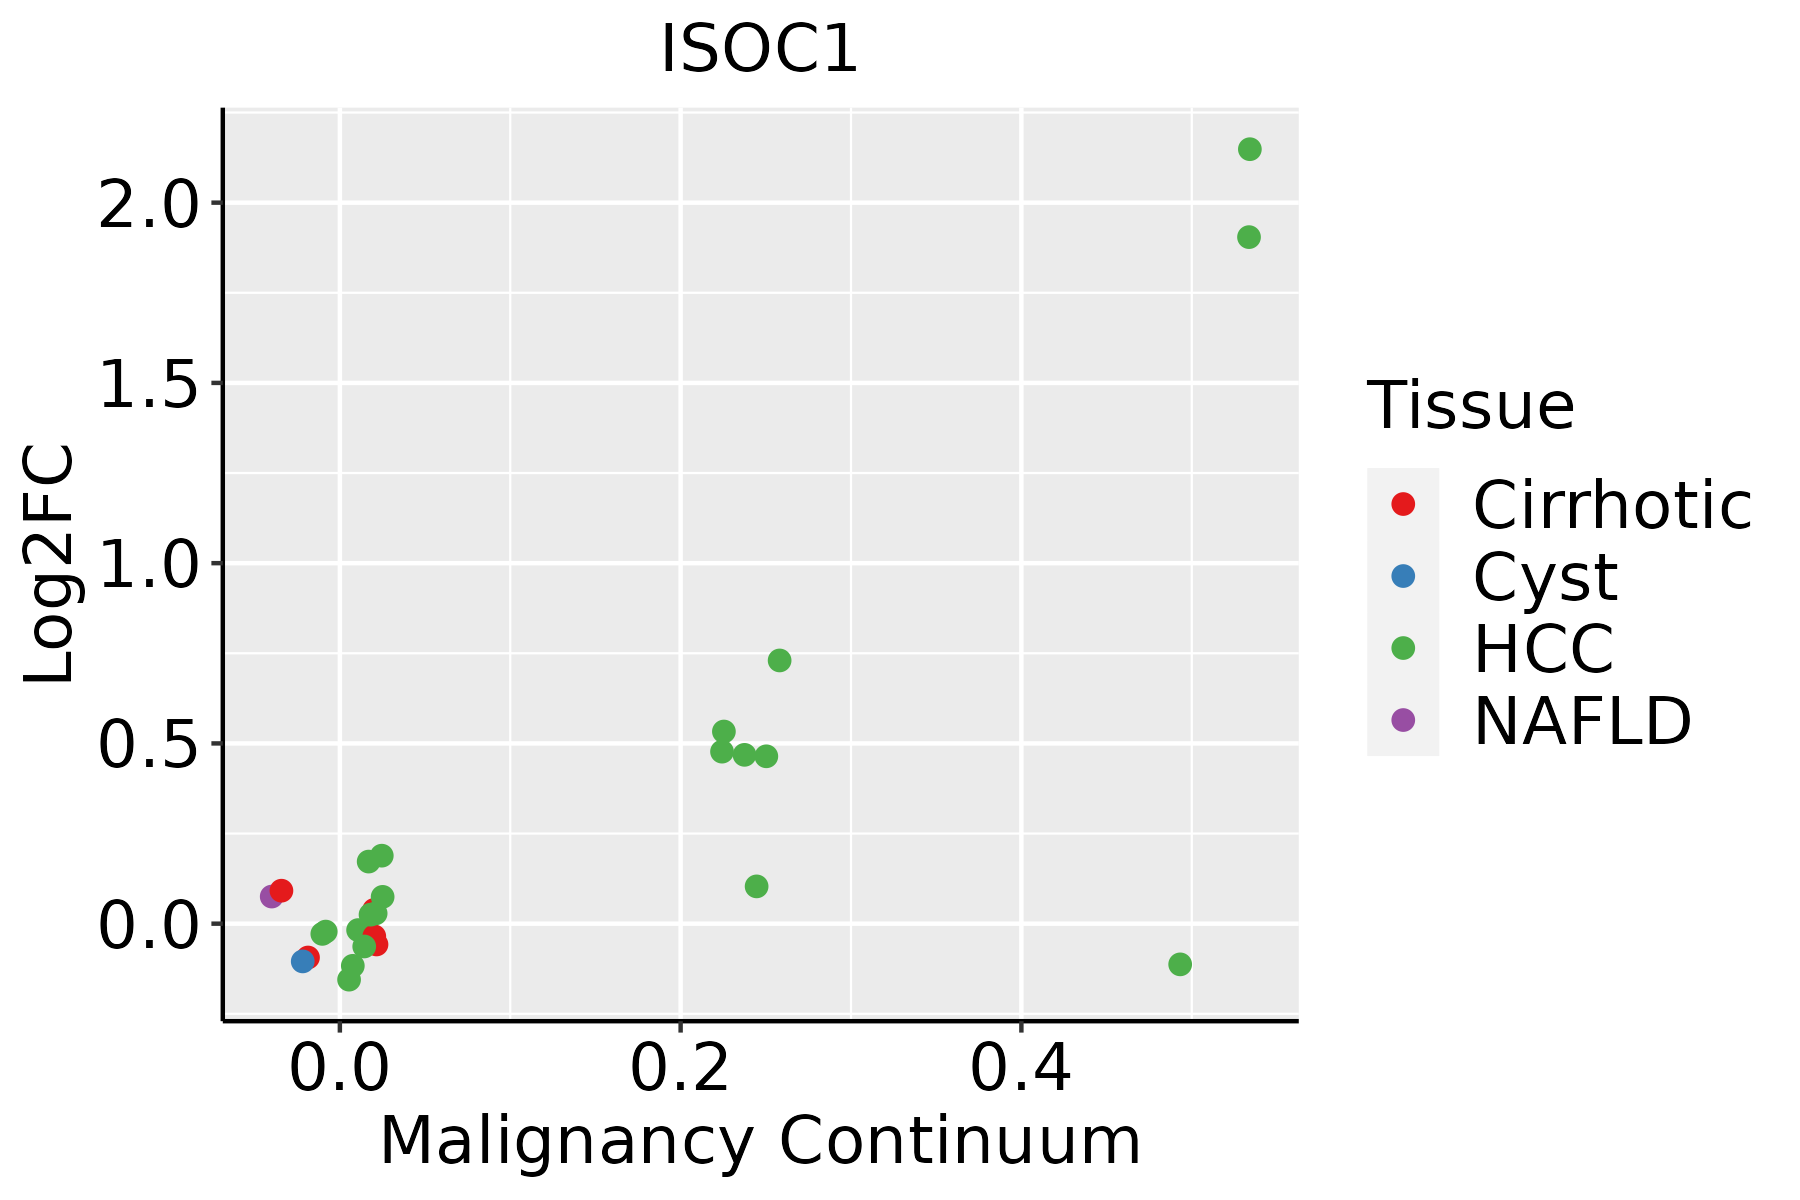 | HCC: Hepatocellular carcinoma |
| NAFLD: Non-alcoholic fatty liver disease | ||
| Oral Cavity |  | EOLP: Erosive Oral lichen planus |
| LP: leukoplakia | ||
| NEOLP: Non-erosive oral lichen planus | ||
| OSCC: Oral squamous cell carcinoma | ||
| Skin | 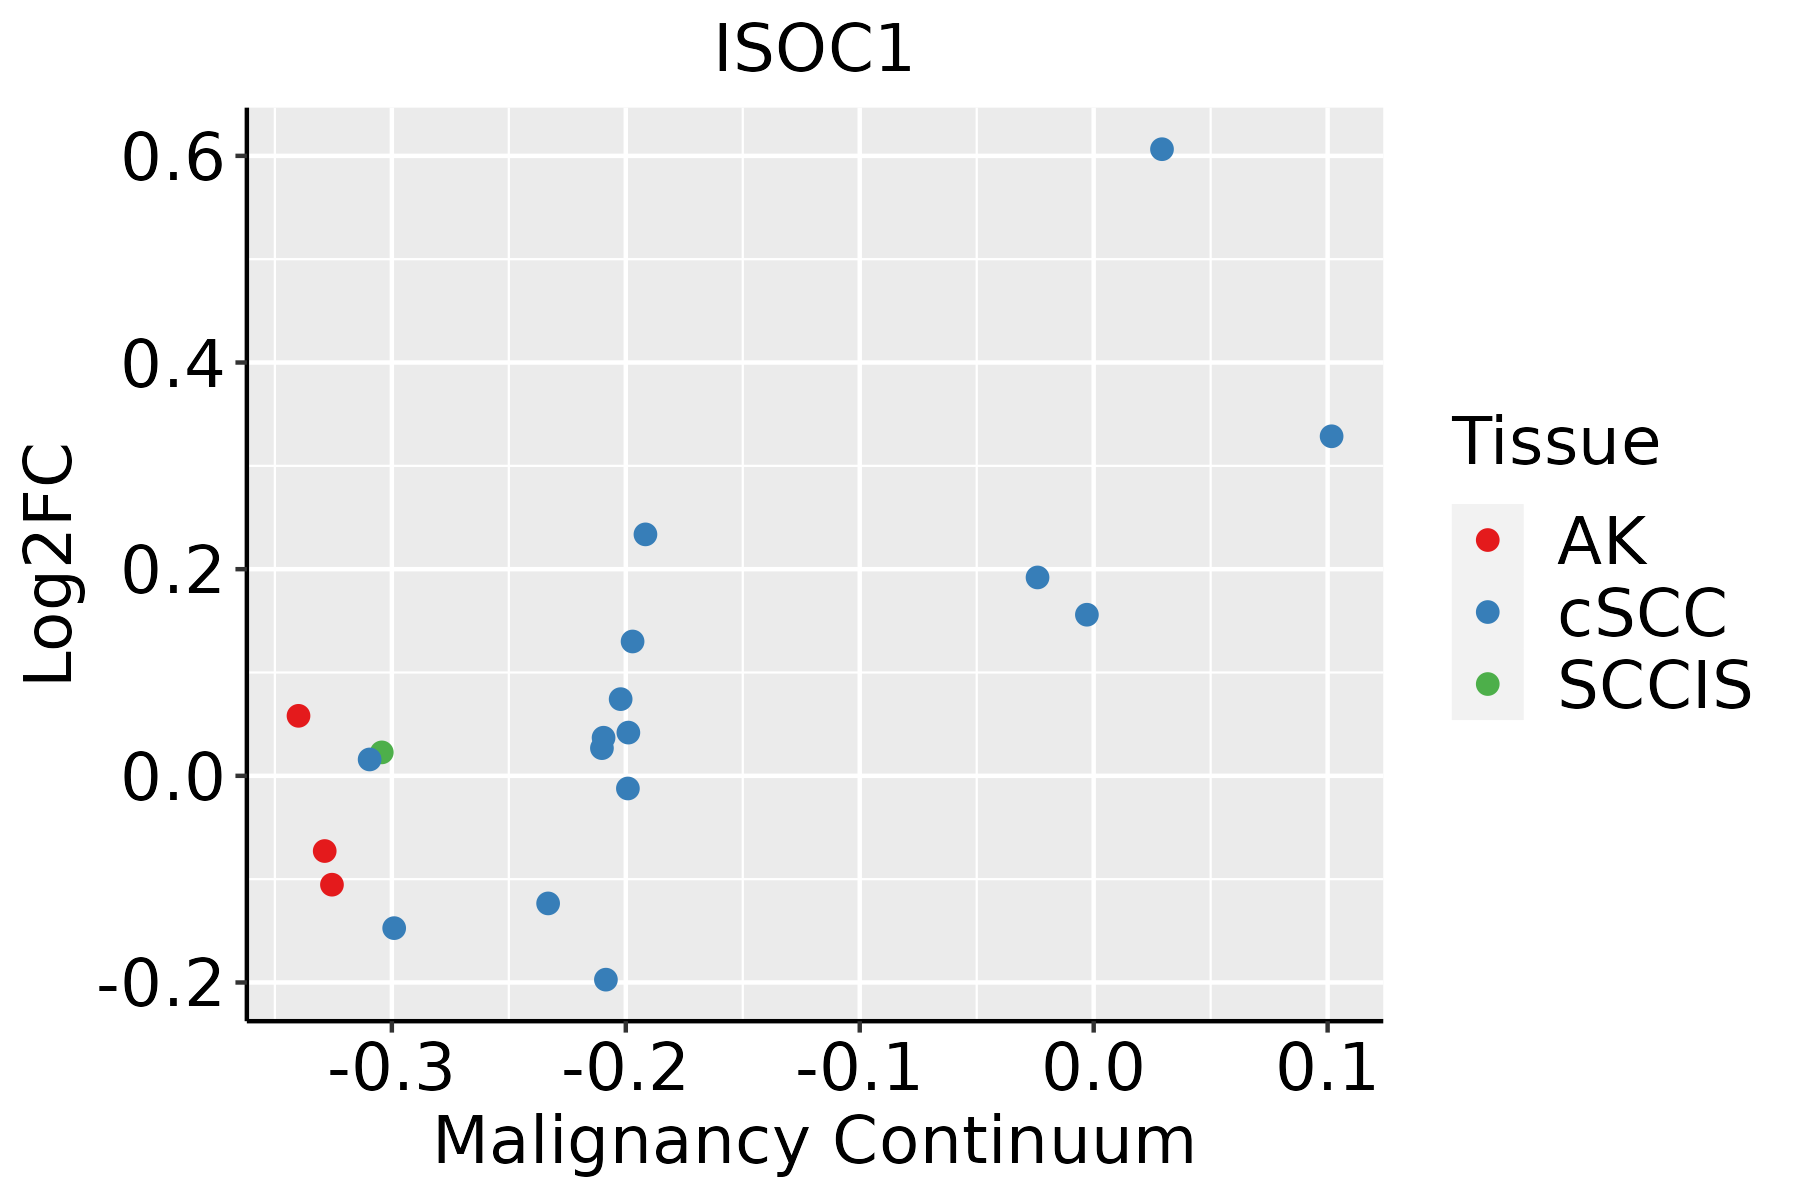 | AK: Actinic keratosis |
| cSCC: Cutaneous squamous cell carcinoma | ||
| SCCIS:squamous cell carcinoma in situ |
| ∗log2FC in expression of this searched gene in stem-like cells from each diseased tissue sample relative to stem-like cells in normal samples in each tissue plotted against the malignancy continuum. Samples are colored based on if they are from different disease stage. |
Top |
Malignant transformation related pathway analysis |
| Find out the enriched GO biological processes and KEGG pathways involved in transition from healthy to precancer to cancer |
| Tissue | Disease Stage | Enriched GO biological Processes |
| Colorectum | AD |  |
| Colorectum | SER |  |
| Colorectum | MSS |  |
| Colorectum | MSI-H |  |
| Colorectum | FAP |  |
| ∗Top 15 enriched GO BP terms are showed in the bar plot of each disease state in each tissue. Each row represents a significant GO biological process which is colored according to the -log10(p.adjust). |
| Page: 1 2 3 4 5 6 7 8 9 |
| GO ID | Tissue | Disease Stage | Description | Gene Ratio | Bg Ratio | pvalue | p.adjust | Count |
| Page: 1 |
| Pathway ID | Tissue | Disease Stage | Description | Gene Ratio | Bg Ratio | pvalue | p.adjust | qvalue | Count |
| Page: 1 |
Top |
Cell-cell communication analysis |
| Identification of potential cell-cell interactions between two cell types and their ligand-receptor pairs for different disease states |
| Ligand | Receptor | LRpair | Pathway | Tissue | Disease Stage |
| Page: 1 |
Top |
Single-cell gene regulatory network inference analysis |
| Find out the significant the regulons (TFs) and the target genes of each regulon across cell types for different disease states |
| TF | Cell Type | Tissue | Disease Stage | Target Gene | RSS | Regulon Activity |
| ∗The dot plots of a searched regulon are shown for all cell subpopulations in each disease state of each tissue based on the regulon specific score inferred using pySCENIC and by calculating the average expression. |
| Page: 1 |
Top |
Somatic mutation of malignant transformation related genes |
| Annotation of somatic variants for genes involved in malignant transformation |
| Hugo Symbol | Variant Class | Variant Classification | dbSNP RS | HGVSc | HGVSp | HGVSp Short | SWISSPROT | BIOTYPE | SIFT | PolyPhen | Tumor Sample Barcode | Tissue | Histology | Sex | Age | Stage | Therapy Types | Drugs | Outcome |
| ISOC1 | SNV | Missense_Mutation | c.886T>C | p.Ser296Pro | p.S296P | Q96CN7 | protein_coding | tolerated(0.06) | benign(0.003) | TCGA-AD-6895-01 | Colorectum | colon adenocarcinoma | Male | >=65 | III/IV | Unknown | Unknown | SD | |
| ISOC1 | SNV | Missense_Mutation | novel | c.581N>T | p.Ala194Val | p.A194V | Q96CN7 | protein_coding | deleterious(0.04) | benign(0.22) | TCGA-A5-A0G1-01 | Endometrium | uterine corpus endometrioid carcinoma | Female | >=65 | I/II | Unknown | Unknown | SD |
| ISOC1 | SNV | Missense_Mutation | novel | c.767N>T | p.Gly256Val | p.G256V | Q96CN7 | protein_coding | deleterious(0) | probably_damaging(0.999) | TCGA-A5-A0G2-01 | Endometrium | uterine corpus endometrioid carcinoma | Female | <65 | III/IV | Unknown | Unknown | SD |
| ISOC1 | SNV | Missense_Mutation | c.257N>A | p.Gly86Asp | p.G86D | Q96CN7 | protein_coding | tolerated(0.14) | probably_damaging(0.992) | TCGA-A5-A0VP-01 | Endometrium | uterine corpus endometrioid carcinoma | Female | >=65 | I/II | Unknown | Unknown | SD | |
| ISOC1 | SNV | Missense_Mutation | rs778499451 | c.757N>A | p.Ala253Thr | p.A253T | Q96CN7 | protein_coding | tolerated(0.1) | possibly_damaging(0.72) | TCGA-AP-A051-01 | Endometrium | uterine corpus endometrioid carcinoma | Female | >=65 | I/II | Unknown | Unknown | SD |
| ISOC1 | SNV | Missense_Mutation | rs370245668 | c.761N>A | p.Arg254Gln | p.R254Q | Q96CN7 | protein_coding | tolerated(1) | benign(0.024) | TCGA-AX-A0J0-01 | Endometrium | uterine corpus endometrioid carcinoma | Female | <65 | I/II | Unknown | Unknown | SD |
| ISOC1 | SNV | Missense_Mutation | c.476N>C | p.Gln159Pro | p.Q159P | Q96CN7 | protein_coding | deleterious(0) | probably_damaging(0.998) | TCGA-B5-A11E-01 | Endometrium | uterine corpus endometrioid carcinoma | Female | <65 | I/II | Unknown | Unknown | SD | |
| ISOC1 | SNV | Missense_Mutation | novel | c.484N>C | p.Lys162Gln | p.K162Q | Q96CN7 | protein_coding | tolerated(0.15) | benign(0.143) | TCGA-B5-A1MR-01 | Endometrium | uterine corpus endometrioid carcinoma | Female | >=65 | III/IV | Unknown | Unknown | SD |
| ISOC1 | SNV | Missense_Mutation | c.392A>G | p.Lys131Arg | p.K131R | Q96CN7 | protein_coding | tolerated(0.31) | benign(0.05) | TCGA-D1-A103-01 | Endometrium | uterine corpus endometrioid carcinoma | Female | >=65 | I/II | Unknown | Unknown | SD | |
| ISOC1 | SNV | Missense_Mutation | rs760387704 | c.194A>G | p.His65Arg | p.H65R | Q96CN7 | protein_coding | tolerated_low_confidence(0.12) | possibly_damaging(0.84) | TCGA-D1-A175-01 | Endometrium | uterine corpus endometrioid carcinoma | Female | <65 | I/II | Chemotherapy | paclitaxel | SD |
| Page: 1 2 3 |
Top |
Related drugs of malignant transformation related genes |
| Identification of chemicals and drugs interact with genes involved in malignant transfromation |
| (DGIdb 4.0) |
| Entrez ID | Symbol | Category | Interaction Types | Drug Claim Name | Drug Name | PMIDs |
| Page: 1 |

Copyright 2023-Present -The University of Texas Health Science Center at Houston |