
|
|||||
|
 | |
| |
| |
| |
| |
| |
|
Gene: ISG20L2 |
Gene summary for ISG20L2 |
| Gene information | Species | Human | Gene symbol | ISG20L2 | Gene ID | 81875 |
| Gene name | interferon stimulated exonuclease gene 20 like 2 | |
| Gene Alias | HSD38 | |
| Cytomap | 1q23.1 | |
| Gene Type | protein-coding | GO ID | GO:0006139 | UniProtAcc | Q9H9L3 |
Top |
Malignant transformation analysis |
| Identification of the aberrant gene expression in precancerous and cancerous lesions by comparing the gene expression of stem-like cells in diseased tissues with normal stem cells |
| Entrez ID | Symbol | Replicates | Species | Organ | Tissue | Adj P-value | Log2FC | Malignancy |
| 81875 | ISG20L2 | LZE4T | Human | Esophagus | ESCC | 9.80e-08 | 4.38e-01 | 0.0811 |
| 81875 | ISG20L2 | LZE7T | Human | Esophagus | ESCC | 5.85e-06 | 5.84e-01 | 0.0667 |
| 81875 | ISG20L2 | LZE8T | Human | Esophagus | ESCC | 7.96e-06 | 1.91e-01 | 0.067 |
| 81875 | ISG20L2 | LZE22T | Human | Esophagus | ESCC | 7.98e-03 | 4.60e-01 | 0.068 |
| 81875 | ISG20L2 | LZE24T | Human | Esophagus | ESCC | 7.50e-18 | 5.55e-01 | 0.0596 |
| 81875 | ISG20L2 | LZE21T | Human | Esophagus | ESCC | 1.36e-03 | 2.95e-01 | 0.0655 |
| 81875 | ISG20L2 | LZE6T | Human | Esophagus | ESCC | 1.44e-03 | 3.52e-01 | 0.0845 |
| 81875 | ISG20L2 | P1T-E | Human | Esophagus | ESCC | 2.16e-03 | 4.28e-01 | 0.0875 |
| 81875 | ISG20L2 | P2T-E | Human | Esophagus | ESCC | 9.91e-37 | 6.41e-01 | 0.1177 |
| 81875 | ISG20L2 | P4T-E | Human | Esophagus | ESCC | 1.32e-12 | 4.49e-01 | 0.1323 |
| 81875 | ISG20L2 | P5T-E | Human | Esophagus | ESCC | 1.63e-16 | 4.10e-01 | 0.1327 |
| 81875 | ISG20L2 | P8T-E | Human | Esophagus | ESCC | 7.02e-16 | 3.38e-01 | 0.0889 |
| 81875 | ISG20L2 | P9T-E | Human | Esophagus | ESCC | 7.18e-13 | 4.27e-01 | 0.1131 |
| 81875 | ISG20L2 | P10T-E | Human | Esophagus | ESCC | 1.89e-26 | 4.28e-01 | 0.116 |
| 81875 | ISG20L2 | P11T-E | Human | Esophagus | ESCC | 6.91e-10 | 6.13e-01 | 0.1426 |
| 81875 | ISG20L2 | P12T-E | Human | Esophagus | ESCC | 1.62e-13 | 2.63e-01 | 0.1122 |
| 81875 | ISG20L2 | P15T-E | Human | Esophagus | ESCC | 1.41e-20 | 6.69e-01 | 0.1149 |
| 81875 | ISG20L2 | P16T-E | Human | Esophagus | ESCC | 1.12e-25 | 3.06e-01 | 0.1153 |
| 81875 | ISG20L2 | P17T-E | Human | Esophagus | ESCC | 1.41e-15 | 3.83e-01 | 0.1278 |
| 81875 | ISG20L2 | P20T-E | Human | Esophagus | ESCC | 5.69e-18 | 5.59e-01 | 0.1124 |
| Page: 1 2 3 4 5 |
| Tissue | Expression Dynamics | Abbreviation |
| Esophagus | 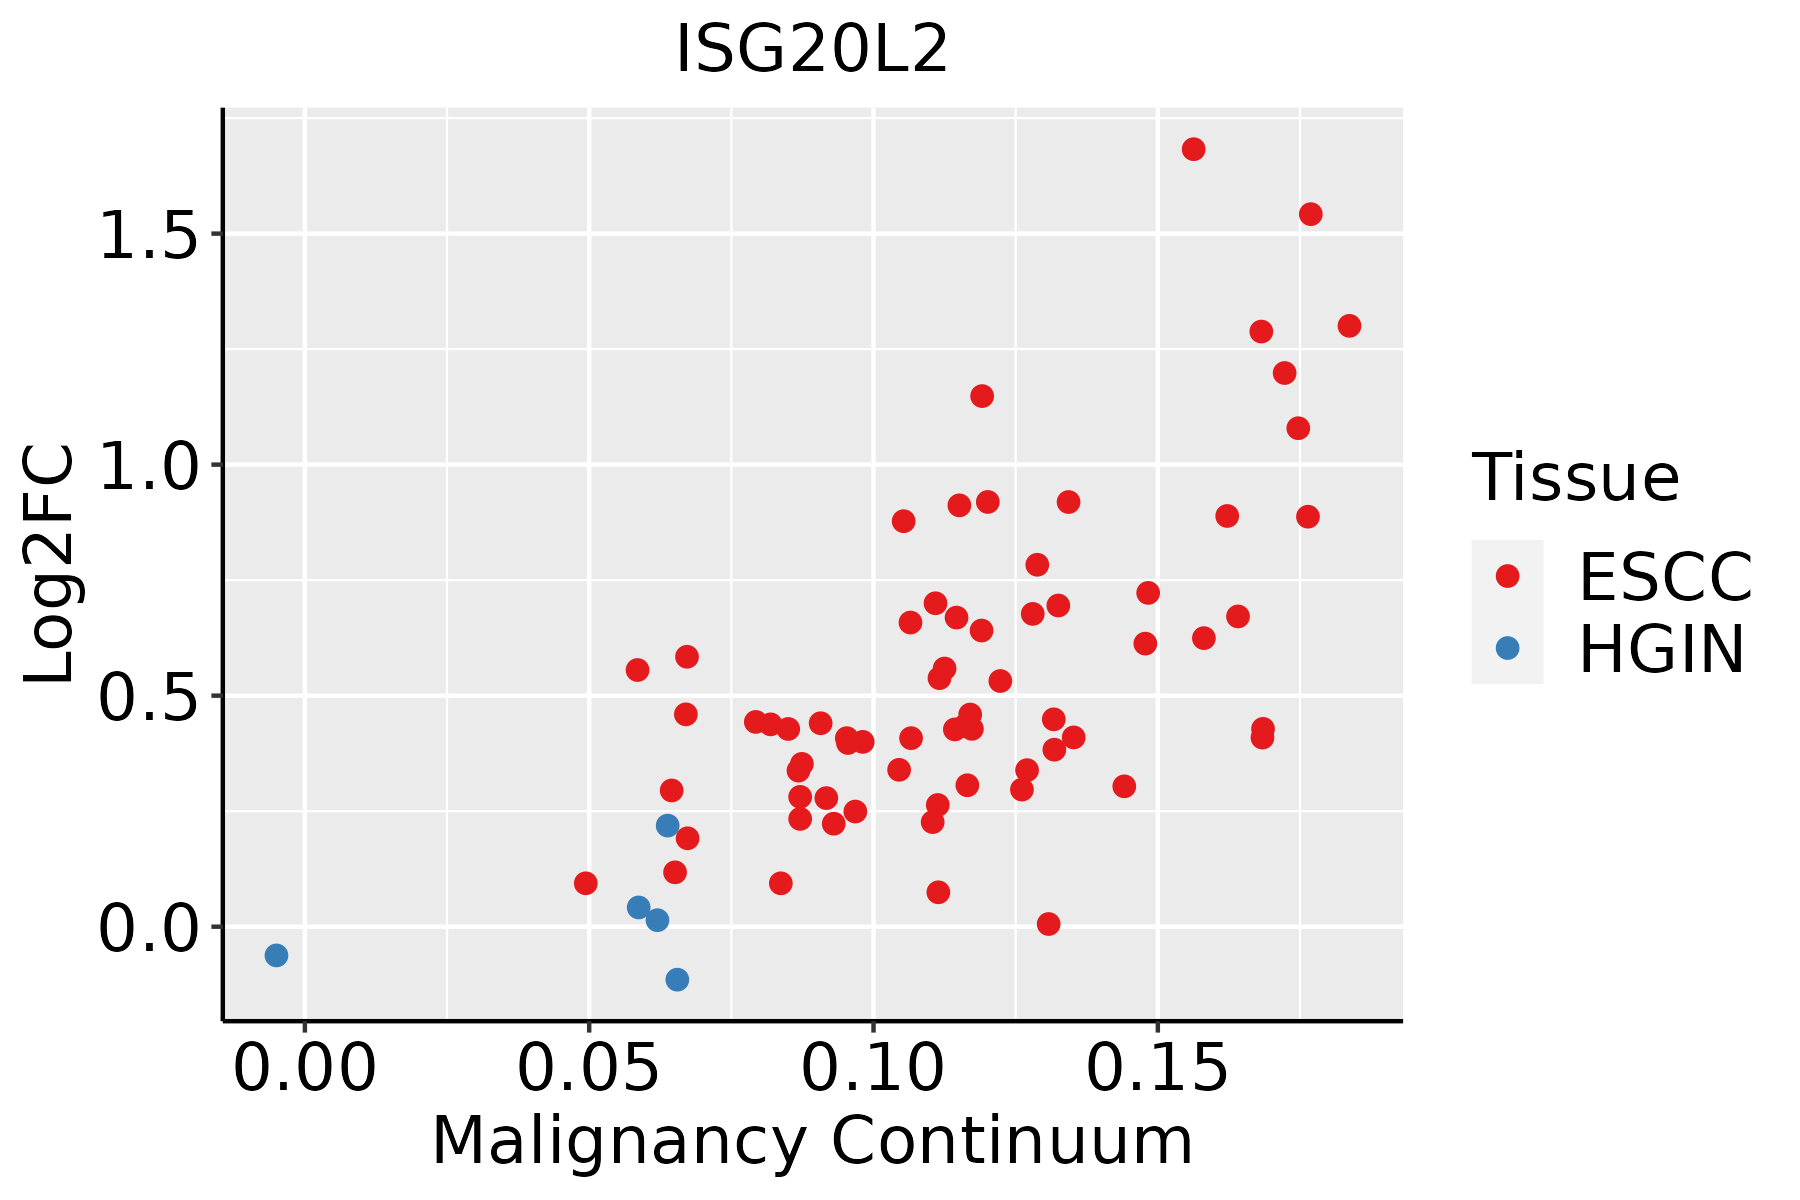 | ESCC: Esophageal squamous cell carcinoma |
| HGIN: High-grade intraepithelial neoplasias | ||
| LGIN: Low-grade intraepithelial neoplasias | ||
| Liver |  | HCC: Hepatocellular carcinoma |
| NAFLD: Non-alcoholic fatty liver disease | ||
| Oral Cavity |  | EOLP: Erosive Oral lichen planus |
| LP: leukoplakia | ||
| NEOLP: Non-erosive oral lichen planus | ||
| OSCC: Oral squamous cell carcinoma | ||
| Skin | 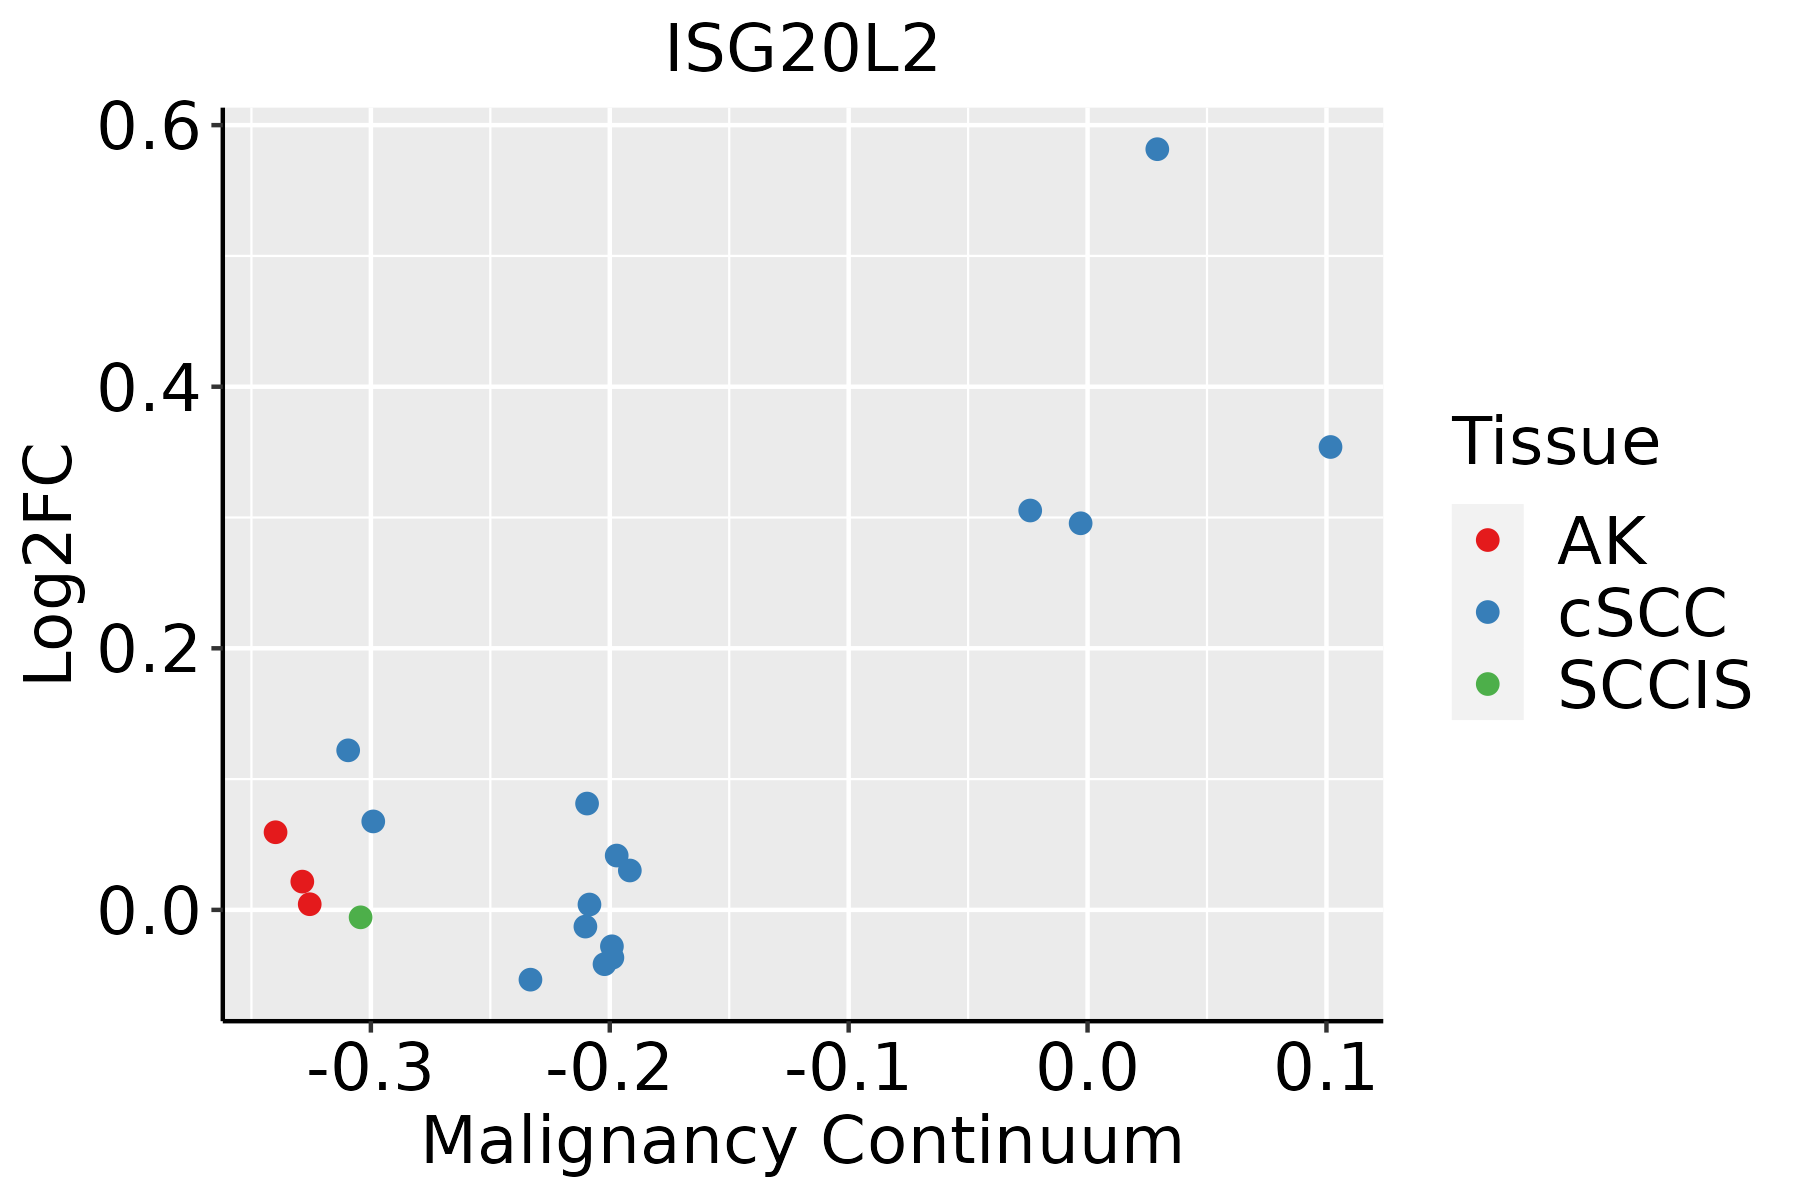 | AK: Actinic keratosis |
| cSCC: Cutaneous squamous cell carcinoma | ||
| SCCIS:squamous cell carcinoma in situ |
| ∗log2FC in expression of this searched gene in stem-like cells from each diseased tissue sample relative to stem-like cells in normal samples in each tissue plotted against the malignancy continuum. Samples are colored based on if they are from different disease stage. |
Top |
Malignant transformation related pathway analysis |
| Find out the enriched GO biological processes and KEGG pathways involved in transition from healthy to precancer to cancer |
| Tissue | Disease Stage | Enriched GO biological Processes |
| Colorectum | AD |  |
| Colorectum | SER |  |
| Colorectum | MSS |  |
| Colorectum | MSI-H |  |
| Colorectum | FAP |  |
| ∗Top 15 enriched GO BP terms are showed in the bar plot of each disease state in each tissue. Each row represents a significant GO biological process which is colored according to the -log10(p.adjust). |
| Page: 1 2 3 4 5 6 7 8 9 |
| GO ID | Tissue | Disease Stage | Description | Gene Ratio | Bg Ratio | pvalue | p.adjust | Count |
| GO:0022613111 | Esophagus | ESCC | ribonucleoprotein complex biogenesis | 365/8552 | 463/18723 | 1.74e-49 | 1.11e-45 | 365 |
| GO:0042254111 | Esophagus | ESCC | ribosome biogenesis | 252/8552 | 299/18723 | 3.27e-44 | 1.04e-40 | 252 |
| GO:00905013 | Esophagus | ESCC | RNA phosphodiester bond hydrolysis | 110/8552 | 152/18723 | 1.95e-11 | 6.81e-10 | 110 |
| GO:00903053 | Esophagus | ESCC | nucleic acid phosphodiester bond hydrolysis | 163/8552 | 261/18723 | 3.07e-08 | 5.73e-07 | 163 |
| GO:00905033 | Esophagus | ESCC | RNA phosphodiester bond hydrolysis, exonucleolytic | 35/8552 | 42/18723 | 5.35e-07 | 7.11e-06 | 35 |
| GO:002261312 | Liver | Cirrhotic | ribonucleoprotein complex biogenesis | 231/4634 | 463/18723 | 3.28e-32 | 6.86e-29 | 231 |
| GO:004225412 | Liver | Cirrhotic | ribosome biogenesis | 154/4634 | 299/18723 | 1.18e-23 | 6.72e-21 | 154 |
| GO:0090501 | Liver | Cirrhotic | RNA phosphodiester bond hydrolysis | 54/4634 | 152/18723 | 1.89e-03 | 1.19e-02 | 54 |
| GO:0090503 | Liver | Cirrhotic | RNA phosphodiester bond hydrolysis, exonucleolytic | 19/4634 | 42/18723 | 3.00e-03 | 1.71e-02 | 19 |
| GO:002261322 | Liver | HCC | ribonucleoprotein complex biogenesis | 355/7958 | 463/18723 | 7.76e-52 | 4.92e-48 | 355 |
| GO:004225422 | Liver | HCC | ribosome biogenesis | 246/7958 | 299/18723 | 4.99e-46 | 1.58e-42 | 246 |
| GO:00905011 | Liver | HCC | RNA phosphodiester bond hydrolysis | 101/7958 | 152/18723 | 1.99e-09 | 5.63e-08 | 101 |
| GO:0090305 | Liver | HCC | nucleic acid phosphodiester bond hydrolysis | 152/7958 | 261/18723 | 1.90e-07 | 3.46e-06 | 152 |
| GO:00905031 | Liver | HCC | RNA phosphodiester bond hydrolysis, exonucleolytic | 29/7958 | 42/18723 | 4.57e-04 | 3.04e-03 | 29 |
| GO:002261320 | Oral cavity | OSCC | ribonucleoprotein complex biogenesis | 333/7305 | 463/18723 | 8.28e-48 | 5.24e-44 | 333 |
| GO:004225420 | Oral cavity | OSCC | ribosome biogenesis | 230/7305 | 299/18723 | 3.22e-41 | 6.80e-38 | 230 |
| GO:00905012 | Oral cavity | OSCC | RNA phosphodiester bond hydrolysis | 95/7305 | 152/18723 | 3.65e-09 | 8.22e-08 | 95 |
| GO:00903052 | Oral cavity | OSCC | nucleic acid phosphodiester bond hydrolysis | 142/7305 | 261/18723 | 2.90e-07 | 4.43e-06 | 142 |
| GO:00905032 | Oral cavity | OSCC | RNA phosphodiester bond hydrolysis, exonucleolytic | 29/7305 | 42/18723 | 7.73e-05 | 6.00e-04 | 29 |
| GO:002261329 | Skin | cSCC | ribonucleoprotein complex biogenesis | 302/4864 | 463/18723 | 5.13e-72 | 3.22e-68 | 302 |
| Page: 1 2 |
| Pathway ID | Tissue | Disease Stage | Description | Gene Ratio | Bg Ratio | pvalue | p.adjust | qvalue | Count |
| Page: 1 |
Top |
Cell-cell communication analysis |
| Identification of potential cell-cell interactions between two cell types and their ligand-receptor pairs for different disease states |
| Ligand | Receptor | LRpair | Pathway | Tissue | Disease Stage |
| Page: 1 |
Top |
Single-cell gene regulatory network inference analysis |
| Find out the significant the regulons (TFs) and the target genes of each regulon across cell types for different disease states |
| TF | Cell Type | Tissue | Disease Stage | Target Gene | RSS | Regulon Activity |
| ∗The dot plots of a searched regulon are shown for all cell subpopulations in each disease state of each tissue based on the regulon specific score inferred using pySCENIC and by calculating the average expression. |
| Page: 1 |
Top |
Somatic mutation of malignant transformation related genes |
| Annotation of somatic variants for genes involved in malignant transformation |
| Hugo Symbol | Variant Class | Variant Classification | dbSNP RS | HGVSc | HGVSp | HGVSp Short | SWISSPROT | BIOTYPE | SIFT | PolyPhen | Tumor Sample Barcode | Tissue | Histology | Sex | Age | Stage | Therapy Types | Drugs | Outcome |
| ISG20L2 | SNV | Missense_Mutation | c.414N>T | p.Lys138Asn | p.K138N | Q9H9L3 | protein_coding | tolerated(0.26) | possibly_damaging(0.886) | TCGA-AN-A041-01 | Breast | breast invasive carcinoma | Female | <65 | I/II | Unknown | Unknown | SD | |
| ISG20L2 | SNV | Missense_Mutation | novel | c.218N>T | p.Thr73Ile | p.T73I | Q9H9L3 | protein_coding | tolerated(0.2) | benign(0) | TCGA-AO-A128-01 | Breast | breast invasive carcinoma | Female | <65 | I/II | Chemotherapy | doxorubicin | SD |
| ISG20L2 | SNV | Missense_Mutation | c.426N>C | p.Gln142His | p.Q142H | Q9H9L3 | protein_coding | tolerated(0.12) | benign(0.205) | TCGA-D8-A1JA-01 | Breast | breast invasive carcinoma | Female | <65 | III/IV | Chemotherapy | adriamycin | PD | |
| ISG20L2 | insertion | Frame_Shift_Ins | novel | c.901_902insGTCTGTATCTAGCCTGTGTCAGGATATTGCCTGTTCTTCC | p.Met301SerfsTer49 | p.M301Sfs*49 | Q9H9L3 | protein_coding | TCGA-A2-A0CP-01 | Breast | breast invasive carcinoma | Female | <65 | I/II | Chemotherapy | cytoxan | SD | ||
| ISG20L2 | SNV | Missense_Mutation | c.1016N>G | p.Glu339Gly | p.E339G | Q9H9L3 | protein_coding | deleterious(0) | probably_damaging(0.99) | TCGA-AA-3713-01 | Colorectum | colon adenocarcinoma | Male | >=65 | III/IV | Chemotherapy | 5-fluorouracil | PR | |
| ISG20L2 | SNV | Missense_Mutation | c.521N>G | p.Lys174Arg | p.K174R | Q9H9L3 | protein_coding | tolerated(0.47) | benign(0.015) | TCGA-AA-3811-01 | Colorectum | colon adenocarcinoma | Female | >=65 | III/IV | Unknown | Unknown | PD | |
| ISG20L2 | SNV | Missense_Mutation | c.682A>G | p.Arg228Gly | p.R228G | Q9H9L3 | protein_coding | deleterious(0) | probably_damaging(0.973) | TCGA-CM-4747-01 | Colorectum | colon adenocarcinoma | Male | <65 | I/II | Chemotherapy | fluorouracil | SD | |
| ISG20L2 | SNV | Missense_Mutation | c.655N>G | p.Pro219Ala | p.P219A | Q9H9L3 | protein_coding | tolerated(0.32) | possibly_damaging(0.61) | TCGA-CM-5341-01 | Colorectum | colon adenocarcinoma | Female | >=65 | III/IV | Chemotherapy | fluorouracil | SD | |
| ISG20L2 | SNV | Missense_Mutation | rs759960220 | c.197N>T | p.Thr66Met | p.T66M | Q9H9L3 | protein_coding | tolerated(0.05) | benign(0.083) | TCGA-A5-A0VP-01 | Endometrium | uterine corpus endometrioid carcinoma | Female | >=65 | I/II | Unknown | Unknown | SD |
| ISG20L2 | SNV | Missense_Mutation | novel | c.483A>C | p.Gln161His | p.Q161H | Q9H9L3 | protein_coding | tolerated(0.21) | benign(0) | TCGA-AP-A051-01 | Endometrium | uterine corpus endometrioid carcinoma | Female | >=65 | I/II | Unknown | Unknown | SD |
| Page: 1 2 3 4 5 |
Top |
Related drugs of malignant transformation related genes |
| Identification of chemicals and drugs interact with genes involved in malignant transfromation |
| (DGIdb 4.0) |
| Entrez ID | Symbol | Category | Interaction Types | Drug Claim Name | Drug Name | PMIDs |
| Page: 1 |

Copyright 2023-Present -The University of Texas Health Science Center at Houston |