Schematic overview of the cellular and molecular mechanisms involved in the cancer progression, including the proposed cellular and molecular mechanisms in cancer cells trajectory. AT1: alveolar type 1 cells; AT2: alveolar type 2 cells; AAH: atypical adenomatous hyperplasia; AIS: adenocarcinoma in situ; MIA: minimally invasive adenocarcinoma; IA: invasive adenocarcinoma; EMT: epithelial-mesenchymal transition

Home

Download

Statistics

Help

Contact

Center for Computational Systems Medicine
leaf

Gene summary

leaf

Malignant transformation analysis

leaf

Malignant transformation related pathway analysis

leaf

Cell-cell communication analysis

leaf

Single-cell gene regulatory network inference analysis

leaf

Somatic mutation of malignant transformation related genes

leaf

Related drugs of malignant transformation related genes

Gene: ISCU

Gene summary for ISCU

check button Gene summary.

Gene informationSpeciesHuman
Gene symbol

ISCU

Gene ID

23479

Gene nameiron-sulfur cluster assembly enzyme
Gene Alias2310020H20Rik
Cytomap12q23.3
Gene Typeprotein-coding
GO ID

GO:0000041

UniProtAcc

B3KQ30


Top

Malignant transformation analysis

check button Identification of the aberrant gene expression in precancerous and cancerous lesions by comparing the gene expression of stem-like cells in diseased tissues with normal stem cells
check button Malignant transformation involving gene list.
Entrez IDSymbolReplicatesSpeciesOrganTissueAdj P-valueLog2FCMalignancy
23479ISCUHTA11_3410_2000001011HumanColorectumAD2.65e-093.05e-010.0155
23479ISCUHTA11_2487_2000001011HumanColorectumSER2.48e-043.85e-01-0.1808
23479ISCUHTA11_1938_2000001011HumanColorectumAD9.41e-116.12e-01-0.0811
23479ISCUHTA11_78_2000001011HumanColorectumAD7.92e-063.54e-01-0.1088
23479ISCUHTA11_347_2000001011HumanColorectumAD2.83e-235.99e-01-0.1954
23479ISCUHTA11_411_2000001011HumanColorectumSER2.37e-079.83e-01-0.2602
23479ISCUHTA11_83_2000001011HumanColorectumSER4.03e-053.91e-01-0.1526
23479ISCUHTA11_696_2000001011HumanColorectumAD1.52e-113.91e-01-0.1464
23479ISCUHTA11_866_2000001011HumanColorectumAD1.15e-063.03e-01-0.1001
23479ISCUHTA11_1391_2000001011HumanColorectumAD1.86e-177.25e-01-0.059
23479ISCUHTA11_2992_2000001011HumanColorectumSER1.40e-025.03e-01-0.1706
23479ISCUHTA11_5212_2000001011HumanColorectumAD1.55e-064.87e-01-0.2061
23479ISCUHTA11_7862_2000001011HumanColorectumAD3.23e-064.35e-01-0.0179
23479ISCUHTA11_866_3004761011HumanColorectumAD2.13e-154.87e-010.096
23479ISCUHTA11_4255_2000001011HumanColorectumSER3.93e-054.52e-010.0446
23479ISCUHTA11_8622_2000001021HumanColorectumSER4.07e-085.78e-010.0528
23479ISCUHTA11_7663_2000001011HumanColorectumSER1.61e-056.42e-010.0131
23479ISCUHTA11_10623_2000001011HumanColorectumAD2.47e-022.90e-01-0.0177
23479ISCUHTA11_6801_2000001011HumanColorectumSER5.92e-066.52e-010.0171
23479ISCUHTA11_10711_2000001011HumanColorectumAD2.16e-022.91e-010.0338
Page: 1 2 3 4 5 6 7 8 9 

check button Transcriptomic changes along malignancy continuum.
TissueExpression DynamicsAbbreviation
Colorectum (GSE201348)The image shows the transcriptomic changes along malignancy continuum.log2FC in expression of this searched gene in stem-like cells from each diseased tissue sample relative to stem-like cells in normal samples in each tissue plotted against the malignancy continuum. Samples are colored based on if they are from different disease stage.FAP: Familial adenomatous polyposis
CRC: Colorectal cancer
Colorectum (HTA11)The image shows the transcriptomic changes along malignancy continuum.log2FC in expression of this searched gene in stem-like cells from each diseased tissue sample relative to stem-like cells in normal samples in each tissue plotted against the malignancy continuum. Samples are colored based on if they are from different disease stage.AD: Adenomas
SER: Sessile serrated lesions
MSI-H: Microsatellite-high colorectal cancer
MSS: Microsatellite stable colorectal cancer
EndometriumThe image shows the transcriptomic changes along malignancy continuum.log2FC in expression of this searched gene in stem-like cells from each diseased tissue sample relative to stem-like cells in normal samples in each tissue plotted against the malignancy continuum. Samples are colored based on if they are from different disease stage.
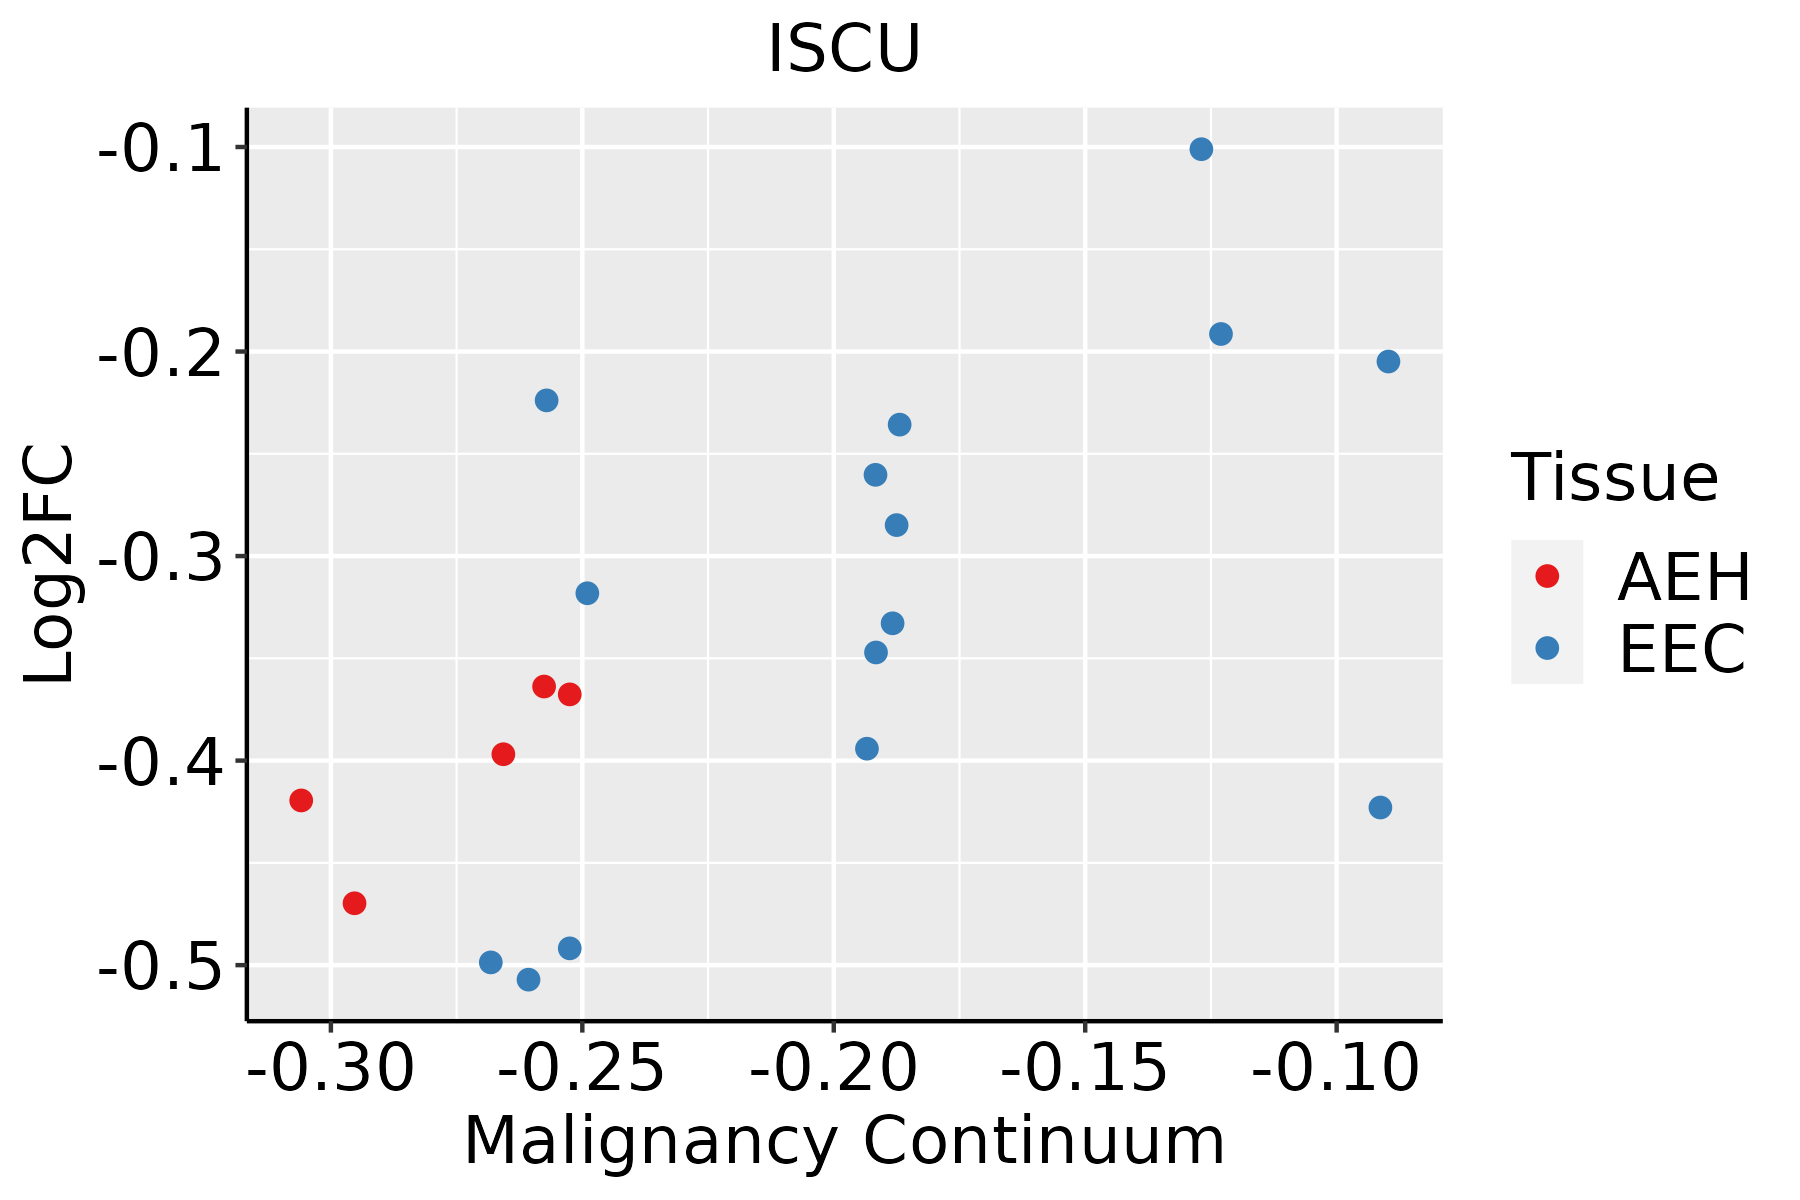
AEH: Atypical endometrial hyperplasia
EEC: Endometrioid Cancer
EsophagusThe image shows the transcriptomic changes along malignancy continuum.log2FC in expression of this searched gene in stem-like cells from each diseased tissue sample relative to stem-like cells in normal samples in each tissue plotted against the malignancy continuum. Samples are colored based on if they are from different disease stage.
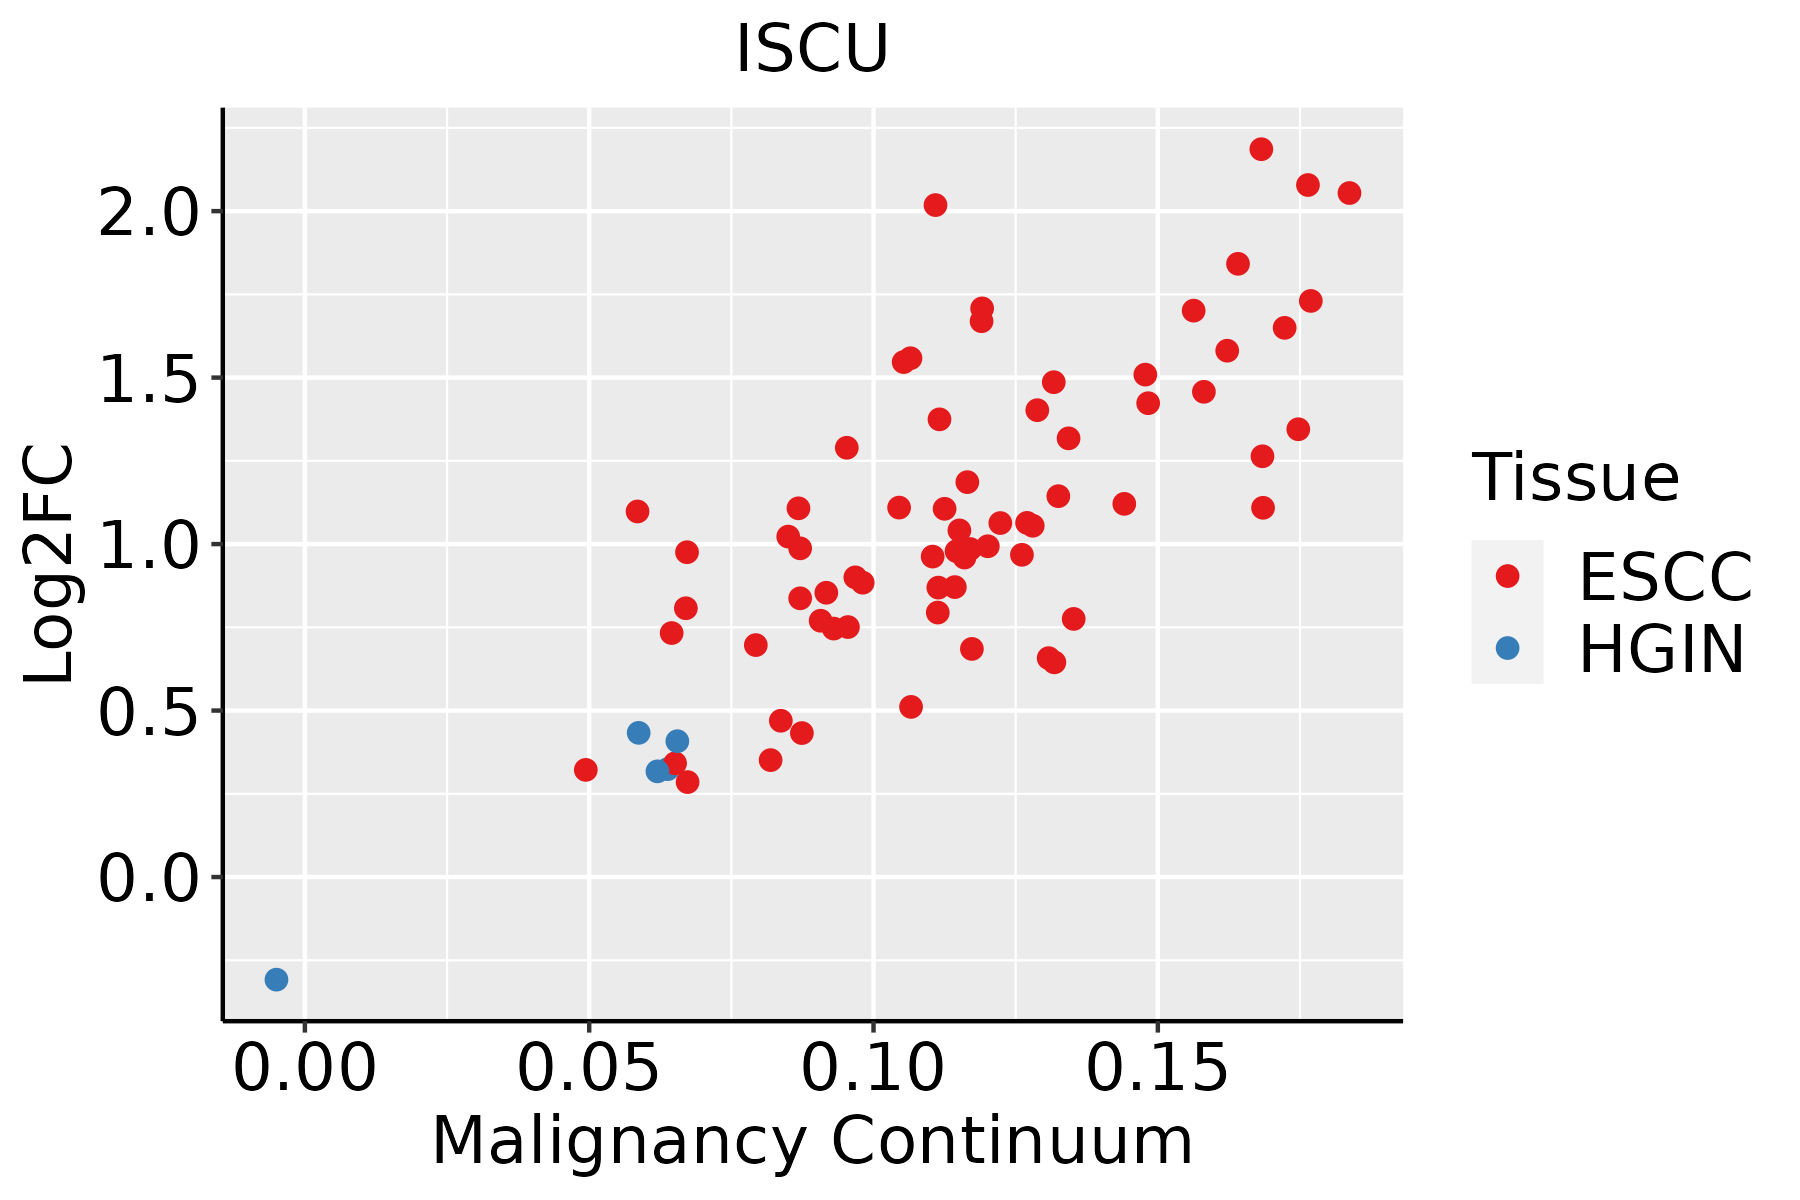
ESCC: Esophageal squamous cell carcinoma
HGIN: High-grade intraepithelial neoplasias
LGIN: Low-grade intraepithelial neoplasias
LiverThe image shows the transcriptomic changes along malignancy continuum.log2FC in expression of this searched gene in stem-like cells from each diseased tissue sample relative to stem-like cells in normal samples in each tissue plotted against the malignancy continuum. Samples are colored based on if they are from different disease stage.
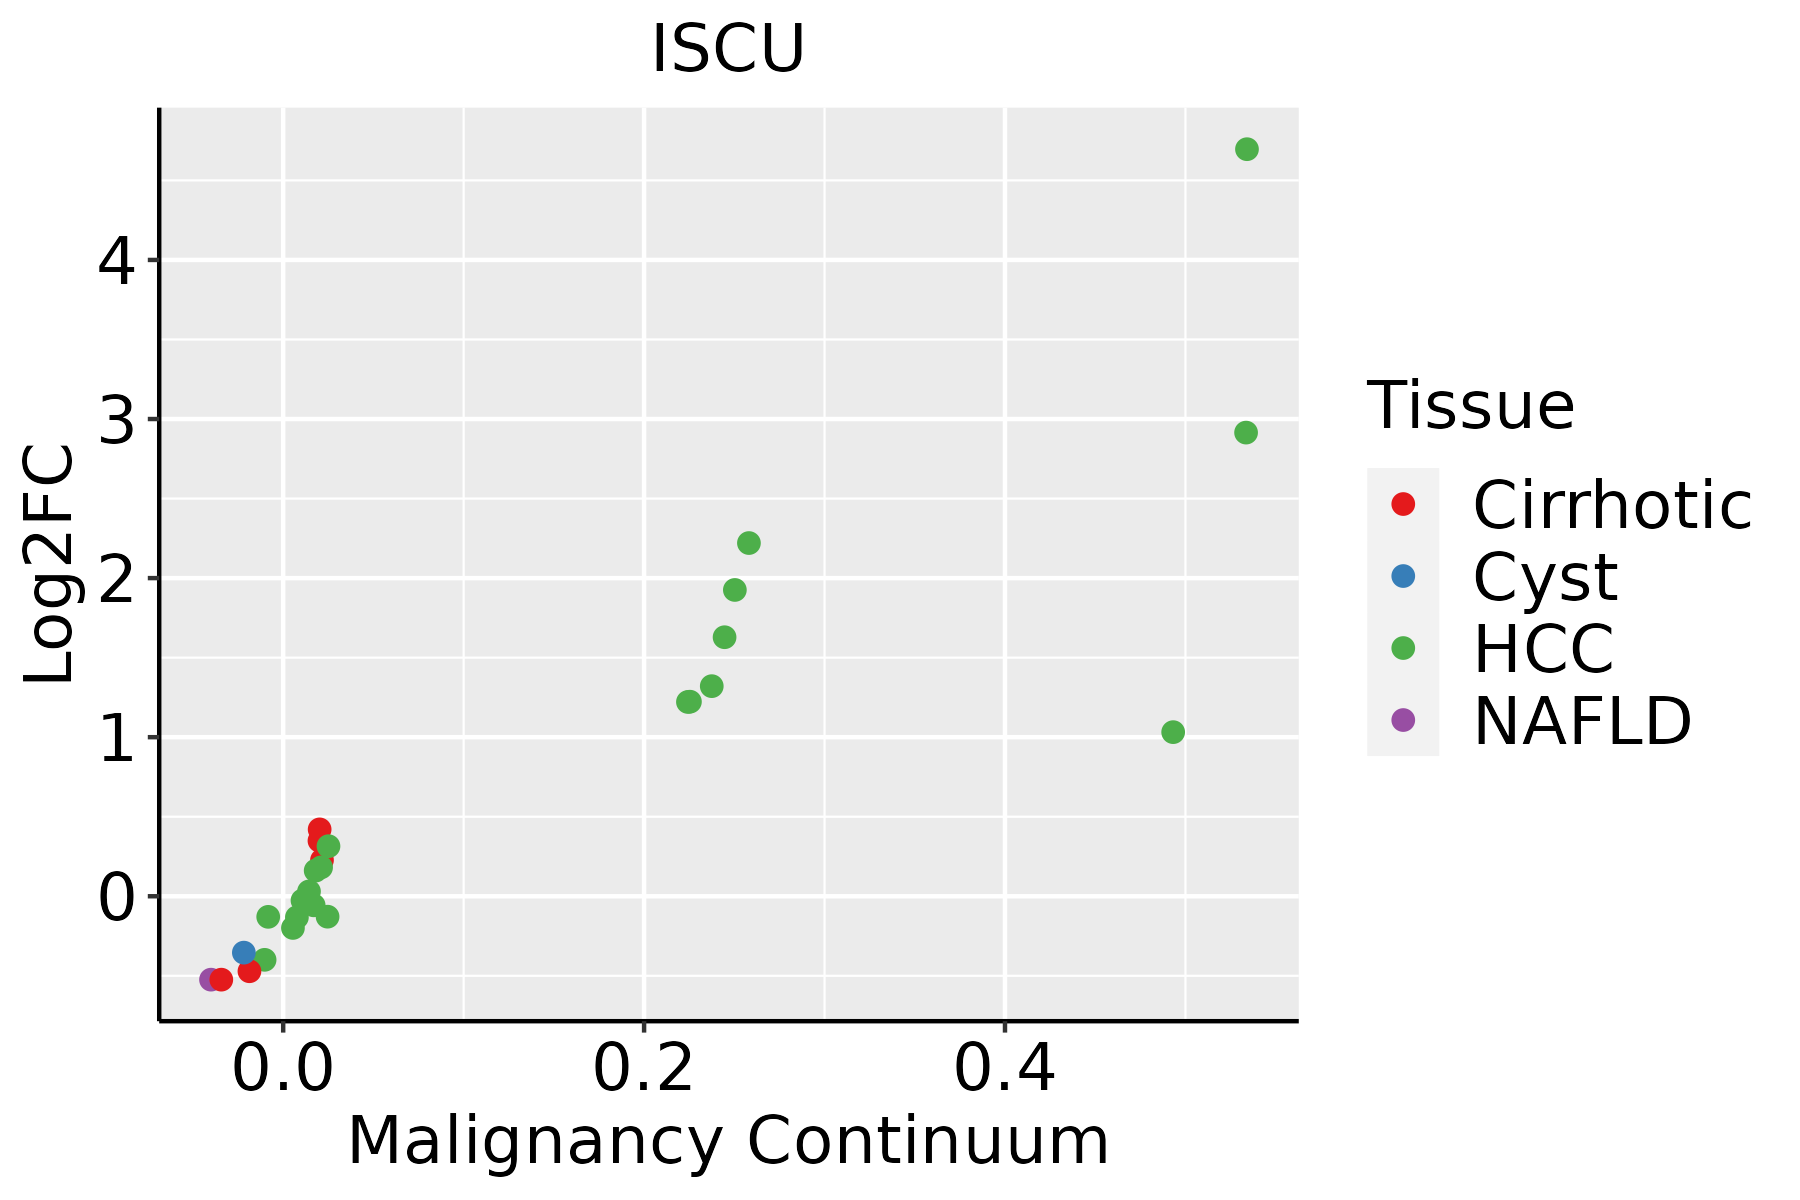
HCC: Hepatocellular carcinoma
NAFLD: Non-alcoholic fatty liver disease
Oral CavityThe image shows the transcriptomic changes along malignancy continuum.log2FC in expression of this searched gene in stem-like cells from each diseased tissue sample relative to stem-like cells in normal samples in each tissue plotted against the malignancy continuum. Samples are colored based on if they are from different disease stage.
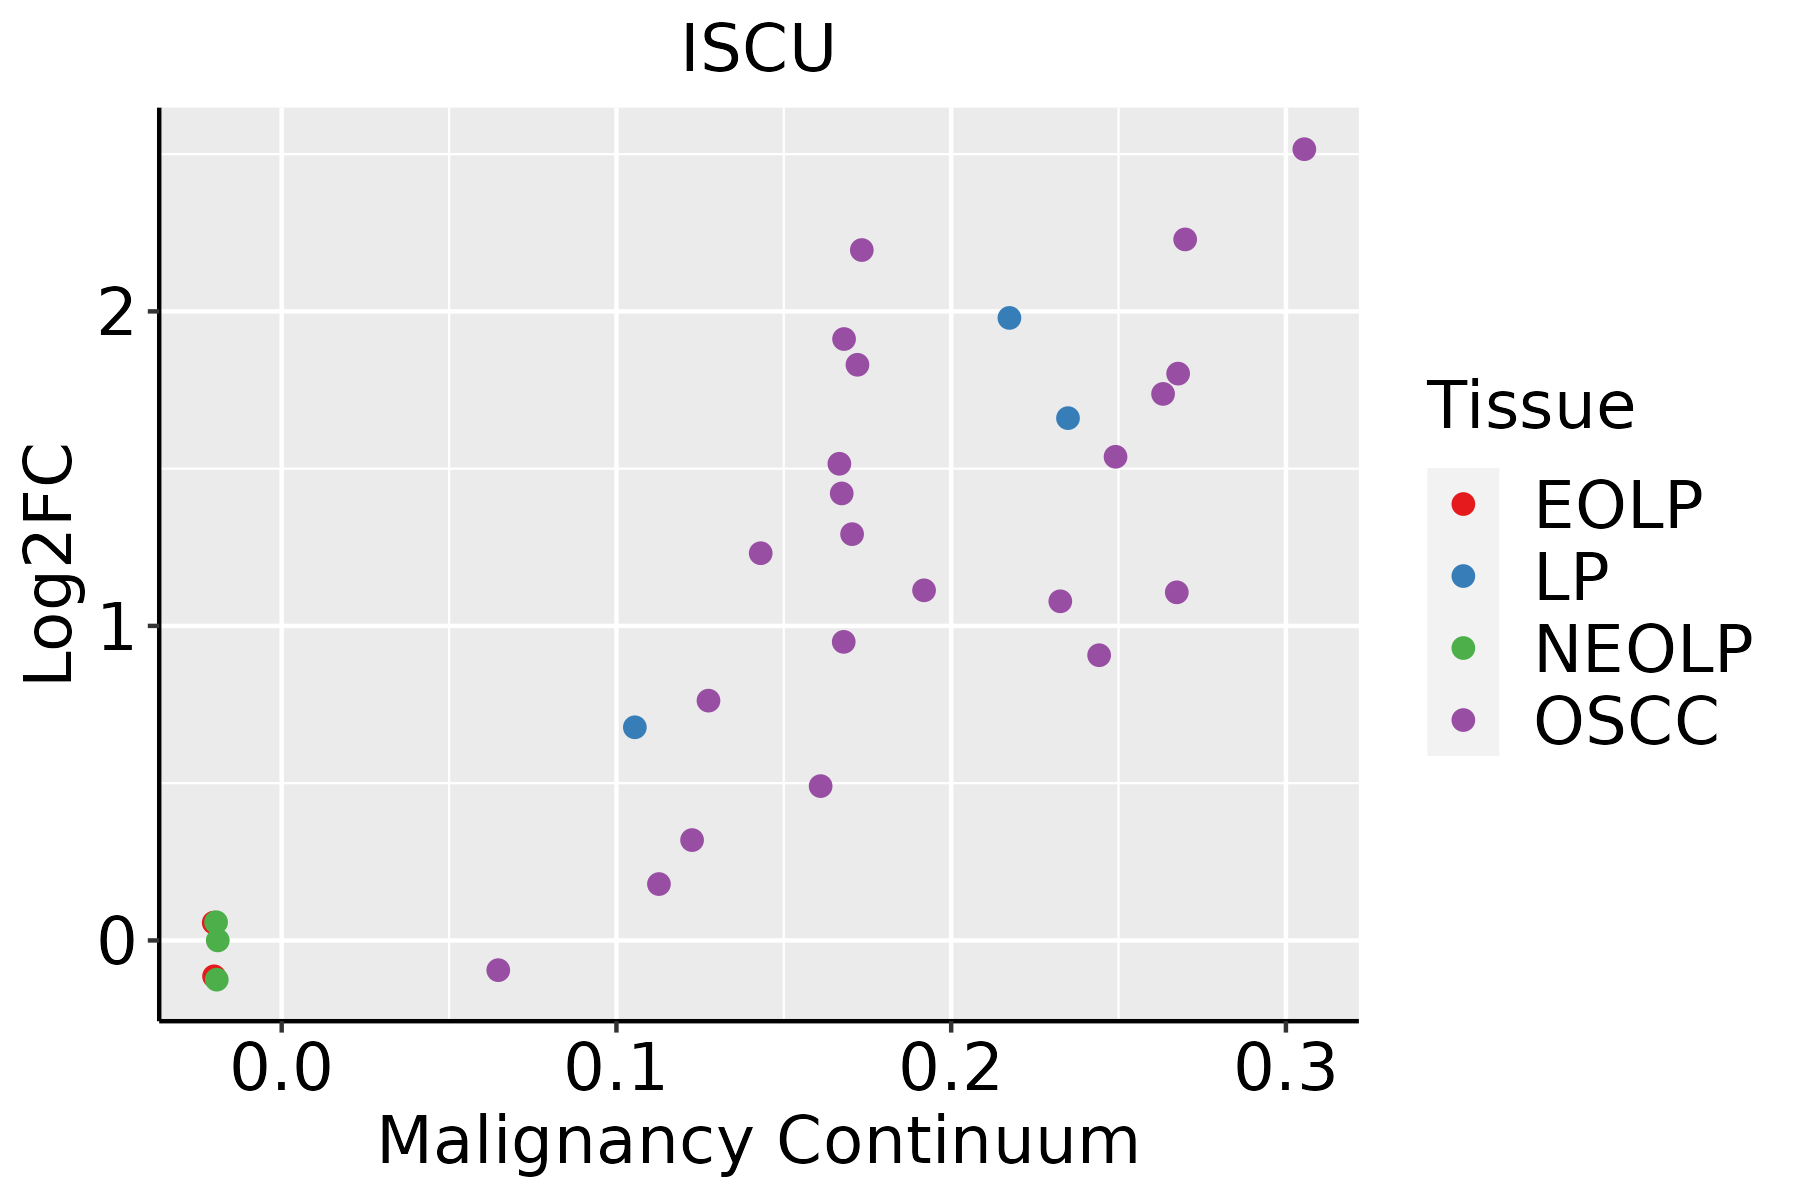
EOLP: Erosive Oral lichen planus
LP: leukoplakia
NEOLP: Non-erosive oral lichen planus
OSCC: Oral squamous cell carcinoma
ProstateThe image shows the transcriptomic changes along malignancy continuum.log2FC in expression of this searched gene in stem-like cells from each diseased tissue sample relative to stem-like cells in normal samples in each tissue plotted against the malignancy continuum. Samples are colored based on if they are from different disease stage.BPH: Benign Prostatic Hyperplasia
SkinThe image shows the transcriptomic changes along malignancy continuum.log2FC in expression of this searched gene in stem-like cells from each diseased tissue sample relative to stem-like cells in normal samples in each tissue plotted against the malignancy continuum. Samples are colored based on if they are from different disease stage.AK: Actinic keratosis
cSCC: Cutaneous squamous cell carcinoma
SCCIS:squamous cell carcinoma in situ
ThyroidThe image shows the transcriptomic changes along malignancy continuum.log2FC in expression of this searched gene in stem-like cells from each diseased tissue sample relative to stem-like cells in normal samples in each tissue plotted against the malignancy continuum. Samples are colored based on if they are from different disease stage.
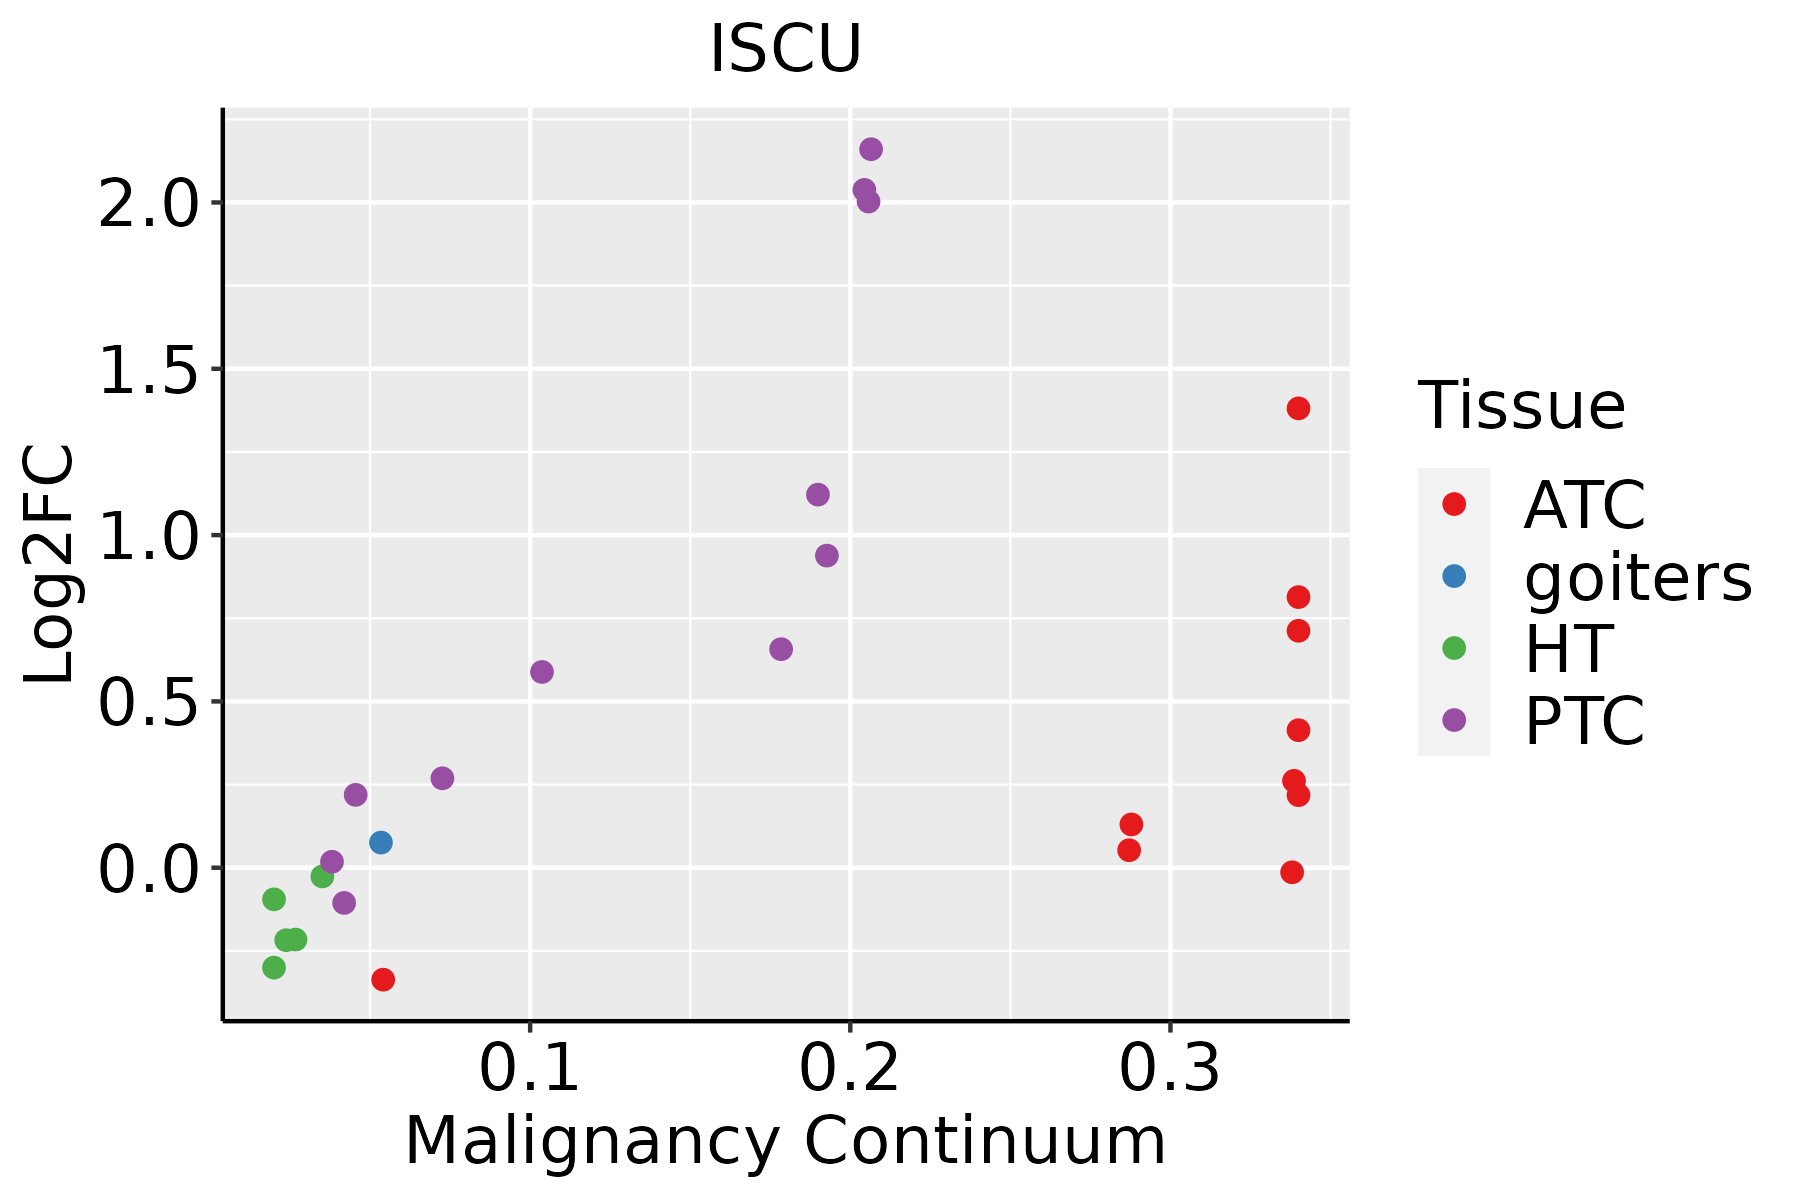
ATC: Anaplastic thyroid cancer
HT: Hashimoto's thyroiditis
PTC: Papillary thyroid cancer
∗log2FC in expression of this searched gene in stem-like cells from each diseased tissue sample relative to stem-like cells in normal samples in each tissue plotted against the malignancy continuum. Samples are colored based on if they are from different disease stage.

Top

Malignant transformation related pathway analysis

check buttonFind out the enriched GO biological processes and KEGG pathways involved in transition from healthy to precancer to cancer
check button Figure of enriched GO biological processes.
TissueDisease StageEnriched GO biological Processes
ColorectumADGO analysis - Figure of enriched GO biological processes: Top 15 enriched GO BP terms are showed in the bar plot of each disease state in each tissue. Each row represents a significant GO biological process which is colored according to the -log10(p.adjust).
ColorectumSERGO analysis - Figure of enriched GO biological processes: Top 15 enriched GO BP terms are showed in the bar plot of each disease state in each tissue. Each row represents a significant GO biological process which is colored according to the -log10(p.adjust).
ColorectumMSSGO analysis - Figure of enriched GO biological processes: Top 15 enriched GO BP terms are showed in the bar plot of each disease state in each tissue. Each row represents a significant GO biological process which is colored according to the -log10(p.adjust).
ColorectumMSI-HGO analysis - Figure of enriched GO biological processes: Top 15 enriched GO BP terms are showed in the bar plot of each disease state in each tissue. Each row represents a significant GO biological process which is colored according to the -log10(p.adjust).
ColorectumFAPGO analysis - Figure of enriched GO biological processes: Top 15 enriched GO BP terms are showed in the bar plot of each disease state in each tissue. Each row represents a significant GO biological process which is colored according to the -log10(p.adjust).
∗Top 15 enriched GO BP terms are showed in the bar plot of each disease state in each tissue. Each row represents a significant GO biological process which is colored according to the -log10(p.adjust).
Page: 1 2 3 4 5 6 7 8 9 

check button Enriched GO biological processes.
GO IDTissueDisease StageDescriptionGene RatioBg Ratiopvaluep.adjustCount
GO:0046034ColorectumADATP metabolic process142/3918277/187232.64e-298.26e-26142
GO:0006091ColorectumADgeneration of precursor metabolites and energy209/3918490/187233.17e-286.61e-25209
GO:0009060ColorectumADaerobic respiration108/3918189/187239.14e-281.43e-24108
GO:0045333ColorectumADcellular respiration119/3918230/187233.21e-254.02e-22119
GO:0006119ColorectumADoxidative phosphorylation83/3918141/187237.95e-238.30e-2083
GO:0015980ColorectumADenergy derivation by oxidation of organic compounds143/3918318/187232.78e-222.49e-19143
GO:0022900ColorectumADelectron transport chain89/3918175/187231.42e-188.91e-1689
GO:0019646ColorectumADaerobic electron transport chain53/391887/187235.58e-162.16e-1353
GO:0042773ColorectumADATP synthesis coupled electron transport56/391895/187236.76e-162.22e-1356
GO:0042775ColorectumADmitochondrial ATP synthesis coupled electron transport56/391895/187236.76e-162.22e-1356
GO:0022904ColorectumADrespiratory electron transport chain63/3918114/187238.23e-162.45e-1363
GO:0006120ColorectumADmitochondrial electron transport, NADH to ubiquinone32/391851/187231.12e-101.11e-0832
GO:0055076ColorectumADtransition metal ion homeostasis53/3918138/187231.89e-065.65e-0553
GO:0043467ColorectumADregulation of generation of precursor metabolites and energy49/3918130/187238.33e-061.99e-0449
GO:0046916ColorectumADcellular transition metal ion homeostasis43/3918115/187233.62e-056.56e-0443
GO:0006790ColorectumADsulfur compound metabolic process101/3918339/187236.46e-051.07e-03101
GO:0055072ColorectumADiron ion homeostasis32/391885/187232.97e-043.60e-0332
GO:0043457ColorectumADregulation of cellular respiration20/391849/187231.23e-031.09e-0220
GO:1903715ColorectumADregulation of aerobic respiration15/391833/187231.36e-031.18e-0215
GO:0006879ColorectumADcellular iron ion homeostasis25/391867/187231.51e-031.27e-0225
Page: 1 2 3 4 5 6 7 8 9 10 11 12 13 14 15 16 17 18 19 

check button Enriched KEGG pathways.
Pathway IDTissueDisease StageDescriptionGene RatioBg Ratiopvaluep.adjustqvalueCount
Page: 1 

Top

Cell-cell communication analysis

check buttonIdentification of potential cell-cell interactions between two cell types and their ligand-receptor pairs for different disease states
LigandReceptorLRpairPathwayTissueDisease Stage
Page: 1 

Top

Single-cell gene regulatory network inference analysis

check buttonFind out the significant the regulons (TFs) and the target genes of each regulon across cell types for different disease states
TFCell TypeTissueDisease StageTarget GeneRSSRegulon Activity
∗The dot plots of a searched regulon are shown for all cell subpopulations in each disease state of each tissue based on the regulon specific score inferred using pySCENIC and by calculating the average expression.
Page: 1 

Top

Somatic mutation of malignant transformation related genes

check buttonAnnotation of somatic variants for genes involved in malignant transformation
Hugo SymbolVariant ClassVariant ClassificationdbSNP RSHGVScHGVSpHGVSp ShortSWISSPROTBIOTYPESIFTPolyPhenTumor Sample BarcodeTissueHistologySexAgeStageTherapy TypesDrugsOutcome
ISCUinsertionFrame_Shift_Insnovelc.209_210insACCATTCAAGAGAAAAATCCATTTCCCAGATTCCTCCCCTTTAp.Asp71ProfsTer15p.D71Pfs*15Q9H1K1protein_codingTCGA-B6-A0IA-01Breastbreast invasive carcinomaFemale<65I/IIUnknownUnknownSD
ISCUSNVMissense_Mutationc.214N>Ap.Val72Ilep.V72IQ9H1K1protein_codingdeleterious_low_confidence(0.01)possibly_damaging(0.88)TCGA-AA-A017-01Colorectumcolon adenocarcinomaFemale<65I/IIUnknownUnknownSD
ISCUSNVMissense_Mutationnovelc.278T>Gp.Phe93Cysp.F93CQ9H1K1protein_codingdeleterious_low_confidence(0)probably_damaging(1)TCGA-A5-A0G2-01Endometriumuterine corpus endometrioid carcinomaFemale<65III/IVUnknownUnknownSD
ISCUSNVMissense_Mutationrs371513074c.145N>Ap.Val49Metp.V49MQ9H1K1protein_codingdeleterious_low_confidence(0.01)probably_damaging(0.956)TCGA-AJ-A3BG-01Endometriumuterine corpus endometrioid carcinomaFemale>=65I/IIChemotherapycarboplatinPD
ISCUSNVMissense_Mutationc.421N>Ap.Leu141Metp.L141MQ9H1K1protein_codingdeleterious(0)probably_damaging(0.998)TCGA-D1-A103-01Endometriumuterine corpus endometrioid carcinomaFemale>=65I/IIUnknownUnknownSD
ISCUSNVMissense_Mutationnovelc.394N>Tp.Pro132Serp.P132SQ9H1K1protein_codingdeleterious_low_confidence(0)probably_damaging(1)TCGA-DF-A2KU-01Endometriumuterine corpus endometrioid carcinomaFemaleUnknownI/IIUnknownUnknownSD
ISCUSNVMissense_Mutationnovelc.398C>Tp.Pro133Leup.P133LQ9H1K1protein_codingdeleterious_low_confidence(0)probably_damaging(1)TCGA-EC-A24G-01Endometriumuterine corpus endometrioid carcinomaFemale<65I/IIChemotherapydoxorubicinSD
ISCUSNVMissense_Mutationnovelc.358N>Tp.Ile120Phep.I120FQ9H1K1protein_codingdeleterious_low_confidence(0)probably_damaging(0.981)TCGA-DD-AAW1-01Liverliver hepatocellular carcinomaMale<65III/IVUnknownUnknownSD
ISCUSNVMissense_Mutationc.241N>Ap.Glu81Lysp.E81KQ9H1K1protein_codingtolerated_low_confidence(0.06)benign(0.052)TCGA-05-4395-01Lunglung adenocarcinomaMale>=65III/IVUnknownUnknownSD
ISCUinsertionIn_Frame_Insrs763609964c.228_228+1insATTCAAp.Ile77_Gln78dupp.I77_Q78dupQ9H1K1protein_codingTCGA-CV-7245-01Oral cavityhead & neck squamous cell carcinomaMale<65I/IIUnknownUnknownSD
Page: 1 2 

Top

Related drugs of malignant transformation related genes

check buttonIdentification of chemicals and drugs interact with genes involved in malignant transfromation
(DGIdb 4.0)
Entrez IDSymbolCategoryInteraction TypesDrug Claim NameDrug NamePMIDs
Page: 1