
|
|||||
|
 | |
| |
| |
| |
| |
| |
|
Gene: ISCA1 |
Gene summary for ISCA1 |
| Gene information | Species | Human | Gene symbol | ISCA1 | Gene ID | 81689 |
| Gene name | iron-sulfur cluster assembly 1 | |
| Gene Alias | HBLD2 | |
| Cytomap | 9q21.33 | |
| Gene Type | protein-coding | GO ID | GO:0006790 | UniProtAcc | Q9BUE6 |
Top |
Malignant transformation analysis |
| Identification of the aberrant gene expression in precancerous and cancerous lesions by comparing the gene expression of stem-like cells in diseased tissues with normal stem cells |
| Entrez ID | Symbol | Replicates | Species | Organ | Tissue | Adj P-value | Log2FC | Malignancy |
| 81689 | ISCA1 | LZE2D | Human | Esophagus | HGIN | 2.70e-02 | 3.08e-01 | 0.0642 |
| 81689 | ISCA1 | LZE4T | Human | Esophagus | ESCC | 1.05e-12 | 4.18e-01 | 0.0811 |
| 81689 | ISCA1 | LZE7T | Human | Esophagus | ESCC | 4.06e-09 | 5.92e-01 | 0.0667 |
| 81689 | ISCA1 | LZE8T | Human | Esophagus | ESCC | 5.01e-05 | 5.99e-02 | 0.067 |
| 81689 | ISCA1 | LZE20T | Human | Esophagus | ESCC | 1.97e-03 | -6.90e-02 | 0.0662 |
| 81689 | ISCA1 | LZE22T | Human | Esophagus | ESCC | 6.41e-05 | 3.53e-01 | 0.068 |
| 81689 | ISCA1 | LZE24T | Human | Esophagus | ESCC | 5.63e-10 | 3.72e-01 | 0.0596 |
| 81689 | ISCA1 | LZE6T | Human | Esophagus | ESCC | 2.21e-08 | 5.07e-01 | 0.0845 |
| 81689 | ISCA1 | P1T-E | Human | Esophagus | ESCC | 1.16e-05 | 1.38e-01 | 0.0875 |
| 81689 | ISCA1 | P2T-E | Human | Esophagus | ESCC | 1.93e-29 | 5.58e-01 | 0.1177 |
| 81689 | ISCA1 | P4T-E | Human | Esophagus | ESCC | 1.39e-20 | 4.42e-01 | 0.1323 |
| 81689 | ISCA1 | P5T-E | Human | Esophagus | ESCC | 4.68e-16 | 2.95e-01 | 0.1327 |
| 81689 | ISCA1 | P8T-E | Human | Esophagus | ESCC | 7.06e-14 | 5.17e-02 | 0.0889 |
| 81689 | ISCA1 | P9T-E | Human | Esophagus | ESCC | 2.82e-17 | 4.52e-01 | 0.1131 |
| 81689 | ISCA1 | P10T-E | Human | Esophagus | ESCC | 7.55e-25 | 3.97e-01 | 0.116 |
| 81689 | ISCA1 | P11T-E | Human | Esophagus | ESCC | 1.14e-16 | 7.98e-01 | 0.1426 |
| 81689 | ISCA1 | P12T-E | Human | Esophagus | ESCC | 2.05e-23 | 4.20e-01 | 0.1122 |
| 81689 | ISCA1 | P15T-E | Human | Esophagus | ESCC | 1.43e-27 | 6.74e-01 | 0.1149 |
| 81689 | ISCA1 | P16T-E | Human | Esophagus | ESCC | 2.86e-23 | 3.89e-01 | 0.1153 |
| 81689 | ISCA1 | P17T-E | Human | Esophagus | ESCC | 1.69e-10 | 4.71e-01 | 0.1278 |
| Page: 1 2 3 4 5 6 |
| Tissue | Expression Dynamics | Abbreviation |
| Esophagus |  | ESCC: Esophageal squamous cell carcinoma |
| HGIN: High-grade intraepithelial neoplasias | ||
| LGIN: Low-grade intraepithelial neoplasias | ||
| Liver | 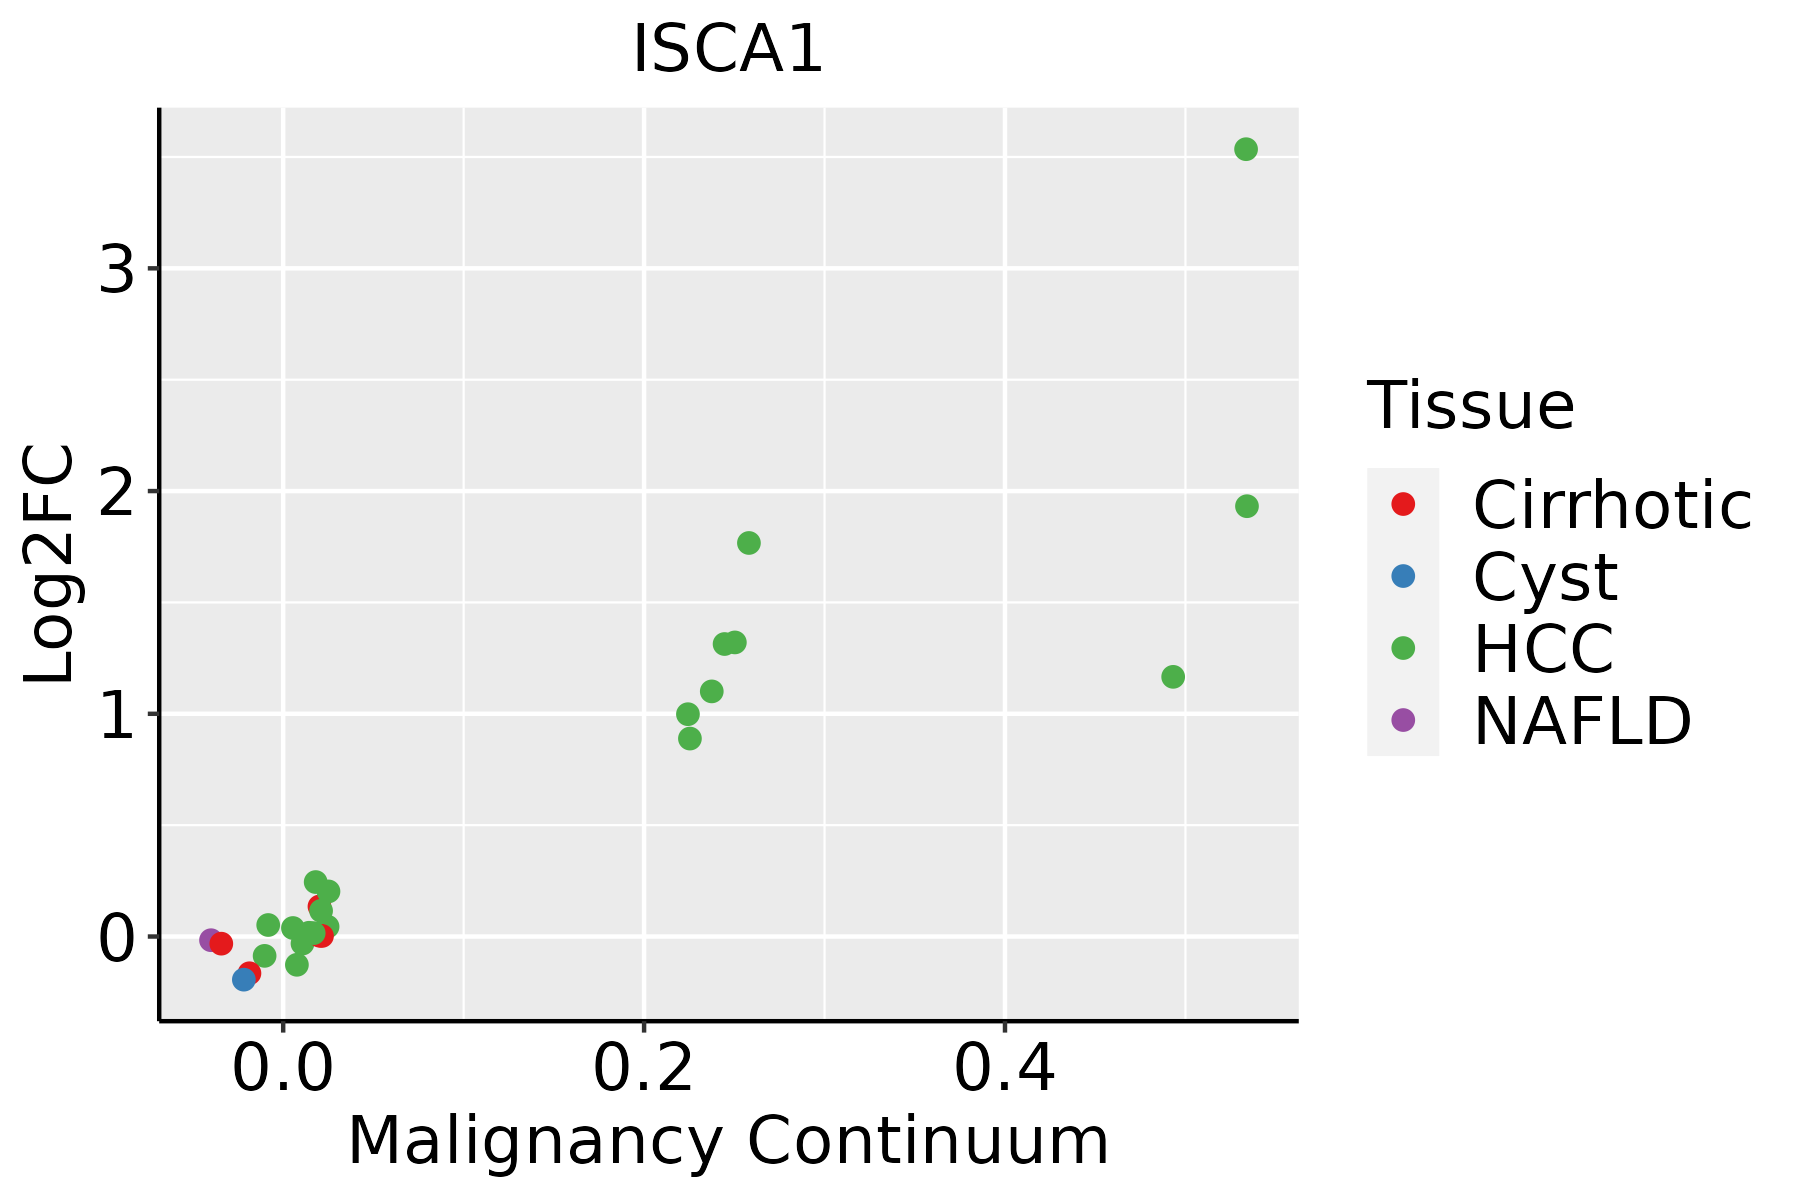 | HCC: Hepatocellular carcinoma |
| NAFLD: Non-alcoholic fatty liver disease | ||
| Oral Cavity | 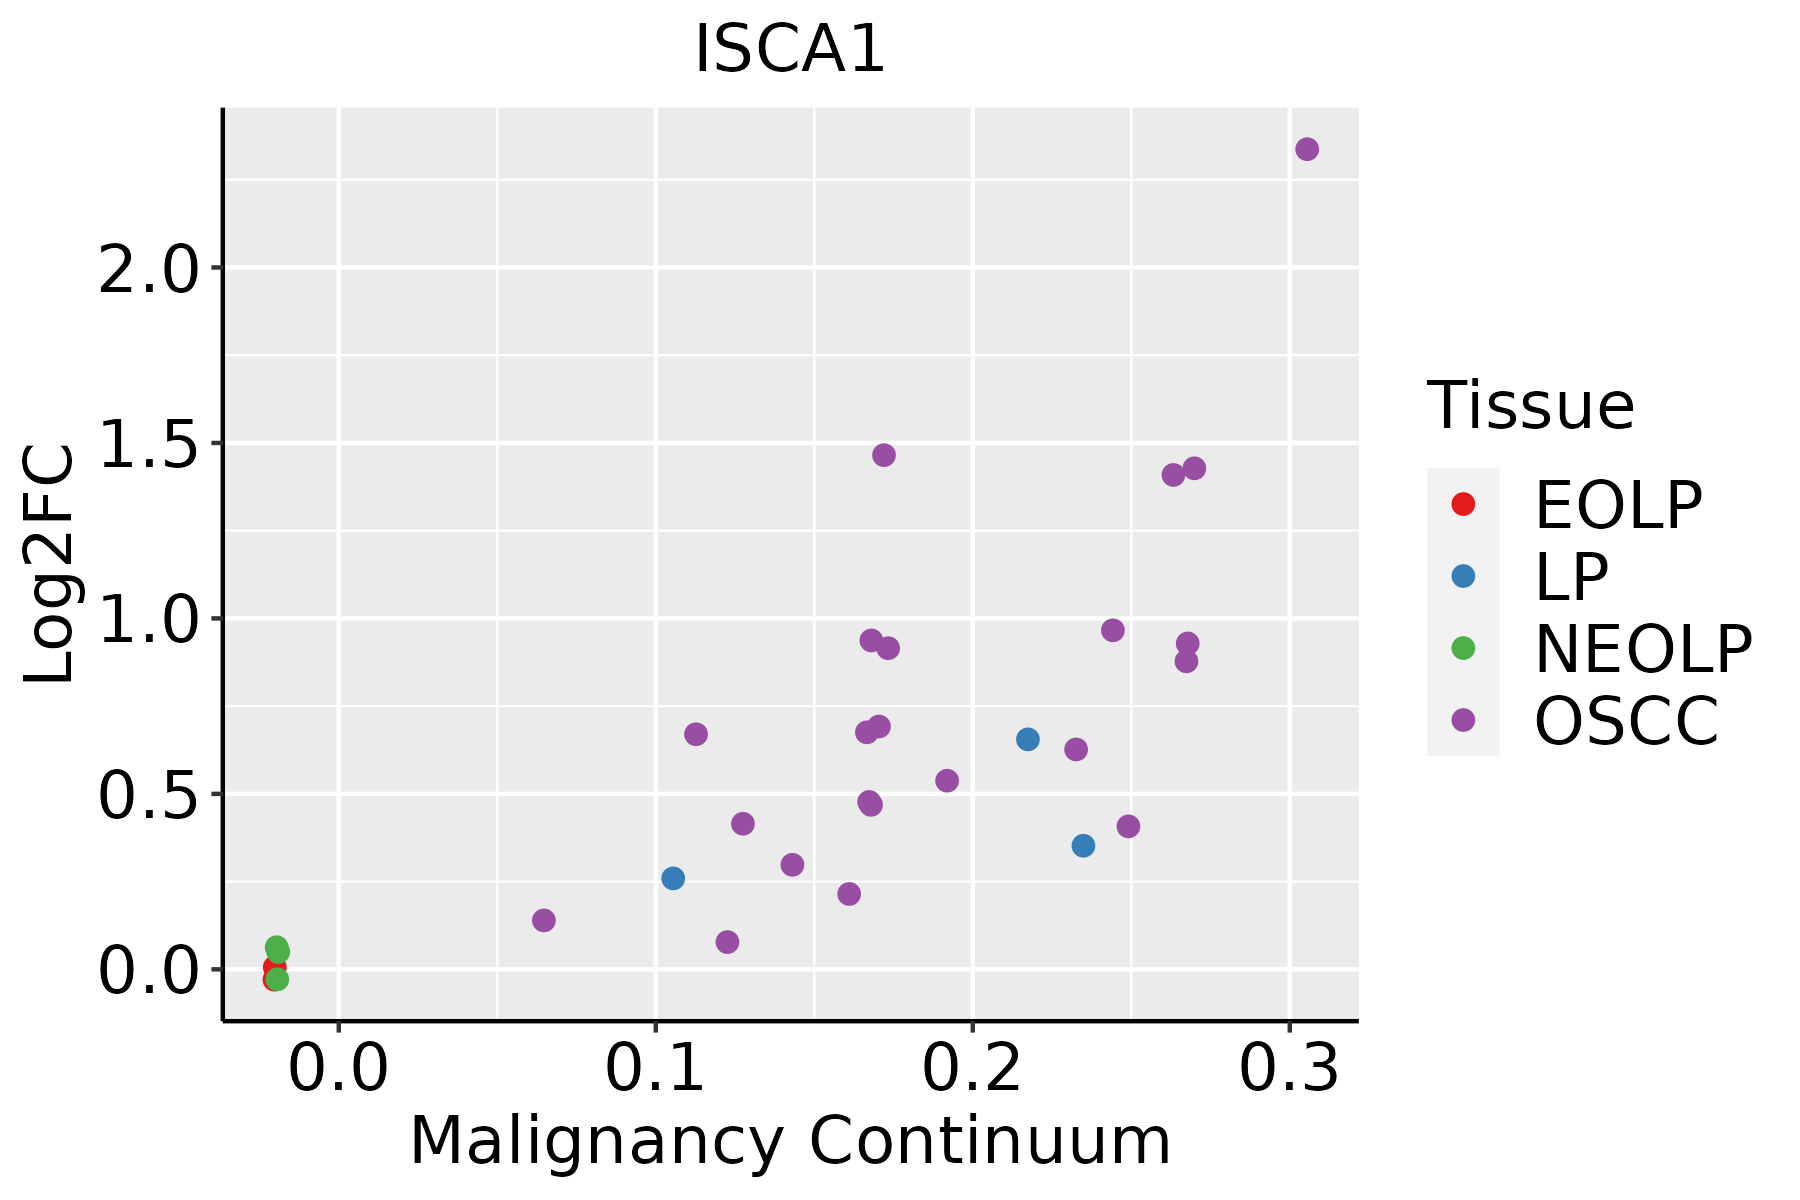 | EOLP: Erosive Oral lichen planus |
| LP: leukoplakia | ||
| NEOLP: Non-erosive oral lichen planus | ||
| OSCC: Oral squamous cell carcinoma | ||
| Skin |  | AK: Actinic keratosis |
| cSCC: Cutaneous squamous cell carcinoma | ||
| SCCIS:squamous cell carcinoma in situ | ||
| Thyroid | 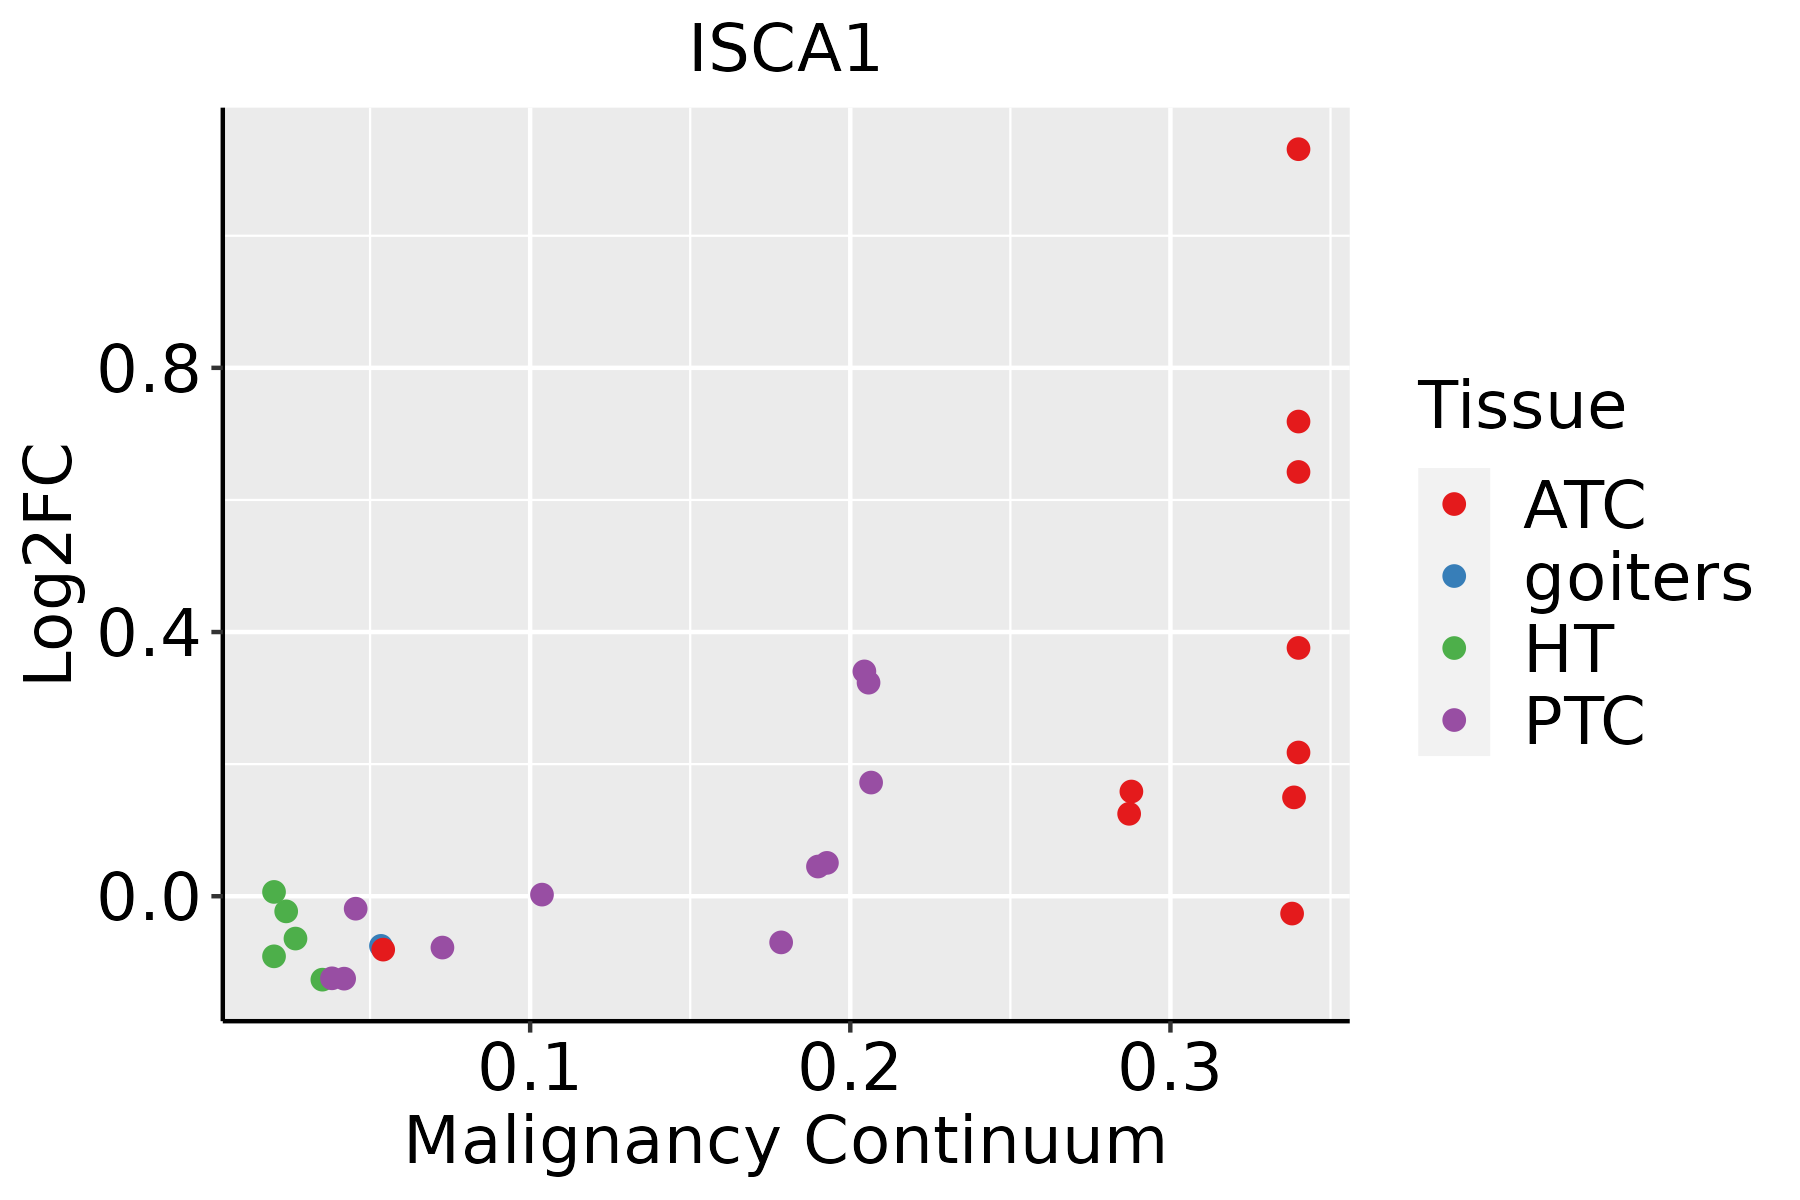 | ATC: Anaplastic thyroid cancer |
| HT: Hashimoto's thyroiditis | ||
| PTC: Papillary thyroid cancer |
| ∗log2FC in expression of this searched gene in stem-like cells from each diseased tissue sample relative to stem-like cells in normal samples in each tissue plotted against the malignancy continuum. Samples are colored based on if they are from different disease stage. |
Top |
Malignant transformation related pathway analysis |
| Find out the enriched GO biological processes and KEGG pathways involved in transition from healthy to precancer to cancer |
| Tissue | Disease Stage | Enriched GO biological Processes |
| Colorectum | AD |  |
| Colorectum | SER |  |
| Colorectum | MSS |  |
| Colorectum | MSI-H |  |
| Colorectum | FAP |  |
| ∗Top 15 enriched GO BP terms are showed in the bar plot of each disease state in each tissue. Each row represents a significant GO biological process which is colored according to the -log10(p.adjust). |
| Page: 1 2 3 4 5 6 7 8 9 |
| GO ID | Tissue | Disease Stage | Description | Gene Ratio | Bg Ratio | pvalue | p.adjust | Count |
| GO:005160417 | Esophagus | HGIN | protein maturation | 68/2587 | 294/18723 | 9.77e-06 | 2.86e-04 | 68 |
| GO:00974282 | Esophagus | HGIN | protein maturation by iron-sulfur cluster transfer | 8/2587 | 16/18723 | 6.00e-04 | 8.41e-03 | 8 |
| GO:00162263 | Esophagus | HGIN | iron-sulfur cluster assembly | 10/2587 | 26/18723 | 1.60e-03 | 1.79e-02 | 10 |
| GO:00311633 | Esophagus | HGIN | metallo-sulfur cluster assembly | 10/2587 | 26/18723 | 1.60e-03 | 1.79e-02 | 10 |
| GO:005160418 | Esophagus | ESCC | protein maturation | 189/8552 | 294/18723 | 7.64e-11 | 2.39e-09 | 189 |
| GO:00067906 | Esophagus | ESCC | sulfur compound metabolic process | 201/8552 | 339/18723 | 2.64e-07 | 3.94e-06 | 201 |
| GO:001622611 | Esophagus | ESCC | iron-sulfur cluster assembly | 21/8552 | 26/18723 | 2.69e-04 | 1.63e-03 | 21 |
| GO:003116311 | Esophagus | ESCC | metallo-sulfur cluster assembly | 21/8552 | 26/18723 | 2.69e-04 | 1.63e-03 | 21 |
| GO:009742811 | Esophagus | ESCC | protein maturation by iron-sulfur cluster transfer | 14/8552 | 16/18723 | 6.78e-04 | 3.56e-03 | 14 |
| GO:00516046 | Liver | Cirrhotic | protein maturation | 121/4634 | 294/18723 | 3.54e-10 | 1.68e-08 | 121 |
| GO:000679011 | Liver | Cirrhotic | sulfur compound metabolic process | 129/4634 | 339/18723 | 3.06e-08 | 1.04e-06 | 129 |
| GO:000679021 | Liver | HCC | sulfur compound metabolic process | 212/7958 | 339/18723 | 5.60e-14 | 3.39e-12 | 212 |
| GO:005160412 | Liver | HCC | protein maturation | 171/7958 | 294/18723 | 3.80e-08 | 8.30e-07 | 171 |
| GO:0016226 | Liver | HCC | iron-sulfur cluster assembly | 18/7958 | 26/18723 | 5.37e-03 | 2.24e-02 | 18 |
| GO:0031163 | Liver | HCC | metallo-sulfur cluster assembly | 18/7958 | 26/18723 | 5.37e-03 | 2.24e-02 | 18 |
| GO:005160410 | Oral cavity | OSCC | protein maturation | 170/7305 | 294/18723 | 3.97e-11 | 1.28e-09 | 170 |
| GO:00067905 | Oral cavity | OSCC | sulfur compound metabolic process | 168/7305 | 339/18723 | 4.50e-05 | 3.84e-04 | 168 |
| GO:00162262 | Oral cavity | OSCC | iron-sulfur cluster assembly | 19/7305 | 26/18723 | 4.46e-04 | 2.70e-03 | 19 |
| GO:00311632 | Oral cavity | OSCC | metallo-sulfur cluster assembly | 19/7305 | 26/18723 | 4.46e-04 | 2.70e-03 | 19 |
| GO:0097428 | Oral cavity | OSCC | protein maturation by iron-sulfur cluster transfer | 11/7305 | 16/18723 | 1.56e-02 | 4.99e-02 | 11 |
| Page: 1 2 |
| Pathway ID | Tissue | Disease Stage | Description | Gene Ratio | Bg Ratio | pvalue | p.adjust | qvalue | Count |
| Page: 1 |
Top |
Cell-cell communication analysis |
| Identification of potential cell-cell interactions between two cell types and their ligand-receptor pairs for different disease states |
| Ligand | Receptor | LRpair | Pathway | Tissue | Disease Stage |
| Page: 1 |
Top |
Single-cell gene regulatory network inference analysis |
| Find out the significant the regulons (TFs) and the target genes of each regulon across cell types for different disease states |
| TF | Cell Type | Tissue | Disease Stage | Target Gene | RSS | Regulon Activity |
| ∗The dot plots of a searched regulon are shown for all cell subpopulations in each disease state of each tissue based on the regulon specific score inferred using pySCENIC and by calculating the average expression. |
| Page: 1 |
Top |
Somatic mutation of malignant transformation related genes |
| Annotation of somatic variants for genes involved in malignant transformation |
| Hugo Symbol | Variant Class | Variant Classification | dbSNP RS | HGVSc | HGVSp | HGVSp Short | SWISSPROT | BIOTYPE | SIFT | PolyPhen | Tumor Sample Barcode | Tissue | Histology | Sex | Age | Stage | Therapy Types | Drugs | Outcome |
| ISCA1 | SNV | Missense_Mutation | c.158N>A | p.Arg53Gln | p.R53Q | Q9BUE6 | protein_coding | tolerated(0.11) | benign(0.188) | TCGA-C5-A3HE-01 | Cervix | cervical & endocervical cancer | Female | <65 | I/II | Unknown | Unknown | PD | |
| ISCA1 | SNV | Missense_Mutation | c.232N>C | p.Ile78Leu | p.I78L | Q9BUE6 | protein_coding | tolerated(0.37) | benign(0.006) | TCGA-AA-3492-01 | Colorectum | colon adenocarcinoma | Female | >=65 | I/II | Unknown | Unknown | SD | |
| ISCA1 | SNV | Missense_Mutation | novel | c.253T>G | p.Phe85Val | p.F85V | Q9BUE6 | protein_coding | tolerated(0.18) | benign(0.162) | TCGA-AA-3984-01 | Colorectum | colon adenocarcinoma | Female | <65 | I/II | Unknown | Unknown | SD |
| ISCA1 | SNV | Missense_Mutation | c.264G>T | p.Lys88Asn | p.K88N | Q9BUE6 | protein_coding | tolerated(0.16) | benign(0.041) | TCGA-AA-A010-01 | Colorectum | colon adenocarcinoma | Female | <65 | I/II | Chemotherapy | folinic | CR | |
| ISCA1 | SNV | Missense_Mutation | novel | c.109N>A | p.Gln37Lys | p.Q37K | Q9BUE6 | protein_coding | tolerated(0.39) | benign(0.003) | TCGA-AJ-A3EL-01 | Endometrium | uterine corpus endometrioid carcinoma | Female | <65 | I/II | Unknown | Unknown | SD |
| ISCA1 | SNV | Missense_Mutation | novel | c.254T>C | p.Phe85Ser | p.F85S | Q9BUE6 | protein_coding | deleterious(0) | possibly_damaging(0.901) | TCGA-B5-A3FC-01 | Endometrium | uterine corpus endometrioid carcinoma | Female | <65 | I/II | Unknown | Unknown | SD |
| ISCA1 | SNV | Missense_Mutation | rs755775475 | c.356G>A | p.Gly119Glu | p.G119E | Q9BUE6 | protein_coding | tolerated(0.22) | benign(0.18) | TCGA-22-5482-01 | Lung | lung squamous cell carcinoma | Male | >=65 | I/II | Unknown | Unknown | SD |
| ISCA1 | insertion | Frame_Shift_Ins | novel | c.245_246insT | p.Arg83GlnfsTer21 | p.R83Qfs*21 | Q9BUE6 | protein_coding | TCGA-05-4249-01 | Lung | lung adenocarcinoma | Male | >=65 | I/II | Unknown | Unknown | SD | ||
| ISCA1 | SNV | Missense_Mutation | novel | c.369N>G | p.Cys123Trp | p.C123W | Q9BUE6 | protein_coding | deleterious(0) | probably_damaging(1) | TCGA-CV-5436-01 | Oral cavity | head & neck squamous cell carcinoma | Male | >=65 | I/II | Unknown | Unknown | PD |
| ISCA1 | insertion | Frame_Shift_Ins | novel | c.312_313insT | p.Lys105Ter | p.K105* | Q9BUE6 | protein_coding | TCGA-FY-A4B0-01 | Thyroid | thyroid carcinoma | Male | >=65 | I/II | Hormone Therapy | synthroid | SD |
| Page: 1 2 |
Top |
Related drugs of malignant transformation related genes |
| Identification of chemicals and drugs interact with genes involved in malignant transfromation |
| (DGIdb 4.0) |
| Entrez ID | Symbol | Category | Interaction Types | Drug Claim Name | Drug Name | PMIDs |
| Page: 1 |

Copyright 2023-Present -The University of Texas Health Science Center at Houston |