
|
|||||
|
 | |
| |
| |
| |
| |
| |
|
Gene: IRX3 |
Gene summary for IRX3 |
| Gene information | Species | Human | Gene symbol | IRX3 | Gene ID | 79191 |
| Gene name | iroquois homeobox 3 | |
| Gene Alias | IRX-1 | |
| Cytomap | 16q12.2 | |
| Gene Type | protein-coding | GO ID | GO:0000122 | UniProtAcc | P78415 |
Top |
Malignant transformation analysis |
| Identification of the aberrant gene expression in precancerous and cancerous lesions by comparing the gene expression of stem-like cells in diseased tissues with normal stem cells |
| Entrez ID | Symbol | Replicates | Species | Organ | Tissue | Adj P-value | Log2FC | Malignancy |
| 79191 | IRX3 | GSM4909281 | Human | Breast | IDC | 6.62e-04 | 2.02e-01 | 0.21 |
| 79191 | IRX3 | GSM4909285 | Human | Breast | IDC | 9.66e-04 | 2.20e-02 | 0.21 |
| 79191 | IRX3 | GSM4909293 | Human | Breast | IDC | 9.71e-13 | 2.66e-01 | 0.1581 |
| 79191 | IRX3 | GSM4909297 | Human | Breast | IDC | 4.65e-06 | -2.04e-01 | 0.1517 |
| 79191 | IRX3 | GSM4909298 | Human | Breast | IDC | 2.92e-15 | 4.25e-01 | 0.1551 |
| 79191 | IRX3 | GSM4909299 | Human | Breast | IDC | 1.84e-05 | 3.00e-01 | 0.035 |
| 79191 | IRX3 | GSM4909301 | Human | Breast | IDC | 8.35e-24 | 6.43e-01 | 0.1577 |
| 79191 | IRX3 | GSM4909306 | Human | Breast | IDC | 5.36e-11 | 4.39e-01 | 0.1564 |
| 79191 | IRX3 | GSM4909311 | Human | Breast | IDC | 5.93e-13 | 1.54e-02 | 0.1534 |
| 79191 | IRX3 | GSM4909312 | Human | Breast | IDC | 1.51e-04 | 2.19e-01 | 0.1552 |
| 79191 | IRX3 | GSM4909319 | Human | Breast | IDC | 6.98e-29 | 3.18e-01 | 0.1563 |
| 79191 | IRX3 | GSM4909321 | Human | Breast | IDC | 3.74e-03 | -7.06e-02 | 0.1559 |
| 79191 | IRX3 | brca2 | Human | Breast | Precancer | 1.38e-02 | 1.07e-01 | -0.024 |
| 79191 | IRX3 | M1 | Human | Breast | IDC | 6.28e-04 | 3.86e-01 | 0.1577 |
| 79191 | IRX3 | M2 | Human | Breast | IDC | 1.52e-04 | 3.60e-01 | 0.21 |
| 79191 | IRX3 | NCCBC14 | Human | Breast | DCIS | 8.71e-06 | 2.56e-01 | 0.2021 |
| 79191 | IRX3 | NCCBC2 | Human | Breast | DCIS | 2.29e-12 | 7.31e-01 | 0.1554 |
| 79191 | IRX3 | NCCBC5 | Human | Breast | DCIS | 1.11e-03 | -1.40e-01 | 0.2046 |
| 79191 | IRX3 | P1 | Human | Breast | IDC | 4.55e-07 | 6.62e-02 | 0.1527 |
| 79191 | IRX3 | DCIS2 | Human | Breast | DCIS | 1.36e-32 | 3.05e-01 | 0.0085 |
| Page: 1 2 3 4 5 6 7 |
| Tissue | Expression Dynamics | Abbreviation |
| Breast |  | IDC: Invasive ductal carcinoma |
| DCIS: Ductal carcinoma in situ | ||
| Precancer(BRCA1-mut): Precancerous lesion from BRCA1 mutation carriers | ||
| Colorectum (GSE201348) |  | FAP: Familial adenomatous polyposis |
| CRC: Colorectal cancer | ||
| Colorectum (HTA11) |  | AD: Adenomas |
| SER: Sessile serrated lesions | ||
| MSI-H: Microsatellite-high colorectal cancer | ||
| MSS: Microsatellite stable colorectal cancer | ||
| Esophagus |  | ESCC: Esophageal squamous cell carcinoma |
| HGIN: High-grade intraepithelial neoplasias | ||
| LGIN: Low-grade intraepithelial neoplasias | ||
| Liver | 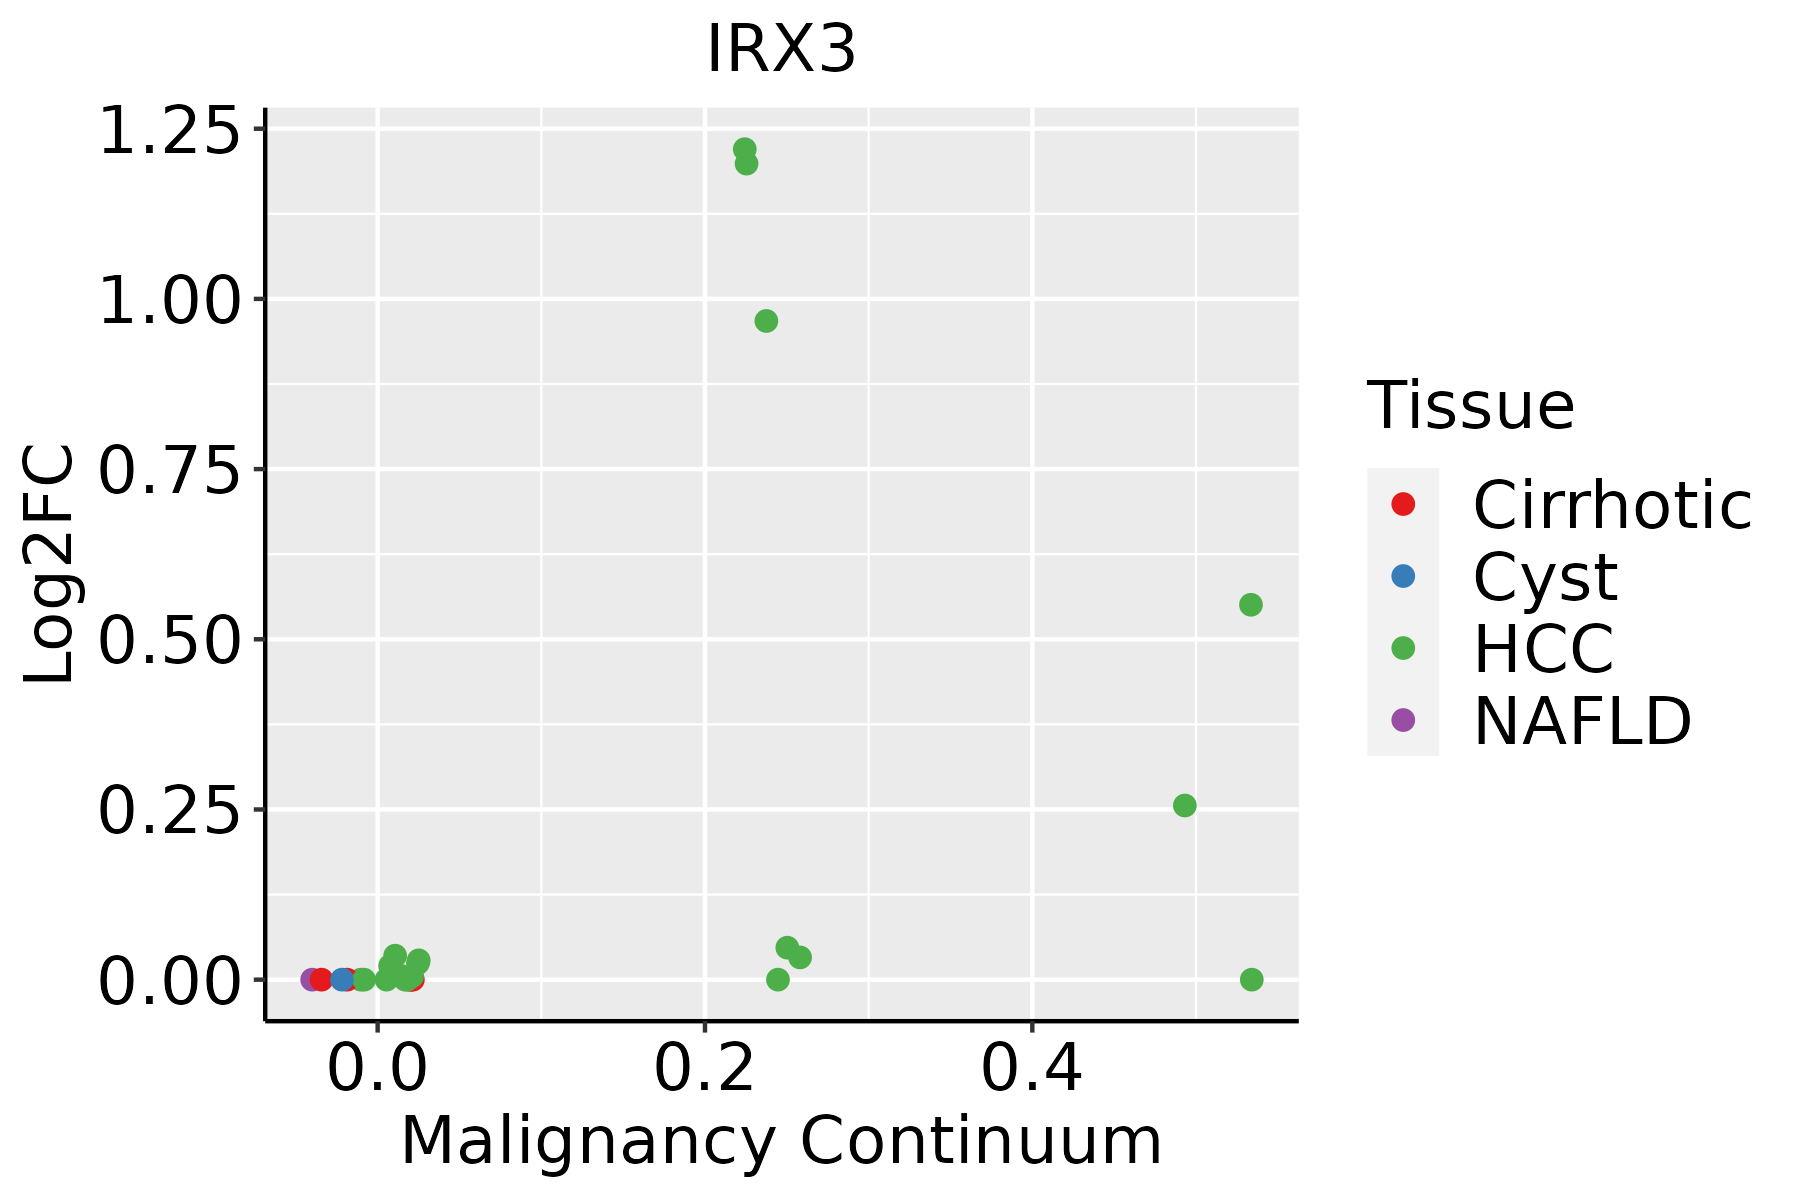 | HCC: Hepatocellular carcinoma |
| NAFLD: Non-alcoholic fatty liver disease | ||
| Oral Cavity |  | EOLP: Erosive Oral lichen planus |
| LP: leukoplakia | ||
| NEOLP: Non-erosive oral lichen planus | ||
| OSCC: Oral squamous cell carcinoma | ||
| Prostate |  | BPH: Benign Prostatic Hyperplasia |
| Skin | 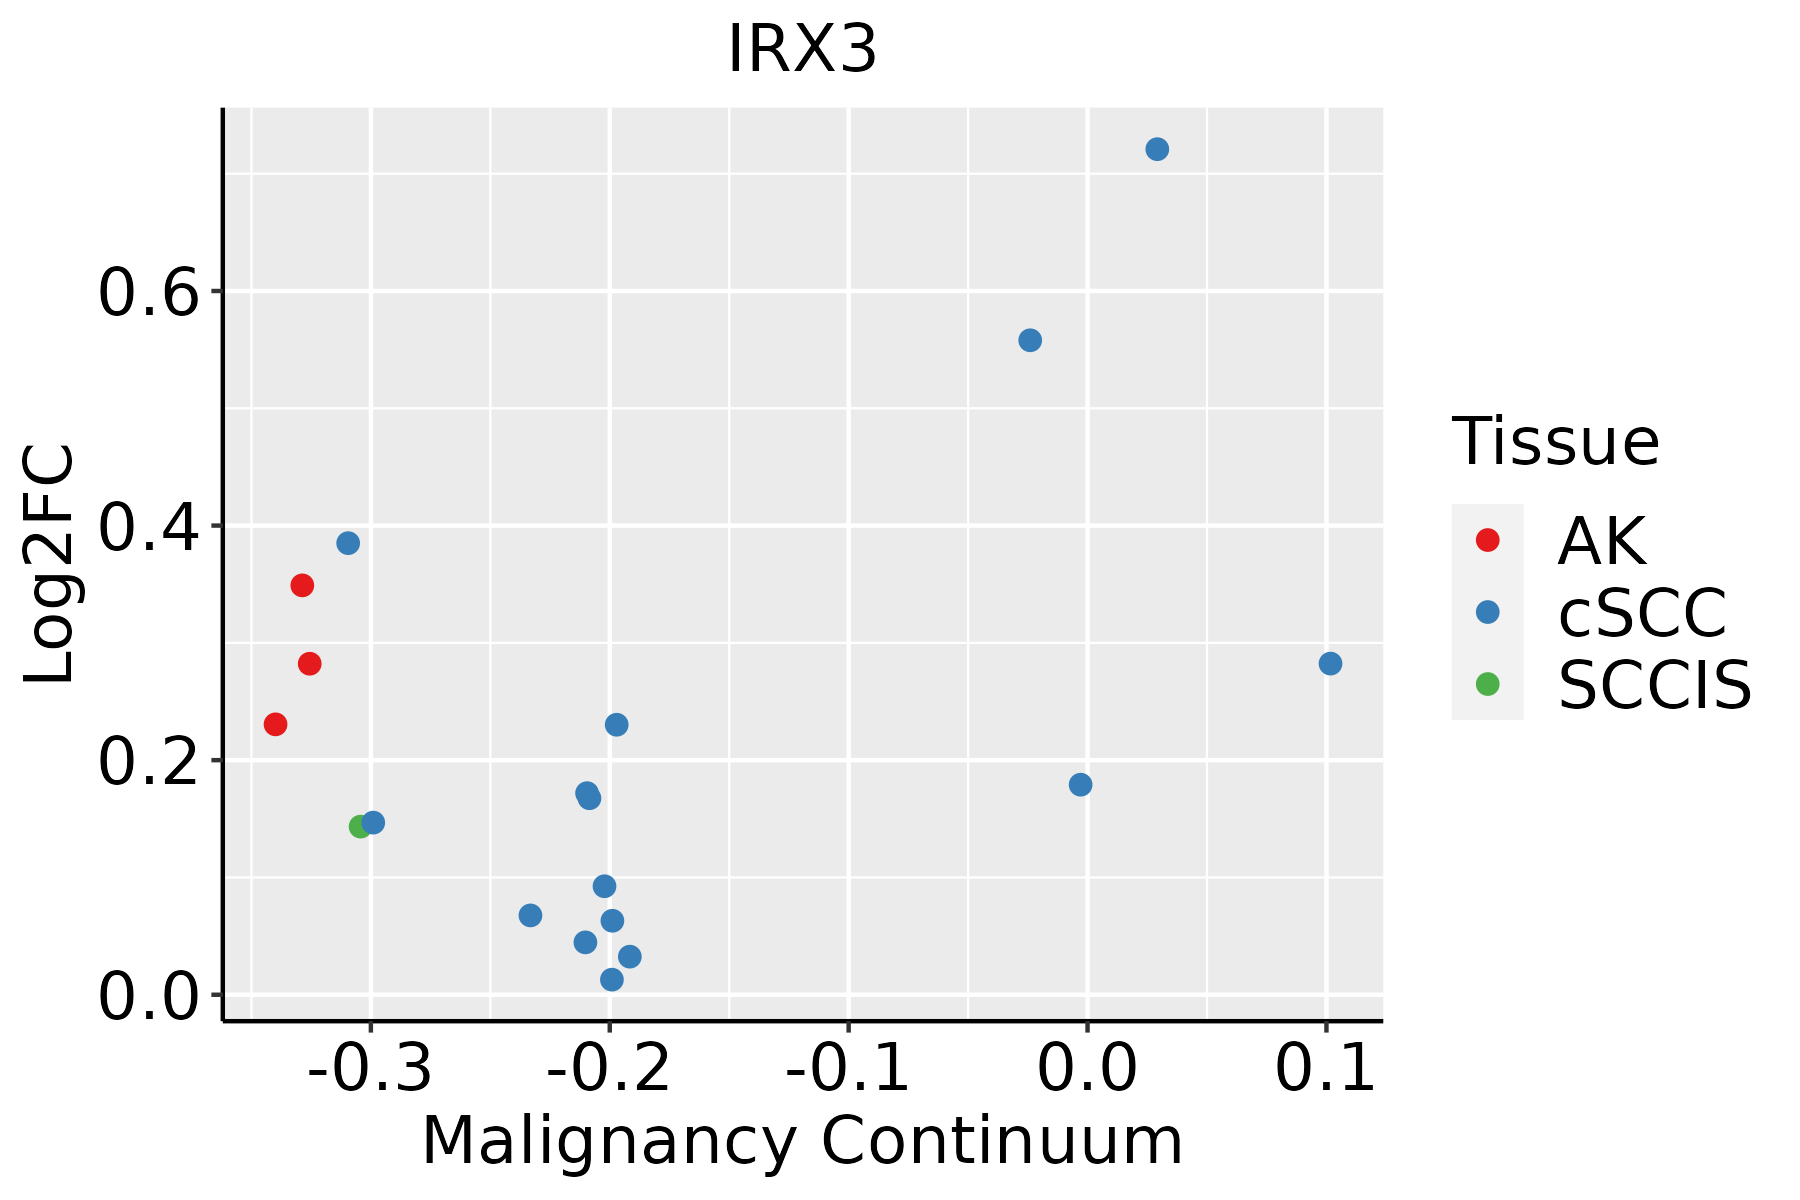 | AK: Actinic keratosis |
| cSCC: Cutaneous squamous cell carcinoma | ||
| SCCIS:squamous cell carcinoma in situ | ||
| Thyroid | 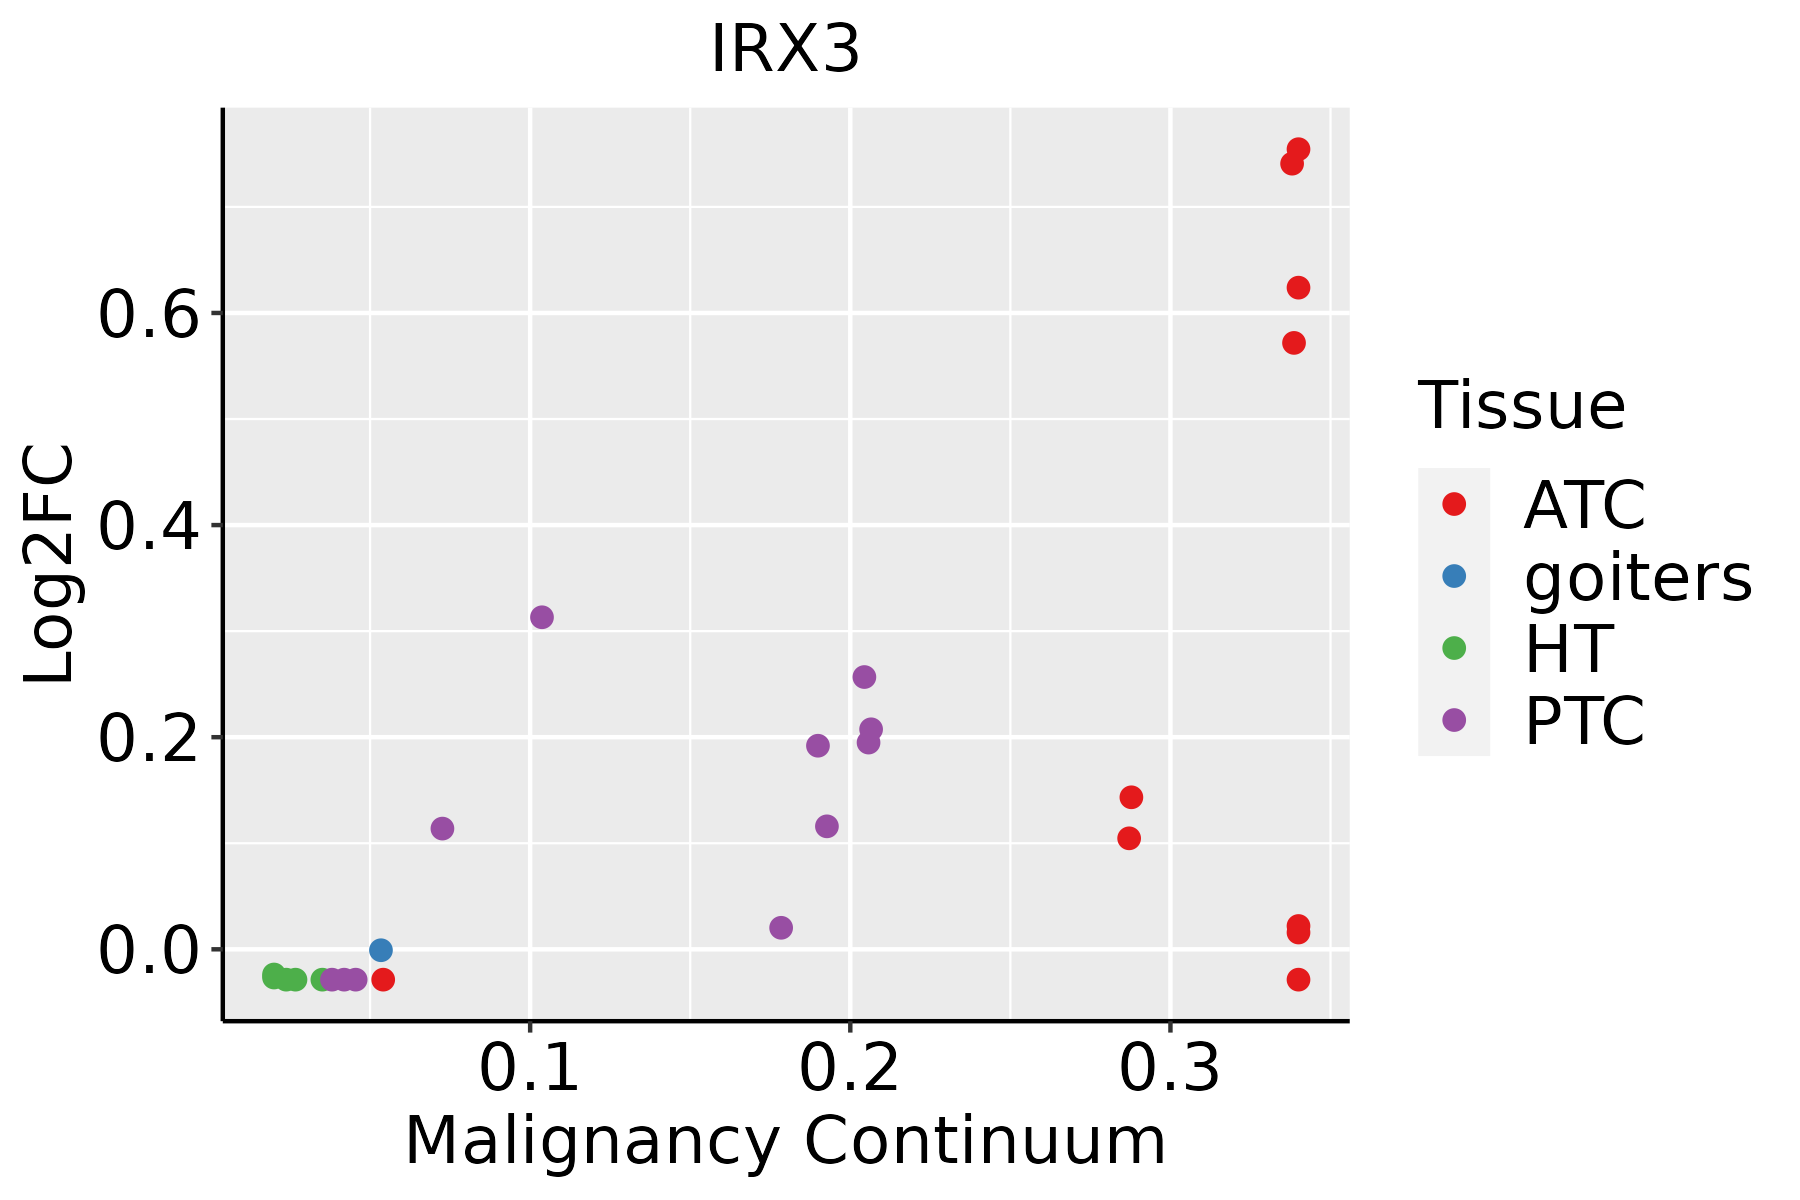 | ATC: Anaplastic thyroid cancer |
| HT: Hashimoto's thyroiditis | ||
| PTC: Papillary thyroid cancer |
| ∗log2FC in expression of this searched gene in stem-like cells from each diseased tissue sample relative to stem-like cells in normal samples in each tissue plotted against the malignancy continuum. Samples are colored based on if they are from different disease stage. |
Top |
Malignant transformation related pathway analysis |
| Find out the enriched GO biological processes and KEGG pathways involved in transition from healthy to precancer to cancer |
| Tissue | Disease Stage | Enriched GO biological Processes |
| Colorectum | AD |  |
| Colorectum | SER |  |
| Colorectum | MSS |  |
| Colorectum | MSI-H |  |
| Colorectum | FAP |  |
| ∗Top 15 enriched GO BP terms are showed in the bar plot of each disease state in each tissue. Each row represents a significant GO biological process which is colored according to the -log10(p.adjust). |
| Page: 1 2 3 4 5 6 7 8 9 |
| GO ID | Tissue | Disease Stage | Description | Gene Ratio | Bg Ratio | pvalue | p.adjust | Count |
| GO:19018445 | Breast | Precancer | regulation of cell communication by electrical coupling involved in cardiac conduction | 5/1080 | 11/18723 | 2.18e-04 | 3.35e-03 | 5 |
| GO:00860643 | Breast | Precancer | cell communication by electrical coupling involved in cardiac conduction | 7/1080 | 25/18723 | 4.00e-04 | 5.42e-03 | 7 |
| GO:00351486 | Breast | Precancer | tube formation | 19/1080 | 148/18723 | 8.79e-04 | 1.01e-02 | 19 |
| GO:00106493 | Breast | Precancer | regulation of cell communication by electrical coupling | 5/1080 | 16/18723 | 1.62e-03 | 1.64e-02 | 5 |
| GO:00106443 | Breast | Precancer | cell communication by electrical coupling | 7/1080 | 32/18723 | 1.97e-03 | 1.89e-02 | 7 |
| GO:0072079 | Breast | Precancer | nephron tubule formation | 5/1080 | 18/18723 | 2.88e-03 | 2.49e-02 | 5 |
| GO:00605374 | Breast | Precancer | muscle tissue development | 37/1080 | 403/18723 | 3.60e-03 | 2.98e-02 | 37 |
| GO:00018386 | Breast | Precancer | embryonic epithelial tube formation | 15/1080 | 121/18723 | 4.12e-03 | 3.24e-02 | 15 |
| GO:00605625 | Breast | Precancer | epithelial tube morphogenesis | 31/1080 | 325/18723 | 4.21e-03 | 3.31e-02 | 31 |
| GO:00147063 | Breast | Precancer | striated muscle tissue development | 35/1080 | 384/18723 | 5.10e-03 | 3.83e-02 | 35 |
| GO:00720735 | Breast | Precancer | kidney epithelium development | 16/1080 | 136/18723 | 5.21e-03 | 3.88e-02 | 16 |
| GO:00860654 | Breast | Precancer | cell communication involved in cardiac conduction | 9/1080 | 58/18723 | 5.67e-03 | 4.08e-02 | 9 |
| GO:00720803 | Breast | Precancer | nephron tubule development | 12/1080 | 91/18723 | 5.97e-03 | 4.22e-02 | 12 |
| GO:0072078 | Breast | Precancer | nephron tubule morphogenesis | 10/1080 | 71/18723 | 7.33e-03 | 4.88e-02 | 10 |
| GO:006056212 | Breast | IDC | epithelial tube morphogenesis | 44/1434 | 325/18723 | 1.58e-04 | 2.73e-03 | 44 |
| GO:008606511 | Breast | IDC | cell communication involved in cardiac conduction | 13/1434 | 58/18723 | 3.59e-04 | 5.18e-03 | 13 |
| GO:008606411 | Breast | IDC | cell communication by electrical coupling involved in cardiac conduction | 8/1434 | 25/18723 | 3.85e-04 | 5.40e-03 | 8 |
| GO:006053711 | Breast | IDC | muscle tissue development | 50/1434 | 403/18723 | 4.91e-04 | 6.45e-03 | 50 |
| GO:0001656 | Breast | IDC | metanephros development | 16/1434 | 85/18723 | 6.49e-04 | 8.04e-03 | 16 |
| GO:190184412 | Breast | IDC | regulation of cell communication by electrical coupling involved in cardiac conduction | 5/1434 | 11/18723 | 8.17e-04 | 9.64e-03 | 5 |
| Page: 1 2 3 4 5 6 7 8 9 10 11 12 13 |
| Pathway ID | Tissue | Disease Stage | Description | Gene Ratio | Bg Ratio | pvalue | p.adjust | qvalue | Count |
| Page: 1 |
Top |
Cell-cell communication analysis |
| Identification of potential cell-cell interactions between two cell types and their ligand-receptor pairs for different disease states |
| Ligand | Receptor | LRpair | Pathway | Tissue | Disease Stage |
| Page: 1 |
Top |
Single-cell gene regulatory network inference analysis |
| Find out the significant the regulons (TFs) and the target genes of each regulon across cell types for different disease states |
| TF | Cell Type | Tissue | Disease Stage | Target Gene | RSS | Regulon Activity |
| IRX3 | STM | Breast | Healthy | IRX5,TRPS1,NR2F6, etc. | 1.43e-01 |  |
| IRX3 | MDSC | Skin | ADJ | RHOV,TRIM29,S100A14, etc. | 2.14e-01 |  |
| IRX3 | MDSC | Skin | cSCC | RHOV,TRIM29,S100A14, etc. | 6.72e-02 |  |
| IRX3 | CD8TRM | Skin | cSCC | RHOV,TRIM29,S100A14, etc. | 1.43e-01 | |
| IRX3 | MDSC | Skin | SCCIS | RHOV,TRIM29,S100A14, etc. | 2.35e-01 |  |
| ∗The dot plots of a searched regulon are shown for all cell subpopulations in each disease state of each tissue based on the regulon specific score inferred using pySCENIC and by calculating the average expression. |
| Page: 1 |
Top |
Somatic mutation of malignant transformation related genes |
| Annotation of somatic variants for genes involved in malignant transformation |
| Hugo Symbol | Variant Class | Variant Classification | dbSNP RS | HGVSc | HGVSp | HGVSp Short | SWISSPROT | BIOTYPE | SIFT | PolyPhen | Tumor Sample Barcode | Tissue | Histology | Sex | Age | Stage | Therapy Types | Drugs | Outcome |
| IRX3 | deletion | Frame_Shift_Del | c.379delG | p.Asp127ThrfsTer16 | p.D127Tfs*16 | P78415 | protein_coding | TCGA-AN-A0FT-01 | Breast | breast invasive carcinoma | Female | <65 | I/II | Unknown | Unknown | SD | |||
| IRX3 | deletion | Frame_Shift_Del | novel | c.362_363delGC | p.Gly121AlafsTer69 | p.G121Afs*69 | P78415 | protein_coding | TCGA-OL-A5D8-01 | Breast | breast invasive carcinoma | Female | <65 | I/II | Unknown | Unknown | SD | ||
| IRX3 | SNV | Missense_Mutation | rs567541390 | c.952N>T | p.Ala318Ser | p.A318S | P78415 | protein_coding | tolerated(0.67) | benign(0.028) | TCGA-VS-A8QH-01 | Cervix | cervical & endocervical cancer | Female | >=65 | I/II | Chemotherapy | gemcitabine | PD |
| IRX3 | SNV | Missense_Mutation | rs376056612 | c.332N>T | p.Pro111Leu | p.P111L | P78415 | protein_coding | deleterious_low_confidence(0.01) | benign(0.012) | TCGA-A6-5661-01 | Colorectum | colon adenocarcinoma | Female | >=65 | I/II | Unknown | Unknown | SD |
| IRX3 | SNV | Missense_Mutation | c.818N>T | p.Ala273Val | p.A273V | P78415 | protein_coding | tolerated(0.18) | benign(0) | TCGA-AA-3492-01 | Colorectum | colon adenocarcinoma | Female | >=65 | I/II | Unknown | Unknown | SD | |
| IRX3 | SNV | Missense_Mutation | rs758083649 | c.161C>T | p.Ser54Leu | p.S54L | P78415 | protein_coding | tolerated(0.17) | probably_damaging(0.968) | TCGA-AA-3510-01 | Colorectum | colon adenocarcinoma | Male | >=65 | I/II | Unknown | Unknown | SD |
| IRX3 | SNV | Missense_Mutation | novel | c.661G>A | p.Asp221Asn | p.D221N | P78415 | protein_coding | tolerated(0.33) | benign(0.113) | TCGA-AA-3984-01 | Colorectum | colon adenocarcinoma | Female | <65 | I/II | Unknown | Unknown | SD |
| IRX3 | SNV | Missense_Mutation | c.391C>T | p.Pro131Ser | p.P131S | P78415 | protein_coding | deleterious(0.01) | possibly_damaging(0.867) | TCGA-G4-6628-01 | Colorectum | colon adenocarcinoma | Male | >=65 | I/II | Unknown | Unknown | SD | |
| IRX3 | SNV | Missense_Mutation | c.824N>A | p.Arg275His | p.R275H | P78415 | protein_coding | tolerated(0.34) | benign(0) | TCGA-AG-A002-01 | Colorectum | rectum adenocarcinoma | Male | <65 | I/II | Unknown | Unknown | SD | |
| IRX3 | SNV | Missense_Mutation | novel | c.775N>G | p.Leu259Val | p.L259V | P78415 | protein_coding | tolerated(0.32) | benign(0.028) | TCGA-F5-6814-01 | Colorectum | rectum adenocarcinoma | Male | <65 | I/II | Unknown | Unknown | SD |
| Page: 1 2 3 4 |
Top |
Related drugs of malignant transformation related genes |
| Identification of chemicals and drugs interact with genes involved in malignant transfromation |
| (DGIdb 4.0) |
| Entrez ID | Symbol | Category | Interaction Types | Drug Claim Name | Drug Name | PMIDs |
| Page: 1 |

Copyright 2023-Present -The University of Texas Health Science Center at Houston |