
|
|||||
|
 | |
| |
| |
| |
| |
| |
|
Gene: IRX2 |
Gene summary for IRX2 |
| Gene information | Species | Human | Gene symbol | IRX2 | Gene ID | 153572 |
| Gene name | iroquois homeobox 2 | |
| Gene Alias | IRXA2 | |
| Cytomap | 5p15.33 | |
| Gene Type | protein-coding | GO ID | GO:0000122 | UniProtAcc | Q9BZI1 |
Top |
Malignant transformation analysis |
| Identification of the aberrant gene expression in precancerous and cancerous lesions by comparing the gene expression of stem-like cells in diseased tissues with normal stem cells |
| Entrez ID | Symbol | Replicates | Species | Organ | Tissue | Adj P-value | Log2FC | Malignancy |
| 153572 | IRX2 | GSM4909282 | Human | Breast | IDC | 1.69e-10 | -2.78e-01 | -0.0288 |
| 153572 | IRX2 | GSM4909287 | Human | Breast | IDC | 7.13e-10 | -2.36e-01 | 0.2057 |
| 153572 | IRX2 | GSM4909299 | Human | Breast | IDC | 4.32e-10 | 4.00e-01 | 0.035 |
| 153572 | IRX2 | GSM4909308 | Human | Breast | IDC | 3.54e-17 | 5.90e-01 | 0.158 |
| 153572 | IRX2 | GSM4909311 | Human | Breast | IDC | 1.80e-05 | -1.77e-01 | 0.1534 |
| 153572 | IRX2 | GSM4909312 | Human | Breast | IDC | 6.88e-04 | -2.42e-01 | 0.1552 |
| 153572 | IRX2 | GSM4909315 | Human | Breast | IDC | 1.54e-05 | -2.63e-01 | 0.21 |
| 153572 | IRX2 | GSM4909316 | Human | Breast | IDC | 2.04e-03 | -2.84e-01 | 0.21 |
| 153572 | IRX2 | GSM4909317 | Human | Breast | IDC | 4.85e-02 | 3.21e-01 | 0.1355 |
| 153572 | IRX2 | GSM4909319 | Human | Breast | IDC | 3.07e-10 | -2.52e-01 | 0.1563 |
| 153572 | IRX2 | GSM4909320 | Human | Breast | IDC | 3.30e-04 | -2.84e-01 | 0.1575 |
| 153572 | IRX2 | GSM4909321 | Human | Breast | IDC | 7.98e-06 | -2.16e-01 | 0.1559 |
| 153572 | IRX2 | brca10 | Human | Breast | Precancer | 1.08e-08 | -2.69e-01 | -0.0029 |
| 153572 | IRX2 | NCCBC14 | Human | Breast | DCIS | 1.35e-03 | -1.76e-01 | 0.2021 |
| 153572 | IRX2 | NCCBC5 | Human | Breast | DCIS | 7.84e-07 | -2.45e-01 | 0.2046 |
| 153572 | IRX2 | P1 | Human | Breast | IDC | 2.45e-08 | -1.61e-01 | 0.1527 |
| 153572 | IRX2 | P3 | Human | Breast | IDC | 7.62e-06 | 7.15e-01 | 0.1542 |
| 153572 | IRX2 | DCIS2 | Human | Breast | DCIS | 2.55e-52 | 4.35e-01 | 0.0085 |
| 153572 | IRX2 | LZE20T | Human | Esophagus | ESCC | 1.11e-03 | -2.11e-01 | 0.0662 |
| 153572 | IRX2 | LZE24T | Human | Esophagus | ESCC | 6.55e-04 | -2.18e-01 | 0.0596 |
| Page: 1 2 3 4 5 |
| Tissue | Expression Dynamics | Abbreviation |
| Breast | 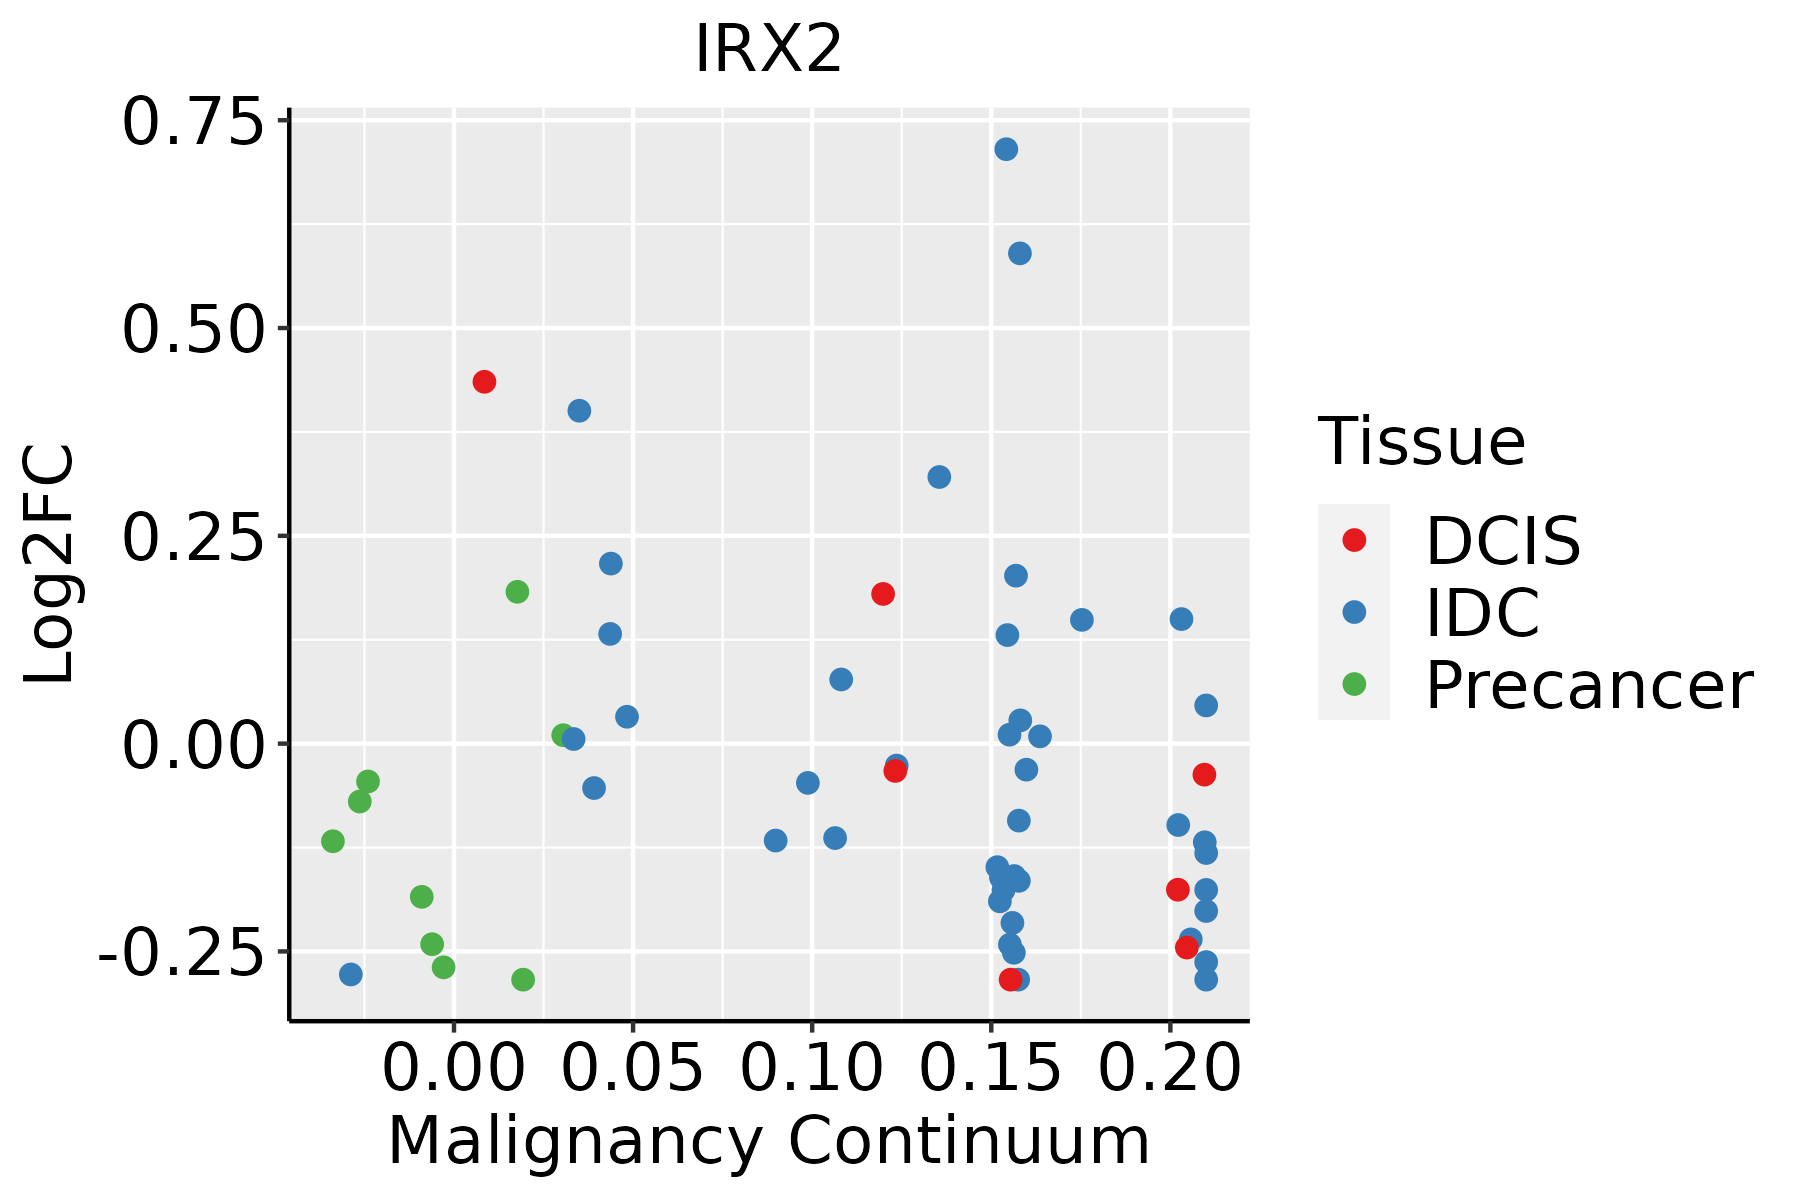 | IDC: Invasive ductal carcinoma |
| DCIS: Ductal carcinoma in situ | ||
| Precancer(BRCA1-mut): Precancerous lesion from BRCA1 mutation carriers | ||
| Esophagus |  | ESCC: Esophageal squamous cell carcinoma |
| HGIN: High-grade intraepithelial neoplasias | ||
| LGIN: Low-grade intraepithelial neoplasias | ||
| Oral Cavity | 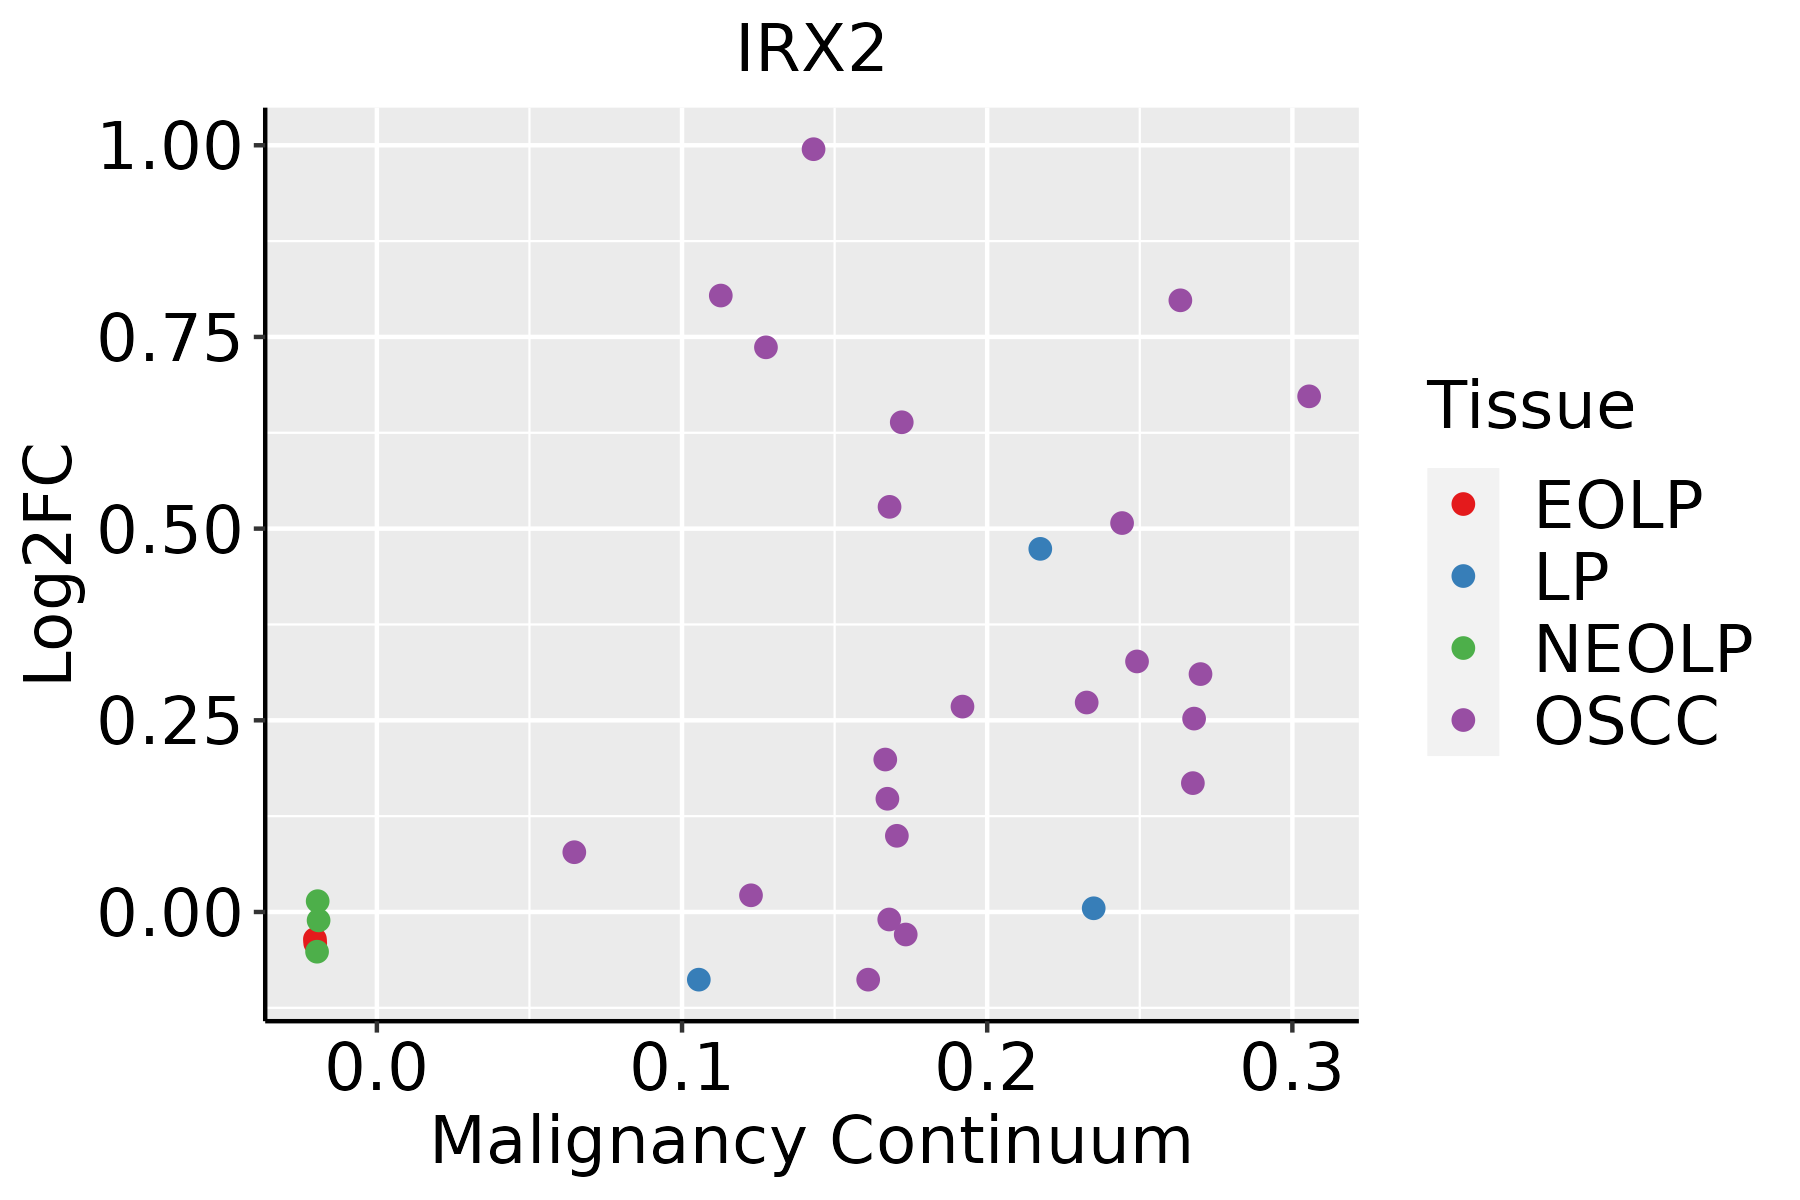 | EOLP: Erosive Oral lichen planus |
| LP: leukoplakia | ||
| NEOLP: Non-erosive oral lichen planus | ||
| OSCC: Oral squamous cell carcinoma | ||
| Prostate |  | BPH: Benign Prostatic Hyperplasia |
| Skin | 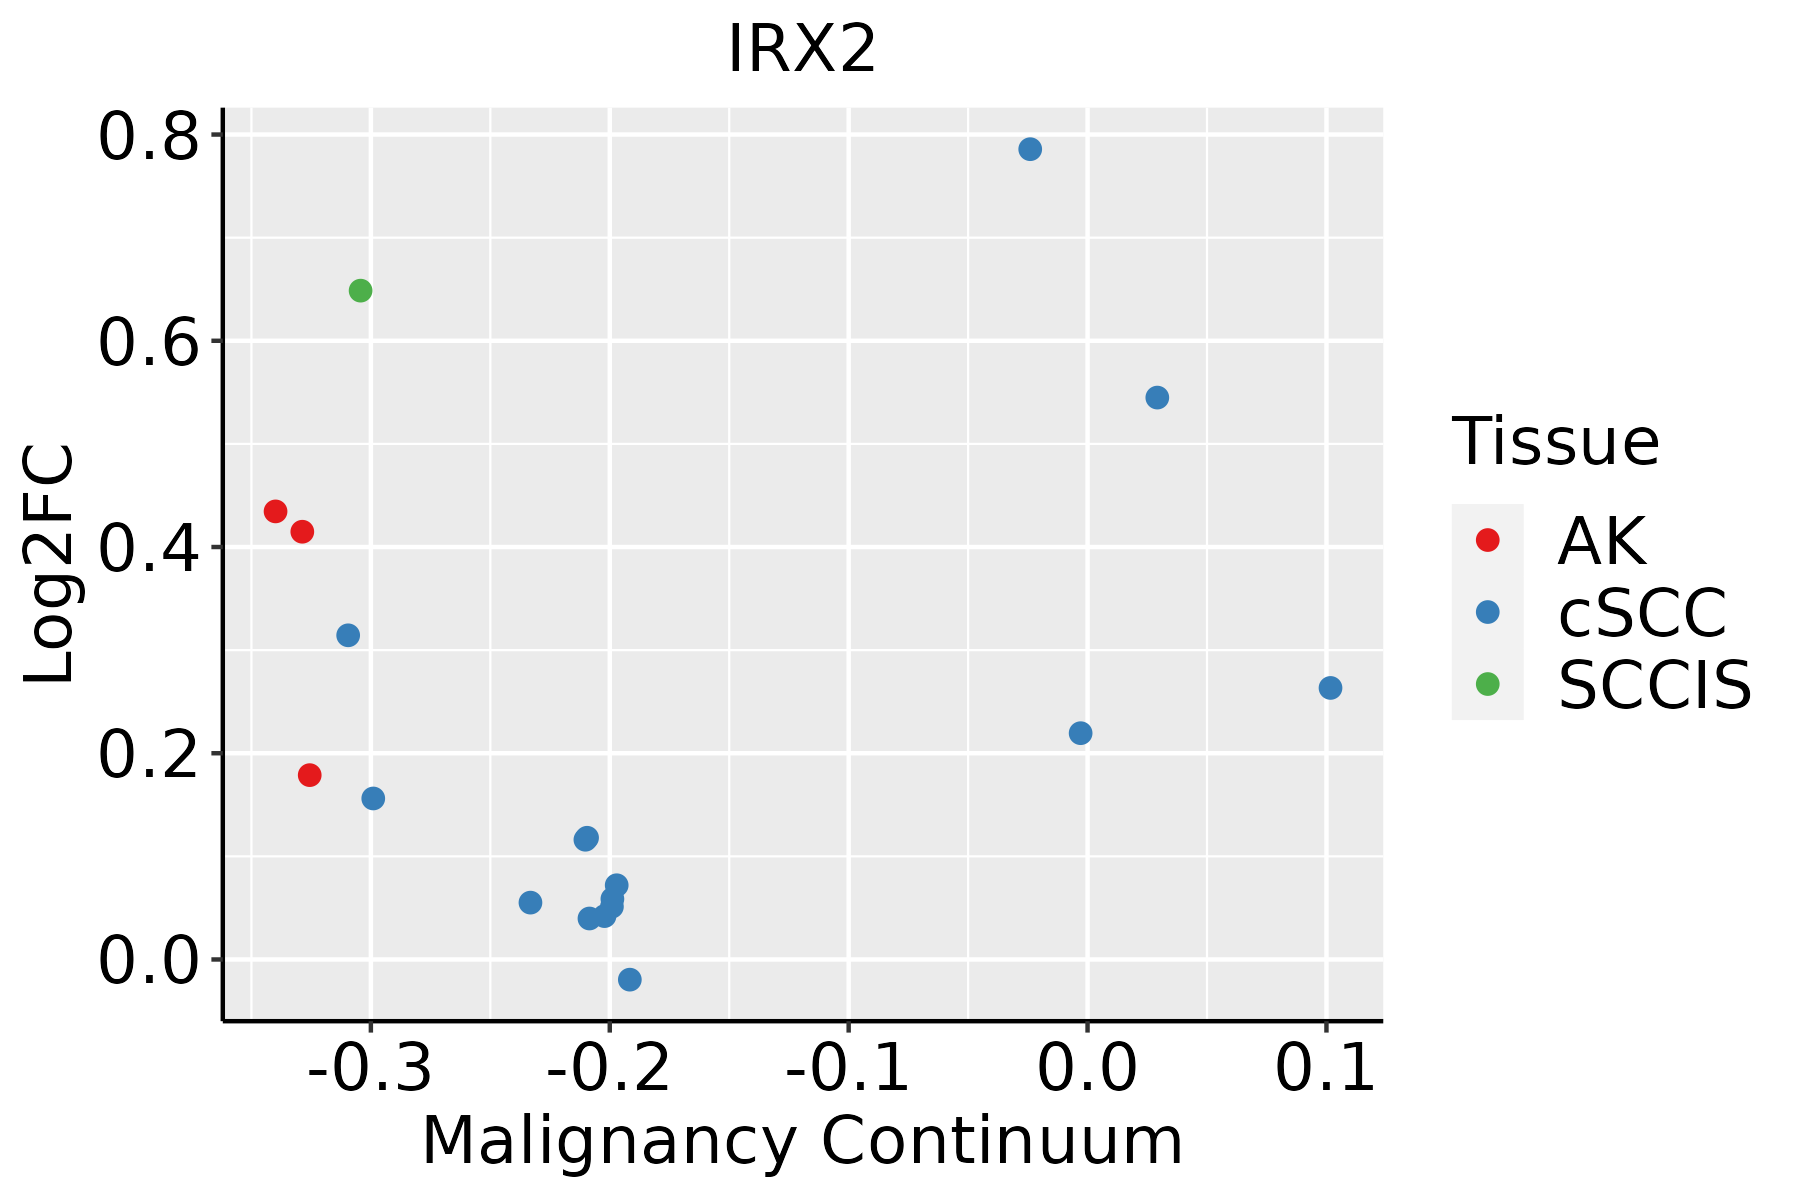 | AK: Actinic keratosis |
| cSCC: Cutaneous squamous cell carcinoma | ||
| SCCIS:squamous cell carcinoma in situ | ||
| Thyroid |  | ATC: Anaplastic thyroid cancer |
| HT: Hashimoto's thyroiditis | ||
| PTC: Papillary thyroid cancer |
| ∗log2FC in expression of this searched gene in stem-like cells from each diseased tissue sample relative to stem-like cells in normal samples in each tissue plotted against the malignancy continuum. Samples are colored based on if they are from different disease stage. |
Top |
Malignant transformation related pathway analysis |
| Find out the enriched GO biological processes and KEGG pathways involved in transition from healthy to precancer to cancer |
| Tissue | Disease Stage | Enriched GO biological Processes |
| Colorectum | AD |  |
| Colorectum | SER |  |
| Colorectum | MSS |  |
| Colorectum | MSI-H |  |
| Colorectum | FAP |  |
| ∗Top 15 enriched GO BP terms are showed in the bar plot of each disease state in each tissue. Each row represents a significant GO biological process which is colored according to the -log10(p.adjust). |
| Page: 1 2 3 4 5 6 7 8 9 |
| GO ID | Tissue | Disease Stage | Description | Gene Ratio | Bg Ratio | pvalue | p.adjust | Count |
| GO:00351486 | Breast | Precancer | tube formation | 19/1080 | 148/18723 | 8.79e-04 | 1.01e-02 | 19 |
| GO:0072079 | Breast | Precancer | nephron tubule formation | 5/1080 | 18/18723 | 2.88e-03 | 2.49e-02 | 5 |
| GO:00018386 | Breast | Precancer | embryonic epithelial tube formation | 15/1080 | 121/18723 | 4.12e-03 | 3.24e-02 | 15 |
| GO:00605625 | Breast | Precancer | epithelial tube morphogenesis | 31/1080 | 325/18723 | 4.21e-03 | 3.31e-02 | 31 |
| GO:00720735 | Breast | Precancer | kidney epithelium development | 16/1080 | 136/18723 | 5.21e-03 | 3.88e-02 | 16 |
| GO:00720803 | Breast | Precancer | nephron tubule development | 12/1080 | 91/18723 | 5.97e-03 | 4.22e-02 | 12 |
| GO:0072078 | Breast | Precancer | nephron tubule morphogenesis | 10/1080 | 71/18723 | 7.33e-03 | 4.88e-02 | 10 |
| GO:006056212 | Breast | IDC | epithelial tube morphogenesis | 44/1434 | 325/18723 | 1.58e-04 | 2.73e-03 | 44 |
| GO:0001656 | Breast | IDC | metanephros development | 16/1434 | 85/18723 | 6.49e-04 | 8.04e-03 | 16 |
| GO:003514812 | Breast | IDC | tube formation | 23/1434 | 148/18723 | 8.79e-04 | 1.02e-02 | 23 |
| GO:00720791 | Breast | IDC | nephron tubule formation | 6/1434 | 18/18723 | 1.66e-03 | 1.63e-02 | 6 |
| GO:000183812 | Breast | IDC | embryonic epithelial tube formation | 19/1434 | 121/18723 | 2.10e-03 | 1.97e-02 | 19 |
| GO:0072088 | Breast | IDC | nephron epithelium morphogenesis | 13/1434 | 73/18723 | 3.36e-03 | 2.81e-02 | 13 |
| GO:007207312 | Breast | IDC | kidney epithelium development | 20/1434 | 136/18723 | 3.58e-03 | 2.94e-02 | 20 |
| GO:007208011 | Breast | IDC | nephron tubule development | 15/1434 | 91/18723 | 3.70e-03 | 3.04e-02 | 15 |
| GO:0060993 | Breast | IDC | kidney morphogenesis | 15/1434 | 93/18723 | 4.57e-03 | 3.52e-02 | 15 |
| GO:0072028 | Breast | IDC | nephron morphogenesis | 13/1434 | 76/18723 | 4.81e-03 | 3.67e-02 | 13 |
| GO:00613262 | Breast | IDC | renal tubule development | 15/1434 | 94/18723 | 5.06e-03 | 3.79e-02 | 15 |
| GO:00721756 | Breast | IDC | epithelial tube formation | 19/1434 | 132/18723 | 5.63e-03 | 4.08e-02 | 19 |
| GO:00016555 | Breast | IDC | urogenital system development | 39/1434 | 338/18723 | 6.75e-03 | 4.68e-02 | 39 |
| Page: 1 2 3 4 5 6 7 |
| Pathway ID | Tissue | Disease Stage | Description | Gene Ratio | Bg Ratio | pvalue | p.adjust | qvalue | Count |
| Page: 1 |
Top |
Cell-cell communication analysis |
| Identification of potential cell-cell interactions between two cell types and their ligand-receptor pairs for different disease states |
| Ligand | Receptor | LRpair | Pathway | Tissue | Disease Stage |
| Page: 1 |
Top |
Single-cell gene regulatory network inference analysis |
| Find out the significant the regulons (TFs) and the target genes of each regulon across cell types for different disease states |
| TF | Cell Type | Tissue | Disease Stage | Target Gene | RSS | Regulon Activity |
| IRX2 | BAS | Prostate | BPH | C5orf38,MIR205HG,FBXL14, etc. | 2.48e-01 |  |
| IRX2 | CHIEF | Stomach | ADJ | LIPF,PGA5,TMED6, etc. | 3.93e-01 |  |
| IRX2 | CHIEF | Stomach | CAG with IM | LIPF,PGA5,TMED6, etc. | 5.03e-01 |  |
| ∗The dot plots of a searched regulon are shown for all cell subpopulations in each disease state of each tissue based on the regulon specific score inferred using pySCENIC and by calculating the average expression. |
| Page: 1 |
Top |
Somatic mutation of malignant transformation related genes |
| Annotation of somatic variants for genes involved in malignant transformation |
| Hugo Symbol | Variant Class | Variant Classification | dbSNP RS | HGVSc | HGVSp | HGVSp Short | SWISSPROT | BIOTYPE | SIFT | PolyPhen | Tumor Sample Barcode | Tissue | Histology | Sex | Age | Stage | Therapy Types | Drugs | Outcome |
| IRX2 | SNV | Missense_Mutation | rs575915597 | c.1070C>T | p.Ala357Val | p.A357V | Q9BZI1 | protein_coding | tolerated(0.23) | benign(0.202) | TCGA-3C-AALK-01 | Breast | breast invasive carcinoma | Female | <65 | I/II | Chemotherapy | docetaxel | SD |
| IRX2 | insertion | Frame_Shift_Ins | novel | c.287_288insGCTTCATTACAGAATTGAGC | p.Ala97LeufsTer61 | p.A97Lfs*61 | Q9BZI1 | protein_coding | TCGA-A8-A0AB-01 | Breast | breast invasive carcinoma | Female | <65 | I/II | Chemotherapy | 5-fluorouracil | CR | ||
| IRX2 | SNV | Missense_Mutation | rs531740600 | c.793N>A | p.Asp265Asn | p.D265N | Q9BZI1 | protein_coding | tolerated(0.2) | benign(0.105) | TCGA-C5-A1BJ-01 | Cervix | cervical & endocervical cancer | Female | <65 | I/II | Unknown | Unknown | SD |
| IRX2 | SNV | Missense_Mutation | c.1108T>G | p.Ser370Ala | p.S370A | Q9BZI1 | protein_coding | tolerated(0.55) | benign(0.003) | TCGA-DS-A1OD-01 | Cervix | cervical & endocervical cancer | Female | <65 | I/II | Chemotherapy | cisplatin | SD | |
| IRX2 | insertion | Frame_Shift_Ins | novel | c.1105_1106insCGGGT | p.Gly369AlafsTer32 | p.G369Afs*32 | Q9BZI1 | protein_coding | TCGA-DS-A1OD-01 | Cervix | cervical & endocervical cancer | Female | <65 | I/II | Chemotherapy | cisplatin | SD | ||
| IRX2 | SNV | Missense_Mutation | c.496N>A | p.Ala166Thr | p.A166T | Q9BZI1 | protein_coding | deleterious(0) | probably_damaging(0.997) | TCGA-A6-2686-01 | Colorectum | colon adenocarcinoma | Female | >=65 | I/II | Unknown | Unknown | SD | |
| IRX2 | SNV | Missense_Mutation | novel | c.253G>A | p.Ala85Thr | p.A85T | Q9BZI1 | protein_coding | deleterious(0.02) | benign(0.022) | TCGA-AA-3845-01 | Colorectum | colon adenocarcinoma | Female | >=65 | I/II | Unknown | Unknown | PD |
| IRX2 | SNV | Missense_Mutation | novel | c.1246N>A | p.Ala416Thr | p.A416T | Q9BZI1 | protein_coding | tolerated_low_confidence(0.08) | benign(0) | TCGA-AA-3947-01 | Colorectum | colon adenocarcinoma | Female | <65 | I/II | Unknown | Unknown | SD |
| IRX2 | SNV | Missense_Mutation | novel | c.583N>C | p.Asp195His | p.D195H | Q9BZI1 | protein_coding | deleterious(0.01) | possibly_damaging(0.769) | TCGA-AA-3956-01 | Colorectum | colon adenocarcinoma | Male | >=65 | I/II | Unknown | Unknown | SD |
| IRX2 | SNV | Missense_Mutation | c.305C>T | p.Pro102Leu | p.P102L | Q9BZI1 | protein_coding | deleterious(0) | probably_damaging(0.997) | TCGA-AD-6899-01 | Colorectum | colon adenocarcinoma | Male | >=65 | III/IV | Unknown | Unknown | SD |
| Page: 1 2 3 4 5 6 7 |
Top |
Related drugs of malignant transformation related genes |
| Identification of chemicals and drugs interact with genes involved in malignant transfromation |
| (DGIdb 4.0) |
| Entrez ID | Symbol | Category | Interaction Types | Drug Claim Name | Drug Name | PMIDs |
| Page: 1 |

Copyright 2023-Present -The University of Texas Health Science Center at Houston |