
|
|||||
|
 | |
| |
| |
| |
| |
| |
|
Gene: IRF8 |
Gene summary for IRF8 |
| Gene information | Species | Human | Gene symbol | IRF8 | Gene ID | 3394 |
| Gene name | interferon regulatory factor 8 | |
| Gene Alias | H-ICSBP | |
| Cytomap | 16q24.1 | |
| Gene Type | protein-coding | GO ID | GO:0000122 | UniProtAcc | Q02556 |
Top |
Malignant transformation analysis |
| Identification of the aberrant gene expression in precancerous and cancerous lesions by comparing the gene expression of stem-like cells in diseased tissues with normal stem cells |
| Entrez ID | Symbol | Replicates | Species | Organ | Tissue | Adj P-value | Log2FC | Malignancy |
| 3394 | IRF8 | HCC1_Meng | Human | Liver | HCC | 1.75e-02 | -6.03e-02 | 0.0246 |
| 3394 | IRF8 | HCC2_Meng | Human | Liver | HCC | 1.01e-07 | 6.59e-02 | 0.0107 |
| 3394 | IRF8 | S028 | Human | Liver | HCC | 3.19e-04 | 5.48e-01 | 0.2503 |
| 3394 | IRF8 | S029 | Human | Liver | HCC | 3.47e-03 | 5.07e-01 | 0.2581 |
| Page: 1 |
| Tissue | Expression Dynamics | Abbreviation |
| Liver | 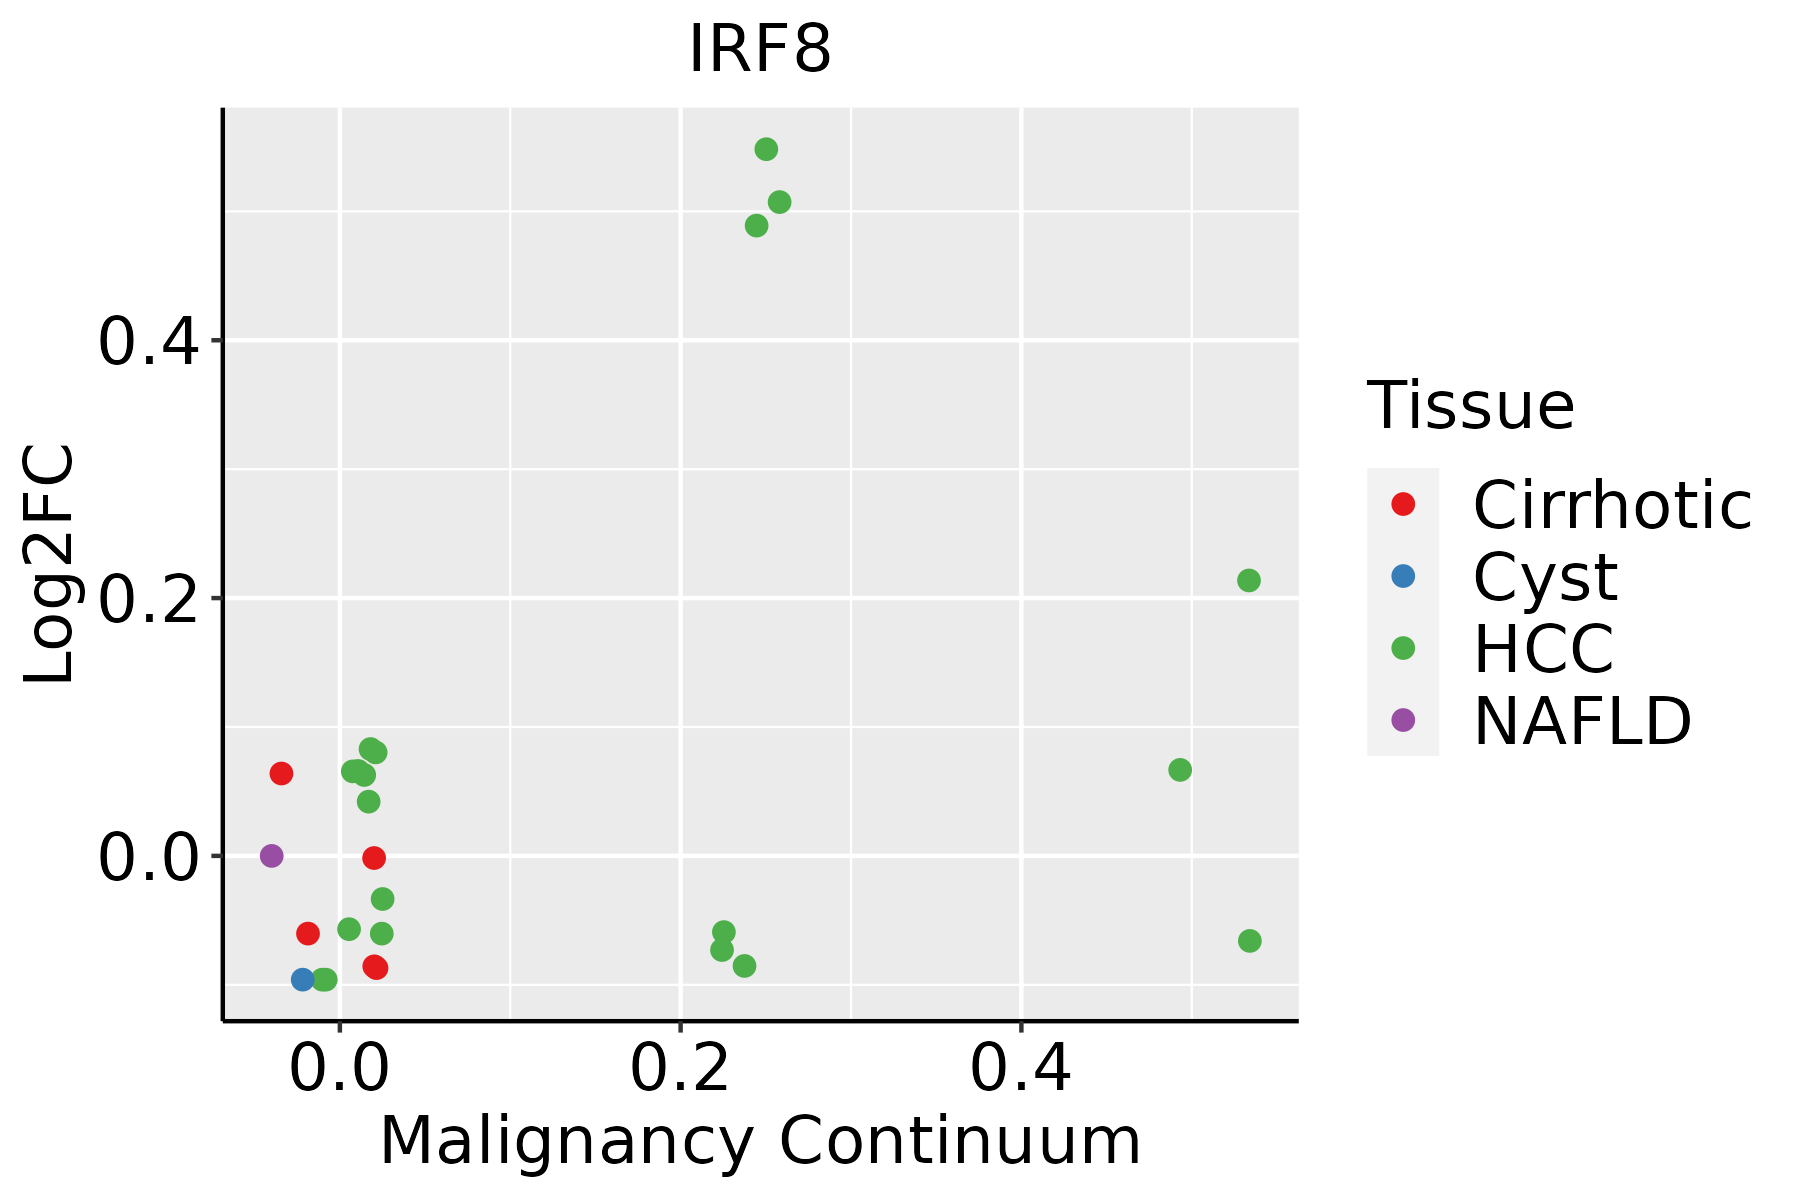 | HCC: Hepatocellular carcinoma |
| NAFLD: Non-alcoholic fatty liver disease |
| ∗log2FC in expression of this searched gene in stem-like cells from each diseased tissue sample relative to stem-like cells in normal samples in each tissue plotted against the malignancy continuum. Samples are colored based on if they are from different disease stage. |
Top |
Malignant transformation related pathway analysis |
| Find out the enriched GO biological processes and KEGG pathways involved in transition from healthy to precancer to cancer |
| Tissue | Disease Stage | Enriched GO biological Processes |
| Colorectum | AD |  |
| Colorectum | SER |  |
| Colorectum | MSS |  |
| Colorectum | MSI-H |  |
| Colorectum | FAP |  |
| ∗Top 15 enriched GO BP terms are showed in the bar plot of each disease state in each tissue. Each row represents a significant GO biological process which is colored according to the -log10(p.adjust). |
| Page: 1 2 3 4 5 6 7 8 9 |
| GO ID | Tissue | Disease Stage | Description | Gene Ratio | Bg Ratio | pvalue | p.adjust | Count |
| GO:0032479 | Liver | HCC | regulation of type I interferon production | 60/7958 | 95/18723 | 3.84e-05 | 3.80e-04 | 60 |
| GO:0032606 | Liver | HCC | type I interferon production | 60/7958 | 95/18723 | 3.84e-05 | 3.80e-04 | 60 |
| GO:003009922 | Liver | HCC | myeloid cell differentiation | 200/7958 | 381/18723 | 4.64e-05 | 4.49e-04 | 200 |
| GO:00343411 | Liver | HCC | response to interferon-gamma | 82/7958 | 141/18723 | 1.25e-04 | 1.03e-03 | 82 |
| GO:00713461 | Liver | HCC | cellular response to interferon-gamma | 70/7958 | 118/18723 | 1.66e-04 | 1.32e-03 | 70 |
| GO:003249611 | Liver | HCC | response to lipopolysaccharide | 174/7958 | 343/18723 | 1.19e-03 | 6.62e-03 | 174 |
| GO:00712166 | Liver | HCC | cellular response to biotic stimulus | 128/7958 | 246/18723 | 1.53e-03 | 8.10e-03 | 128 |
| GO:00712226 | Liver | HCC | cellular response to lipopolysaccharide | 110/7958 | 209/18723 | 1.92e-03 | 9.77e-03 | 110 |
| GO:000223711 | Liver | HCC | response to molecule of bacterial origin | 181/7958 | 363/18723 | 2.58e-03 | 1.24e-02 | 181 |
| GO:00712196 | Liver | HCC | cellular response to molecule of bacterial origin | 113/7958 | 221/18723 | 5.73e-03 | 2.38e-02 | 113 |
| Page: 1 |
| Pathway ID | Tissue | Disease Stage | Description | Gene Ratio | Bg Ratio | pvalue | p.adjust | qvalue | Count |
| hsa051332 | Liver | HCC | Pertussis | 48/4020 | 76/8465 | 4.17e-03 | 1.27e-02 | 7.06e-03 | 48 |
| hsa051333 | Liver | HCC | Pertussis | 48/4020 | 76/8465 | 4.17e-03 | 1.27e-02 | 7.06e-03 | 48 |
| Page: 1 |
Top |
Cell-cell communication analysis |
| Identification of potential cell-cell interactions between two cell types and their ligand-receptor pairs for different disease states |
| Ligand | Receptor | LRpair | Pathway | Tissue | Disease Stage |
| Page: 1 |
Top |
Single-cell gene regulatory network inference analysis |
| Find out the significant the regulons (TFs) and the target genes of each regulon across cell types for different disease states |
| TF | Cell Type | Tissue | Disease Stage | Target Gene | RSS | Regulon Activity |
| IRF8 | FIB | Breast | DCIS | TAF9,VAMP8,CYBA, etc. | 7.47e-01 |  |
| IRF8 | MES | Cervix | ADJ | IRF7,PPT1,CPVL, etc. | 6.27e-01 |  |
| IRF8 | NEUT | Esophagus | Healthy | HOXB5,EAF2,ZNF410, etc. | 7.32e-01 |  |
| IRF8 | AT2L | Lung | AIS | IRF4,GPR183,GRASP, etc. | 6.53e-01 |  |
| IRF8 | MDSC | Lung | Healthy | TNFAIP8,ID2,CD1C, etc. | 8.71e-01 |  |
| IRF8 | MSC.MVA | Lung | ADJ | HLA-DRB5,FMN1,KCNE1, etc. | 2.47e-01 |  |
| IRF8 | MSC.ADIPO | Lung | IAC | HLA-DRB5,FMN1,KCNE1, etc. | 3.75e-01 |  |
| IRF8 | MSC.MVA | Lung | IAC | HLA-DRB5,FMN1,KCNE1, etc. | 2.63e-01 | |
| IRF8 | MSC.MVA | Lung | MIAC | HLA-DRB5,FMN1,KCNE1, etc. | 4.80e-01 |  |
| IRF8 | CHIEF | Stomach | CAG with IM | GBP4,MS4A1,HLA-DQA1, etc. | 4.99e-01 |  |
| ∗The dot plots of a searched regulon are shown for all cell subpopulations in each disease state of each tissue based on the regulon specific score inferred using pySCENIC and by calculating the average expression. |
| Page: 1 2 |
Top |
Somatic mutation of malignant transformation related genes |
| Annotation of somatic variants for genes involved in malignant transformation |
| Hugo Symbol | Variant Class | Variant Classification | dbSNP RS | HGVSc | HGVSp | HGVSp Short | SWISSPROT | BIOTYPE | SIFT | PolyPhen | Tumor Sample Barcode | Tissue | Histology | Sex | Age | Stage | Therapy Types | Drugs | Outcome |
| IRF8 | SNV | Missense_Mutation | novel | c.164N>A | p.Ser55Tyr | p.S55Y | Q02556 | protein_coding | deleterious(0) | probably_damaging(0.95) | TCGA-BH-A0B6-01 | Breast | breast invasive carcinoma | Female | <65 | I/II | Unknown | Unknown | SD |
| IRF8 | insertion | Frame_Shift_Ins | novel | c.91_92insTTGGCTCTAAGTCGAT | p.Glu31ValfsTer24 | p.E31Vfs*24 | Q02556 | protein_coding | TCGA-A8-A06X-01 | Breast | breast invasive carcinoma | Female | >=65 | I/II | Unknown | Unknown | SD | ||
| IRF8 | SNV | Missense_Mutation | novel | c.524C>T | p.Pro175Leu | p.P175L | Q02556 | protein_coding | tolerated(0.15) | benign(0.007) | TCGA-C5-A1M6-01 | Cervix | cervical & endocervical cancer | Female | <65 | I/II | Chemotherapy | cisplatin | PD |
| IRF8 | SNV | Missense_Mutation | c.917G>A | p.Cys306Tyr | p.C306Y | Q02556 | protein_coding | tolerated(1) | benign(0.001) | TCGA-AD-6895-01 | Colorectum | colon adenocarcinoma | Male | >=65 | III/IV | Unknown | Unknown | SD | |
| IRF8 | SNV | Missense_Mutation | rs140514602 | c.569C>T | p.Thr190Met | p.T190M | Q02556 | protein_coding | tolerated(0.2) | benign(0.003) | TCGA-AD-A5EJ-01 | Colorectum | colon adenocarcinoma | Female | >=65 | I/II | Unknown | Unknown | SD |
| IRF8 | SNV | Missense_Mutation | c.781N>A | p.Glu261Lys | p.E261K | Q02556 | protein_coding | tolerated(0.08) | benign(0.329) | TCGA-CM-6674-01 | Colorectum | colon adenocarcinoma | Male | <65 | I/II | Unknown | Unknown | SD | |
| IRF8 | SNV | Missense_Mutation | rs765523642 | c.1018N>T | p.Arg340Trp | p.R340W | Q02556 | protein_coding | deleterious(0.03) | possibly_damaging(0.892) | TCGA-CL-5917-01 | Colorectum | rectum adenocarcinoma | Female | >=65 | III/IV | Unknown | Unknown | SD |
| IRF8 | SNV | Missense_Mutation | novel | c.271N>T | p.Asp91Tyr | p.D91Y | Q02556 | protein_coding | deleterious(0) | probably_damaging(0.985) | TCGA-A5-A0G2-01 | Endometrium | uterine corpus endometrioid carcinoma | Female | <65 | III/IV | Unknown | Unknown | SD |
| IRF8 | SNV | Missense_Mutation | rs775730870 | c.766N>A | p.Asp256Asn | p.D256N | Q02556 | protein_coding | deleterious(0.04) | benign(0.16) | TCGA-A5-A0G2-01 | Endometrium | uterine corpus endometrioid carcinoma | Female | <65 | III/IV | Unknown | Unknown | SD |
| IRF8 | SNV | Missense_Mutation | novel | c.887N>A | p.Arg296His | p.R296H | Q02556 | protein_coding | deleterious(0) | probably_damaging(0.994) | TCGA-A5-A0G2-01 | Endometrium | uterine corpus endometrioid carcinoma | Female | <65 | III/IV | Unknown | Unknown | SD |
| Page: 1 2 3 4 5 6 7 |
Top |
Related drugs of malignant transformation related genes |
| Identification of chemicals and drugs interact with genes involved in malignant transfromation |
| (DGIdb 4.0) |
| Entrez ID | Symbol | Category | Interaction Types | Drug Claim Name | Drug Name | PMIDs |
| Page: 1 |

Copyright 2023-Present -The University of Texas Health Science Center at Houston |