
|
|||||
|
 | |
| |
| |
| |
| |
| |
|
Gene: IRF7 |
Gene summary for IRF7 |
| Gene information | Species | Human | Gene symbol | IRF7 | Gene ID | 3665 |
| Gene name | interferon regulatory factor 7 | |
| Gene Alias | IMD39 | |
| Cytomap | 11p15.5 | |
| Gene Type | protein-coding | GO ID | GO:0000122 | UniProtAcc | Q92985 |
Top |
Malignant transformation analysis |
| Identification of the aberrant gene expression in precancerous and cancerous lesions by comparing the gene expression of stem-like cells in diseased tissues with normal stem cells |
| Entrez ID | Symbol | Replicates | Species | Organ | Tissue | Adj P-value | Log2FC | Malignancy |
| 3665 | IRF7 | LZE8T | Human | Esophagus | ESCC | 5.59e-09 | 3.05e-01 | 0.067 |
| 3665 | IRF7 | LZE20T | Human | Esophagus | ESCC | 1.11e-10 | 4.42e-01 | 0.0662 |
| 3665 | IRF7 | LZE22T | Human | Esophagus | ESCC | 8.25e-06 | 4.98e-01 | 0.068 |
| 3665 | IRF7 | LZE6T | Human | Esophagus | ESCC | 2.22e-07 | 2.45e-01 | 0.0845 |
| 3665 | IRF7 | P1T-E | Human | Esophagus | ESCC | 8.06e-12 | 5.04e-01 | 0.0875 |
| 3665 | IRF7 | P2T-E | Human | Esophagus | ESCC | 9.51e-33 | 6.46e-01 | 0.1177 |
| 3665 | IRF7 | P5T-E | Human | Esophagus | ESCC | 4.89e-17 | 3.67e-01 | 0.1327 |
| 3665 | IRF7 | P8T-E | Human | Esophagus | ESCC | 1.72e-12 | 2.74e-01 | 0.0889 |
| 3665 | IRF7 | P9T-E | Human | Esophagus | ESCC | 7.68e-30 | 9.56e-01 | 0.1131 |
| 3665 | IRF7 | P10T-E | Human | Esophagus | ESCC | 1.24e-11 | 1.90e-01 | 0.116 |
| 3665 | IRF7 | P11T-E | Human | Esophagus | ESCC | 2.70e-35 | 1.92e+00 | 0.1426 |
| 3665 | IRF7 | P12T-E | Human | Esophagus | ESCC | 8.00e-14 | 3.30e-01 | 0.1122 |
| 3665 | IRF7 | P15T-E | Human | Esophagus | ESCC | 2.29e-09 | 2.91e-01 | 0.1149 |
| 3665 | IRF7 | P16T-E | Human | Esophagus | ESCC | 3.90e-14 | 1.96e-01 | 0.1153 |
| 3665 | IRF7 | P19T-E | Human | Esophagus | ESCC | 2.63e-11 | 6.11e-01 | 0.1662 |
| 3665 | IRF7 | P20T-E | Human | Esophagus | ESCC | 5.19e-30 | 1.06e+00 | 0.1124 |
| 3665 | IRF7 | P21T-E | Human | Esophagus | ESCC | 4.71e-03 | 2.72e-01 | 0.1617 |
| 3665 | IRF7 | P23T-E | Human | Esophagus | ESCC | 1.23e-31 | 9.11e-01 | 0.108 |
| 3665 | IRF7 | P24T-E | Human | Esophagus | ESCC | 2.52e-27 | 7.42e-01 | 0.1287 |
| 3665 | IRF7 | P28T-E | Human | Esophagus | ESCC | 2.58e-47 | 1.10e+00 | 0.1149 |
| Page: 1 2 3 4 5 |
| Tissue | Expression Dynamics | Abbreviation |
| Esophagus |  | ESCC: Esophageal squamous cell carcinoma |
| HGIN: High-grade intraepithelial neoplasias | ||
| LGIN: Low-grade intraepithelial neoplasias | ||
| Liver |  | HCC: Hepatocellular carcinoma |
| NAFLD: Non-alcoholic fatty liver disease | ||
| Oral Cavity |  | EOLP: Erosive Oral lichen planus |
| LP: leukoplakia | ||
| NEOLP: Non-erosive oral lichen planus | ||
| OSCC: Oral squamous cell carcinoma | ||
| Skin |  | AK: Actinic keratosis |
| cSCC: Cutaneous squamous cell carcinoma | ||
| SCCIS:squamous cell carcinoma in situ | ||
| Thyroid | 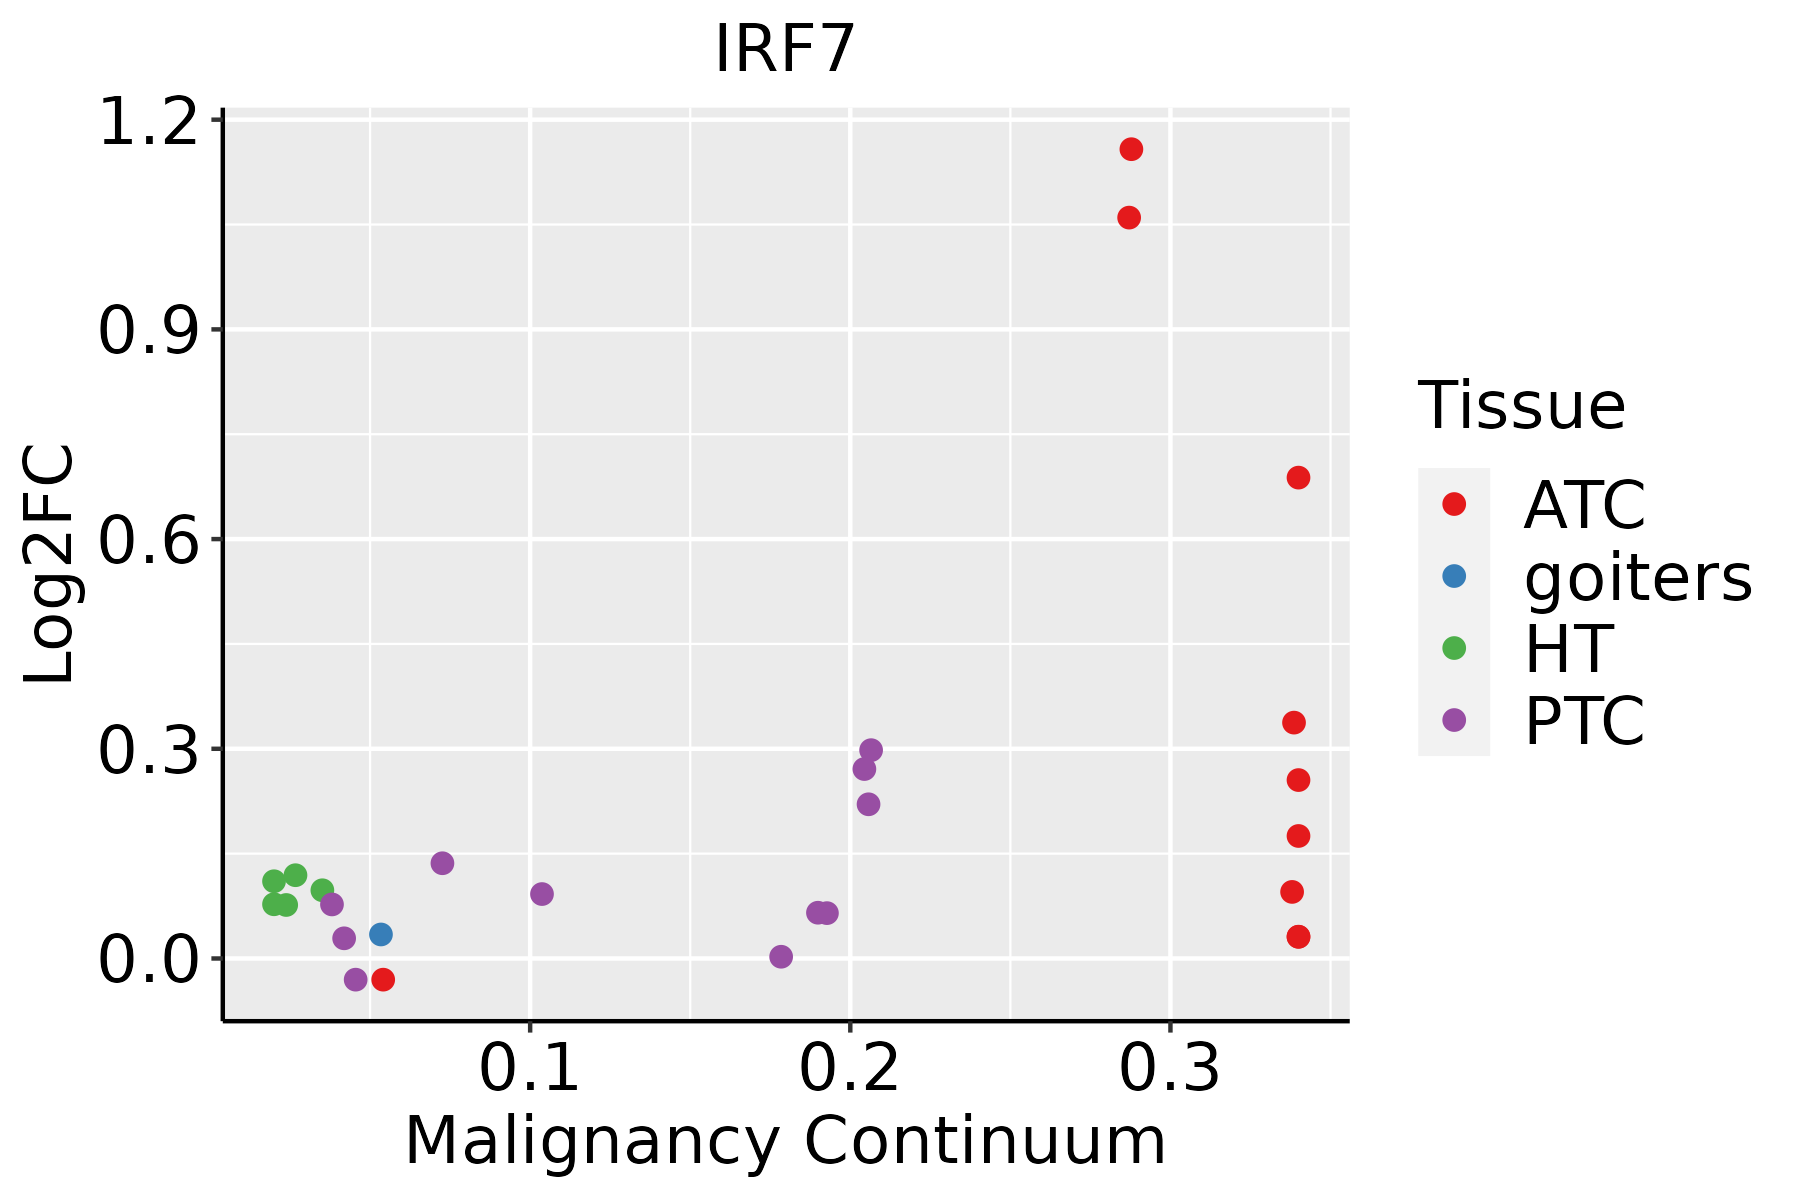 | ATC: Anaplastic thyroid cancer |
| HT: Hashimoto's thyroiditis | ||
| PTC: Papillary thyroid cancer |
| ∗log2FC in expression of this searched gene in stem-like cells from each diseased tissue sample relative to stem-like cells in normal samples in each tissue plotted against the malignancy continuum. Samples are colored based on if they are from different disease stage. |
Top |
Malignant transformation related pathway analysis |
| Find out the enriched GO biological processes and KEGG pathways involved in transition from healthy to precancer to cancer |
| Tissue | Disease Stage | Enriched GO biological Processes |
| Colorectum | AD |  |
| Colorectum | SER |  |
| Colorectum | MSS |  |
| Colorectum | MSI-H |  |
| Colorectum | FAP |  |
| ∗Top 15 enriched GO BP terms are showed in the bar plot of each disease state in each tissue. Each row represents a significant GO biological process which is colored according to the -log10(p.adjust). |
| Page: 1 2 3 4 5 6 7 8 9 |
| GO ID | Tissue | Disease Stage | Description | Gene Ratio | Bg Ratio | pvalue | p.adjust | Count |
| GO:0016032111 | Esophagus | ESCC | viral process | 301/8552 | 415/18723 | 3.34e-29 | 1.32e-26 | 301 |
| GO:000961518 | Esophagus | ESCC | response to virus | 238/8552 | 367/18723 | 6.65e-14 | 3.32e-12 | 238 |
| GO:00516075 | Esophagus | ESCC | defense response to virus | 171/8552 | 265/18723 | 3.91e-10 | 1.05e-08 | 171 |
| GO:01405465 | Esophagus | ESCC | defense response to symbiont | 171/8552 | 265/18723 | 3.91e-10 | 1.05e-08 | 171 |
| GO:0030522110 | Esophagus | ESCC | intracellular receptor signaling pathway | 170/8552 | 265/18723 | 8.58e-10 | 2.09e-08 | 170 |
| GO:0030099111 | Esophagus | ESCC | myeloid cell differentiation | 232/8552 | 381/18723 | 1.22e-09 | 2.90e-08 | 232 |
| GO:003434013 | Esophagus | ESCC | response to type I interferon | 48/8552 | 58/18723 | 6.18e-09 | 1.26e-07 | 48 |
| GO:00603375 | Esophagus | ESCC | type I interferon signaling pathway | 41/8552 | 50/18723 | 1.35e-07 | 2.17e-06 | 41 |
| GO:00713575 | Esophagus | ESCC | cellular response to type I interferon | 42/8552 | 52/18723 | 2.15e-07 | 3.30e-06 | 42 |
| GO:00028318 | Esophagus | ESCC | regulation of response to biotic stimulus | 191/8552 | 327/18723 | 2.12e-06 | 2.45e-05 | 191 |
| GO:000257317 | Esophagus | ESCC | myeloid leukocyte differentiation | 128/8552 | 208/18723 | 2.75e-06 | 3.15e-05 | 128 |
| GO:00607595 | Esophagus | ESCC | regulation of response to cytokine stimulus | 103/8552 | 162/18723 | 3.14e-06 | 3.53e-05 | 103 |
| GO:00019595 | Esophagus | ESCC | regulation of cytokine-mediated signaling pathway | 95/8552 | 150/18723 | 9.48e-06 | 9.04e-05 | 95 |
| GO:003952813 | Esophagus | ESCC | cytoplasmic pattern recognition receptor signaling pathway in response to virus | 28/8552 | 34/18723 | 1.21e-05 | 1.12e-04 | 28 |
| GO:00603385 | Esophagus | ESCC | regulation of type I interferon-mediated signaling pathway | 29/8552 | 36/18723 | 1.91e-05 | 1.67e-04 | 29 |
| GO:003248112 | Esophagus | ESCC | positive regulation of type I interferon production | 42/8552 | 58/18723 | 3.27e-05 | 2.70e-04 | 42 |
| GO:009858613 | Esophagus | ESCC | cellular response to virus | 56/8552 | 84/18723 | 8.20e-05 | 6.01e-04 | 56 |
| GO:00326084 | Esophagus | ESCC | interferon-beta production | 40/8552 | 56/18723 | 8.36e-05 | 6.08e-04 | 40 |
| GO:00326484 | Esophagus | ESCC | regulation of interferon-beta production | 40/8552 | 56/18723 | 8.36e-05 | 6.08e-04 | 40 |
| GO:003247912 | Esophagus | ESCC | regulation of type I interferon production | 61/8552 | 95/18723 | 2.05e-04 | 1.29e-03 | 61 |
| Page: 1 2 3 4 5 6 7 8 9 10 11 12 13 14 |
| Pathway ID | Tissue | Disease Stage | Description | Gene Ratio | Bg Ratio | pvalue | p.adjust | qvalue | Count |
| hsa05169210 | Esophagus | ESCC | Epstein-Barr virus infection | 151/4205 | 202/8465 | 1.55e-13 | 3.45e-12 | 1.77e-12 | 151 |
| hsa05167211 | Esophagus | ESCC | Kaposi sarcoma-associated herpesvirus infection | 136/4205 | 194/8465 | 4.28e-09 | 4.22e-08 | 2.16e-08 | 136 |
| hsa0516425 | Esophagus | ESCC | Influenza A | 122/4205 | 171/8465 | 5.01e-09 | 4.79e-08 | 2.45e-08 | 122 |
| hsa0520325 | Esophagus | ESCC | Viral carcinogenesis | 137/4205 | 204/8465 | 2.47e-07 | 1.88e-06 | 9.62e-07 | 137 |
| hsa05417211 | Esophagus | ESCC | Lipid and atherosclerosis | 143/4205 | 215/8465 | 3.30e-07 | 2.45e-06 | 1.26e-06 | 143 |
| hsa051609 | Esophagus | ESCC | Hepatitis C | 107/4205 | 157/8465 | 1.75e-06 | 1.08e-05 | 5.55e-06 | 107 |
| hsa051619 | Esophagus | ESCC | Hepatitis B | 108/4205 | 162/8465 | 7.68e-06 | 4.15e-05 | 2.12e-05 | 108 |
| hsa051629 | Esophagus | ESCC | Measles | 90/4205 | 139/8465 | 2.16e-04 | 7.87e-04 | 4.03e-04 | 90 |
| hsa0462122 | Esophagus | ESCC | NOD-like receptor signaling pathway | 116/4205 | 186/8465 | 2.90e-04 | 1.03e-03 | 5.30e-04 | 116 |
| hsa046234 | Esophagus | ESCC | Cytosolic DNA-sensing pathway | 49/4205 | 75/8465 | 4.35e-03 | 1.12e-02 | 5.74e-03 | 49 |
| hsa0516937 | Esophagus | ESCC | Epstein-Barr virus infection | 151/4205 | 202/8465 | 1.55e-13 | 3.45e-12 | 1.77e-12 | 151 |
| hsa0516738 | Esophagus | ESCC | Kaposi sarcoma-associated herpesvirus infection | 136/4205 | 194/8465 | 4.28e-09 | 4.22e-08 | 2.16e-08 | 136 |
| hsa0516435 | Esophagus | ESCC | Influenza A | 122/4205 | 171/8465 | 5.01e-09 | 4.79e-08 | 2.45e-08 | 122 |
| hsa0520335 | Esophagus | ESCC | Viral carcinogenesis | 137/4205 | 204/8465 | 2.47e-07 | 1.88e-06 | 9.62e-07 | 137 |
| hsa05417310 | Esophagus | ESCC | Lipid and atherosclerosis | 143/4205 | 215/8465 | 3.30e-07 | 2.45e-06 | 1.26e-06 | 143 |
| hsa0516016 | Esophagus | ESCC | Hepatitis C | 107/4205 | 157/8465 | 1.75e-06 | 1.08e-05 | 5.55e-06 | 107 |
| hsa0516114 | Esophagus | ESCC | Hepatitis B | 108/4205 | 162/8465 | 7.68e-06 | 4.15e-05 | 2.12e-05 | 108 |
| hsa0516213 | Esophagus | ESCC | Measles | 90/4205 | 139/8465 | 2.16e-04 | 7.87e-04 | 4.03e-04 | 90 |
| hsa0462132 | Esophagus | ESCC | NOD-like receptor signaling pathway | 116/4205 | 186/8465 | 2.90e-04 | 1.03e-03 | 5.30e-04 | 116 |
| hsa0462311 | Esophagus | ESCC | Cytosolic DNA-sensing pathway | 49/4205 | 75/8465 | 4.35e-03 | 1.12e-02 | 5.74e-03 | 49 |
| Page: 1 2 3 4 5 |
Top |
Cell-cell communication analysis |
| Identification of potential cell-cell interactions between two cell types and their ligand-receptor pairs for different disease states |
| Ligand | Receptor | LRpair | Pathway | Tissue | Disease Stage |
| Page: 1 |
Top |
Single-cell gene regulatory network inference analysis |
| Find out the significant the regulons (TFs) and the target genes of each regulon across cell types for different disease states |
| TF | Cell Type | Tissue | Disease Stage | Target Gene | RSS | Regulon Activity |
| IRF7 | IMENT | Colorectum | ADJ | XAF1,MX1,CDHR5, etc. | 2.99e-01 |  |
| IRF7 | M2MAC | Esophagus | ADJ | EXOC3,RP11-16E12.2,CLN6, etc. | 2.45e-01 |  |
| IRF7 | M2MAC | Esophagus | ESCC | EXOC3,RP11-16E12.2,CLN6, etc. | 2.74e-01 |  |
| IRF7 | SEC | Liver | Healthy | ISG15,LY6E,MX1, etc. | 7.04e-01 |  |
| ∗The dot plots of a searched regulon are shown for all cell subpopulations in each disease state of each tissue based on the regulon specific score inferred using pySCENIC and by calculating the average expression. |
| Page: 1 |
Top |
Somatic mutation of malignant transformation related genes |
| Annotation of somatic variants for genes involved in malignant transformation |
| Hugo Symbol | Variant Class | Variant Classification | dbSNP RS | HGVSc | HGVSp | HGVSp Short | SWISSPROT | BIOTYPE | SIFT | PolyPhen | Tumor Sample Barcode | Tissue | Histology | Sex | Age | Stage | Therapy Types | Drugs | Outcome |
| IRF7 | SNV | Missense_Mutation | novel | c.1313N>T | p.Ser438Phe | p.S438F | Q92985 | protein_coding | deleterious(0) | probably_damaging(0.999) | TCGA-BH-A2L8-01 | Breast | breast invasive carcinoma | Female | <65 | I/II | Chemotherapy | cytoxan | CR |
| IRF7 | SNV | Missense_Mutation | novel | c.1262N>A | p.Arg421Lys | p.R421K | Q92985 | protein_coding | tolerated(0.21) | benign(0.079) | TCGA-HM-A4S6-01 | Cervix | cervical & endocervical cancer | Female | <65 | III/IV | Chemotherapy | cisplatin | CR |
| IRF7 | SNV | Missense_Mutation | rs375250292 | c.676G>C | p.Glu226Gln | p.E226Q | Q92985 | protein_coding | tolerated(0.57) | benign(0.015) | TCGA-IR-A3LA-01 | Cervix | cervical & endocervical cancer | Female | <65 | I/II | Chemotherapy | cisplatin | CR |
| IRF7 | SNV | Missense_Mutation | novel | c.1487C>G | p.Ser496Cys | p.S496C | Q92985 | protein_coding | deleterious(0.02) | probably_damaging(0.997) | TCGA-VS-A9UC-01 | Cervix | cervical & endocervical cancer | Female | <65 | I/II | Chemotherapy | cisplatin | SD |
| IRF7 | deletion | Frame_Shift_Del | novel | c.1028_1085delNNNNNNNNNNNNNNNNNNNNNNNNNNNNNNNNNNNNNNNNNNNNNNNNNNNNNNNNNN | p.Ala343GlyfsTer103 | p.A343Gfs*103 | Q92985 | protein_coding | TCGA-Q1-A73O-01 | Cervix | cervical & endocervical cancer | Female | <65 | I/II | Chemotherapy | cisplatin | CR | ||
| IRF7 | insertion | Frame_Shift_Ins | rs746222183 | c.646_647insG | p.Ala216GlyfsTer199 | p.A216Gfs*199 | Q92985 | protein_coding | TCGA-VS-A9U6-01 | Cervix | cervical & endocervical cancer | Female | <65 | I/II | Chemotherapy | cisplatin | PD | ||
| IRF7 | SNV | Missense_Mutation | novel | c.1541N>C | p.Gln514Pro | p.Q514P | Q92985 | protein_coding | deleterious_low_confidence(0) | probably_damaging(0.991) | TCGA-5M-AAT6-01 | Colorectum | colon adenocarcinoma | Female | <65 | III/IV | Unknown | Unknown | PD |
| IRF7 | SNV | Missense_Mutation | c.446N>T | p.Thr149Met | p.T149M | Q92985 | protein_coding | tolerated(0.26) | benign(0.025) | TCGA-A6-6653-01 | Colorectum | colon adenocarcinoma | Male | >=65 | I/II | Unknown | Unknown | SD | |
| IRF7 | SNV | Missense_Mutation | c.593N>G | p.Gln198Arg | p.Q198R | Q92985 | protein_coding | deleterious(0) | possibly_damaging(0.559) | TCGA-A6-6780-01 | Colorectum | colon adenocarcinoma | Male | >=65 | I/II | Unknown | Unknown | SD | |
| IRF7 | SNV | Missense_Mutation | rs786205223 | c.1267N>G | p.Phe423Val | p.F423V | Q92985 | protein_coding | deleterious(0) | probably_damaging(0.957) | TCGA-AA-A010-01 | Colorectum | colon adenocarcinoma | Female | <65 | I/II | Chemotherapy | folinic | CR |
| Page: 1 2 3 4 |
Top |
Related drugs of malignant transformation related genes |
| Identification of chemicals and drugs interact with genes involved in malignant transfromation |
| (DGIdb 4.0) |
| Entrez ID | Symbol | Category | Interaction Types | Drug Claim Name | Drug Name | PMIDs |
| Page: 1 |

Copyright 2023-Present -The University of Texas Health Science Center at Houston |