
|
|||||
|
 | |
| |
| |
| |
| |
| |
|
Gene: IRF4 |
Gene summary for IRF4 |
| Gene information | Species | Human | Gene symbol | IRF4 | Gene ID | 3662 |
| Gene name | interferon regulatory factor 4 | |
| Gene Alias | LSIRF | |
| Cytomap | 6p25.3 | |
| Gene Type | protein-coding | GO ID | GO:0001562 | UniProtAcc | Q15306 |
Top |
Malignant transformation analysis |
| Identification of the aberrant gene expression in precancerous and cancerous lesions by comparing the gene expression of stem-like cells in diseased tissues with normal stem cells |
| Entrez ID | Symbol | Replicates | Species | Organ | Tissue | Adj P-value | Log2FC | Malignancy |
| 3662 | IRF4 | C09 | Human | Oral cavity | OSCC | 1.84e-36 | 1.09e+00 | 0.1431 |
| 3662 | IRF4 | EOLP-1 | Human | Oral cavity | EOLP | 4.63e-17 | 5.16e-01 | -0.0202 |
| Page: 1 |
| Tissue | Expression Dynamics | Abbreviation |
| Oral Cavity | 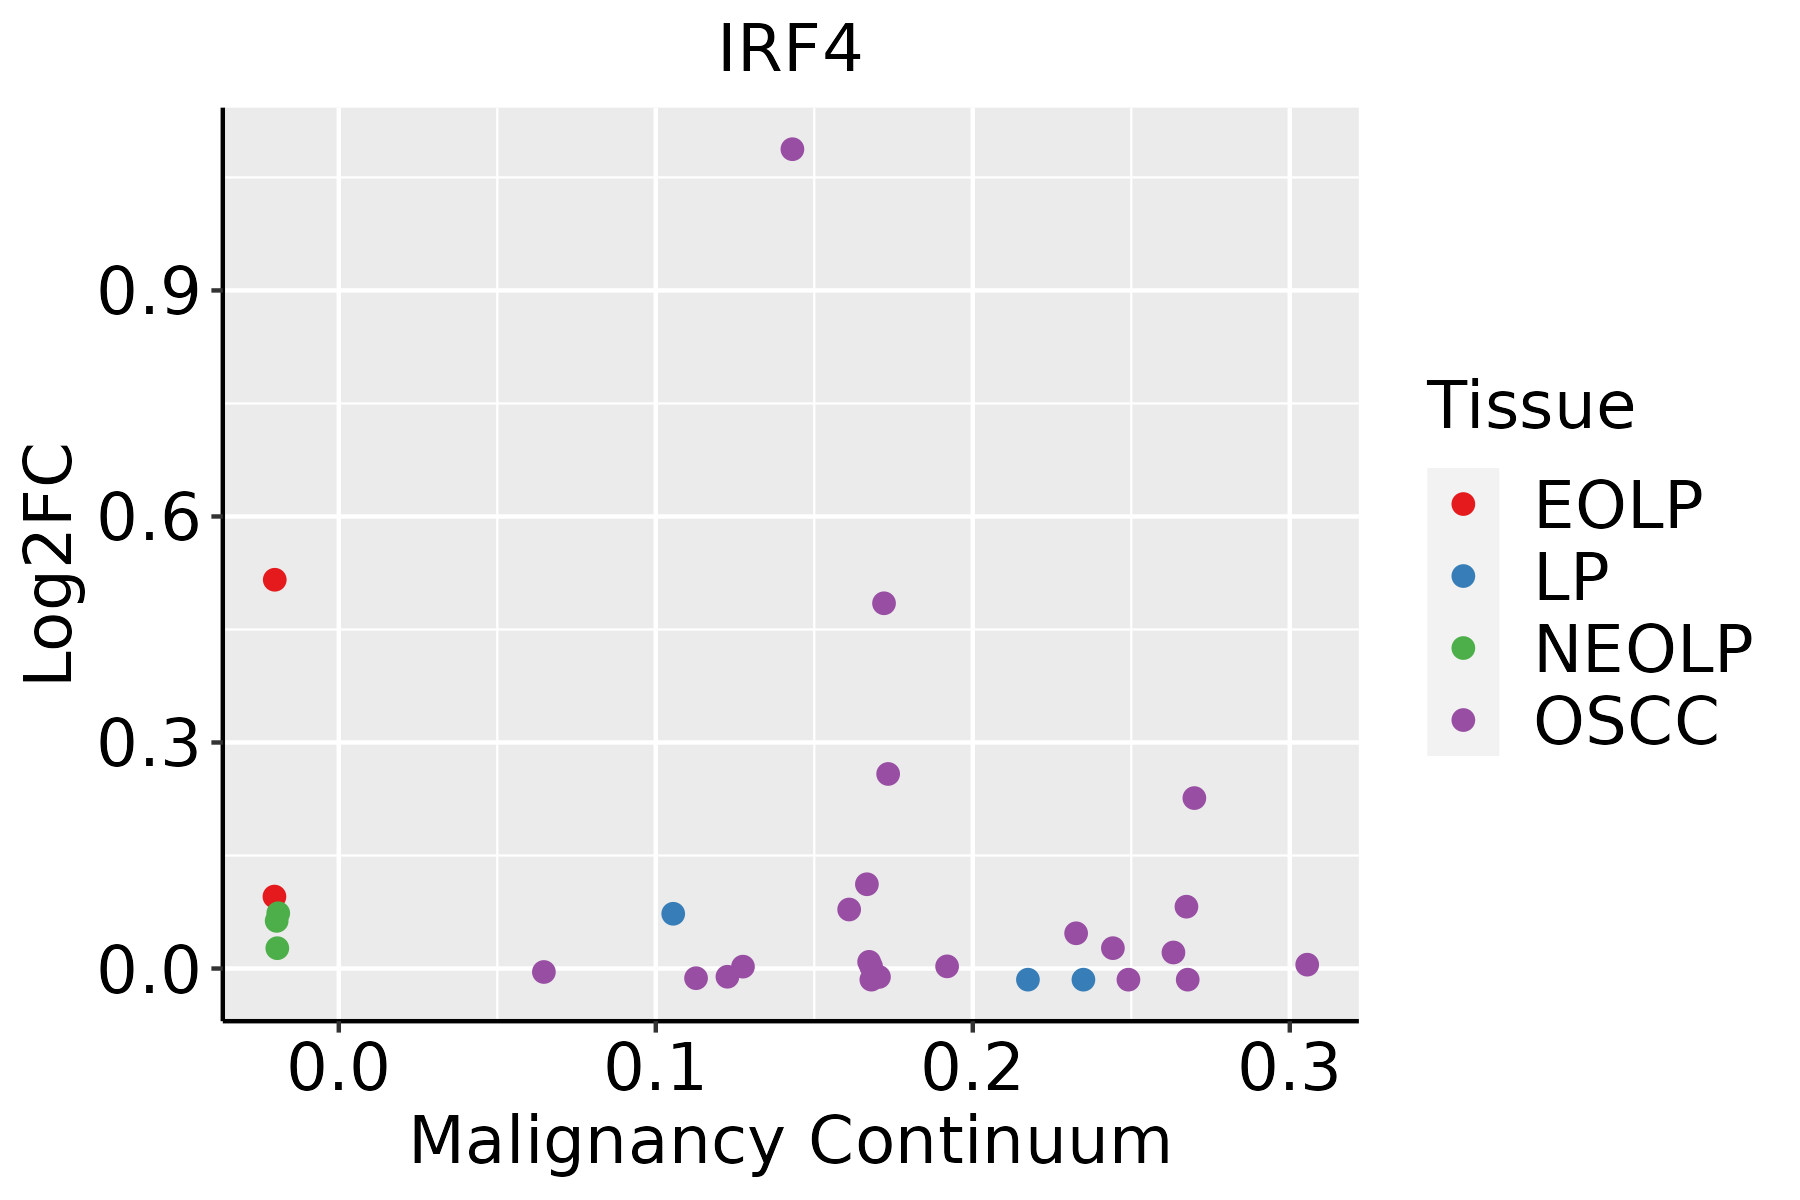 | EOLP: Erosive Oral lichen planus |
| LP: leukoplakia | ||
| NEOLP: Non-erosive oral lichen planus | ||
| OSCC: Oral squamous cell carcinoma |
| ∗log2FC in expression of this searched gene in stem-like cells from each diseased tissue sample relative to stem-like cells in normal samples in each tissue plotted against the malignancy continuum. Samples are colored based on if they are from different disease stage. |
Top |
Malignant transformation related pathway analysis |
| Find out the enriched GO biological processes and KEGG pathways involved in transition from healthy to precancer to cancer |
| Tissue | Disease Stage | Enriched GO biological Processes |
| Colorectum | AD |  |
| Colorectum | SER |  |
| Colorectum | MSS |  |
| Colorectum | MSI-H |  |
| Colorectum | FAP |  |
| ∗Top 15 enriched GO BP terms are showed in the bar plot of each disease state in each tissue. Each row represents a significant GO biological process which is colored according to the -log10(p.adjust). |
| Page: 1 2 3 4 5 6 7 8 9 |
| GO ID | Tissue | Disease Stage | Description | Gene Ratio | Bg Ratio | pvalue | p.adjust | Count |
| GO:00165707 | Oral cavity | OSCC | histone modification | 270/7305 | 463/18723 | 1.59e-17 | 1.50e-15 | 270 |
| GO:005109820 | Oral cavity | OSCC | regulation of binding | 212/7305 | 363/18723 | 3.88e-14 | 2.15e-12 | 212 |
| GO:00182056 | Oral cavity | OSCC | peptidyl-lysine modification | 216/7305 | 376/18723 | 2.32e-13 | 1.16e-11 | 216 |
| GO:00435434 | Oral cavity | OSCC | protein acylation | 149/7305 | 243/18723 | 1.33e-12 | 5.80e-11 | 149 |
| GO:003009920 | Oral cavity | OSCC | myeloid cell differentiation | 213/7305 | 381/18723 | 1.24e-11 | 4.42e-10 | 213 |
| GO:00183944 | Oral cavity | OSCC | peptidyl-lysine acetylation | 108/7305 | 169/18723 | 4.55e-11 | 1.45e-09 | 108 |
| GO:00064734 | Oral cavity | OSCC | protein acetylation | 124/7305 | 201/18723 | 5.59e-11 | 1.74e-09 | 124 |
| GO:00165734 | Oral cavity | OSCC | histone acetylation | 96/7305 | 152/18723 | 1.35e-09 | 3.29e-08 | 96 |
| GO:00183934 | Oral cavity | OSCC | internal peptidyl-lysine acetylation | 99/7305 | 158/18723 | 1.41e-09 | 3.39e-08 | 99 |
| GO:00064754 | Oral cavity | OSCC | internal protein amino acid acetylation | 100/7305 | 160/18723 | 1.43e-09 | 3.41e-08 | 100 |
| GO:005109920 | Oral cavity | OSCC | positive regulation of binding | 105/7305 | 173/18723 | 5.88e-09 | 1.26e-07 | 105 |
| GO:00439674 | Oral cavity | OSCC | histone H4 acetylation | 49/7305 | 67/18723 | 1.45e-08 | 2.91e-07 | 49 |
| GO:000257310 | Oral cavity | OSCC | myeloid leukocyte differentiation | 119/7305 | 208/18723 | 7.29e-08 | 1.29e-06 | 119 |
| GO:004211016 | Oral cavity | OSCC | T cell activation | 245/7305 | 487/18723 | 2.00e-07 | 3.22e-06 | 245 |
| GO:19031316 | Oral cavity | OSCC | mononuclear cell differentiation | 210/7305 | 426/18723 | 8.44e-06 | 9.02e-05 | 210 |
| GO:00022214 | Oral cavity | OSCC | pattern recognition receptor signaling pathway | 95/7305 | 172/18723 | 1.11e-05 | 1.15e-04 | 95 |
| GO:190370618 | Oral cavity | OSCC | regulation of hemopoiesis | 180/7305 | 367/18723 | 5.16e-05 | 4.30e-04 | 180 |
| GO:005086315 | Oral cavity | OSCC | regulation of T cell activation | 161/7305 | 329/18723 | 1.44e-04 | 1.02e-03 | 161 |
| GO:00300983 | Oral cavity | OSCC | lymphocyte differentiation | 179/7305 | 374/18723 | 2.74e-04 | 1.74e-03 | 179 |
| GO:005110120 | Oral cavity | OSCC | regulation of DNA binding | 64/7305 | 118/18723 | 5.53e-04 | 3.21e-03 | 64 |
| Page: 1 2 3 4 5 |
| Pathway ID | Tissue | Disease Stage | Description | Gene Ratio | Bg Ratio | pvalue | p.adjust | qvalue | Count |
| hsa0465923 | Oral cavity | EOLP | Th17 cell differentiation | 41/1218 | 108/8465 | 9.84e-10 | 3.18e-08 | 1.87e-08 | 41 |
| hsa0465933 | Oral cavity | EOLP | Th17 cell differentiation | 41/1218 | 108/8465 | 9.84e-10 | 3.18e-08 | 1.87e-08 | 41 |
| Page: 1 |
Top |
Cell-cell communication analysis |
| Identification of potential cell-cell interactions between two cell types and their ligand-receptor pairs for different disease states |
| Ligand | Receptor | LRpair | Pathway | Tissue | Disease Stage |
| Page: 1 |
Top |
Single-cell gene regulatory network inference analysis |
| Find out the significant the regulons (TFs) and the target genes of each regulon across cell types for different disease states |
| TF | Cell Type | Tissue | Disease Stage | Target Gene | RSS | Regulon Activity |
| IRF4 | PLA | Colorectum | ADJ | SSR4,UBE2J1,ARSG, etc. | 2.04e-01 |  |
| IRF4 | pDC | Lung | ADJ | TCF4,SLC15A4,C12orf75, etc. | 7.37e-02 |  |
| IRF4 | BN | Lung | ADJ | TCF4,SLC15A4,C12orf75, etc. | 4.09e-02 | |
| IRF4 | MEN | Skin | ADJ | ROBO2,AC007319.1,INPP4B, etc. | 3.90e-01 |  |
| IRF4 | MEN | Skin | AK | ROBO2,AC007319.1,INPP4B, etc. | 3.78e-01 |  |
| IRF4 | MEN | Skin | cSCC | ROBO2,AC007319.1,INPP4B, etc. | 1.74e-01 |  |
| IRF4 | MEN | Skin | SCCIS | ROBO2,AC007319.1,INPP4B, etc. | 1.97e-01 |  |
| ∗The dot plots of a searched regulon are shown for all cell subpopulations in each disease state of each tissue based on the regulon specific score inferred using pySCENIC and by calculating the average expression. |
| Page: 1 |
Top |
Somatic mutation of malignant transformation related genes |
| Annotation of somatic variants for genes involved in malignant transformation |
| Hugo Symbol | Variant Class | Variant Classification | dbSNP RS | HGVSc | HGVSp | HGVSp Short | SWISSPROT | BIOTYPE | SIFT | PolyPhen | Tumor Sample Barcode | Tissue | Histology | Sex | Age | Stage | Therapy Types | Drugs | Outcome |
| IRF4 | insertion | Frame_Shift_Ins | novel | c.363_364insCCTCTGTCTAGAGCTGTCTCCCTTGCCC | p.Tyr122ProfsTer18 | p.Y122Pfs*18 | Q15306 | protein_coding | TCGA-AO-A0JD-01 | Breast | breast invasive carcinoma | Female | <65 | III/IV | Chemotherapy | cyclophosphamide | SD | ||
| IRF4 | SNV | Missense_Mutation | rs751010198 | c.737C>T | p.Ala246Val | p.A246V | Q15306 | protein_coding | tolerated(0.09) | benign(0.062) | TCGA-EA-A410-01 | Cervix | cervical & endocervical cancer | Female | <65 | I/II | Unknown | Unknown | SD |
| IRF4 | SNV | Missense_Mutation | c.256N>A | p.Asp86Asn | p.D86N | Q15306 | protein_coding | deleterious(0.01) | probably_damaging(0.997) | TCGA-VS-A958-01 | Cervix | cervical & endocervical cancer | Female | <65 | I/II | Chemotherapy | cisplatin | CR | |
| IRF4 | SNV | Missense_Mutation | c.967N>A | p.Gly323Arg | p.G323R | Q15306 | protein_coding | deleterious(0) | probably_damaging(1) | TCGA-AA-3693-01 | Colorectum | colon adenocarcinoma | Female | >=65 | III/IV | Unknown | Unknown | SD | |
| IRF4 | SNV | Missense_Mutation | c.1304N>A | p.Ser435Asn | p.S435N | Q15306 | protein_coding | tolerated(0.57) | benign(0.001) | TCGA-AA-3811-01 | Colorectum | colon adenocarcinoma | Female | >=65 | III/IV | Unknown | Unknown | PD | |
| IRF4 | SNV | Missense_Mutation | c.103G>A | p.Gly35Ser | p.G35S | Q15306 | protein_coding | deleterious(0.04) | benign(0.095) | TCGA-AA-3851-01 | Colorectum | colon adenocarcinoma | Male | >=65 | I/II | Unknown | Unknown | SD | |
| IRF4 | SNV | Missense_Mutation | novel | c.1004N>C | p.Tyr335Ser | p.Y335S | Q15306 | protein_coding | deleterious(0) | probably_damaging(0.944) | TCGA-AA-A01I-01 | Colorectum | colon adenocarcinoma | Male | >=65 | I/II | Unknown | Unknown | SD |
| IRF4 | SNV | Missense_Mutation | rs143144957 | c.604G>A | p.Gly202Ser | p.G202S | Q15306 | protein_coding | tolerated(1) | benign(0) | TCGA-G4-6315-01 | Colorectum | colon adenocarcinoma | Male | >=65 | III/IV | Chemotherapy | fluorouracil | SD |
| IRF4 | insertion | Frame_Shift_Ins | novel | c.401_402insC | p.Lys134AsnfsTer78 | p.K134Nfs*78 | Q15306 | protein_coding | TCGA-AA-A01K-01 | Colorectum | colon adenocarcinoma | Female | >=65 | III/IV | Chemotherapy | folinic | CR | ||
| IRF4 | SNV | Missense_Mutation | rs781586995 | c.544N>A | p.Val182Ile | p.V182I | Q15306 | protein_coding | tolerated(0.36) | benign(0.018) | TCGA-A5-AB3J-01 | Endometrium | uterine corpus endometrioid carcinoma | Female | <65 | I/II | Chemotherapy | carboplatin | CR |
| Page: 1 2 3 4 5 6 7 |
Top |
Related drugs of malignant transformation related genes |
| Identification of chemicals and drugs interact with genes involved in malignant transfromation |
| (DGIdb 4.0) |
| Entrez ID | Symbol | Category | Interaction Types | Drug Claim Name | Drug Name | PMIDs |
| Page: 1 |

Copyright 2023-Present -The University of Texas Health Science Center at Houston |