
|
|||||
|
 | |
| |
| |
| |
| |
| |
|
Gene: IRF2BPL |
Gene summary for IRF2BPL |
| Gene information | Species | Human | Gene symbol | IRF2BPL | Gene ID | 64207 |
| Gene name | interferon regulatory factor 2 binding protein like | |
| Gene Alias | C14orf4 | |
| Cytomap | 14q24.3 | |
| Gene Type | protein-coding | GO ID | GO:0000003 | UniProtAcc | Q9H1B7 |
Top |
Malignant transformation analysis |
| Identification of the aberrant gene expression in precancerous and cancerous lesions by comparing the gene expression of stem-like cells in diseased tissues with normal stem cells |
| Entrez ID | Symbol | Replicates | Species | Organ | Tissue | Adj P-value | Log2FC | Malignancy |
| 64207 | IRF2BPL | LZE4T | Human | Esophagus | ESCC | 1.21e-10 | -1.59e-01 | 0.0811 |
| 64207 | IRF2BPL | LZE7T | Human | Esophagus | ESCC | 4.94e-05 | -2.11e-01 | 0.0667 |
| 64207 | IRF2BPL | LZE8T | Human | Esophagus | ESCC | 2.15e-07 | -1.87e-01 | 0.067 |
| 64207 | IRF2BPL | LZE20T | Human | Esophagus | ESCC | 2.29e-12 | -5.98e-02 | 0.0662 |
| 64207 | IRF2BPL | LZE22D1 | Human | Esophagus | HGIN | 3.62e-08 | -7.52e-02 | 0.0595 |
| 64207 | IRF2BPL | LZE24T | Human | Esophagus | ESCC | 2.51e-04 | -7.86e-02 | 0.0596 |
| 64207 | IRF2BPL | LZE22D3 | Human | Esophagus | HGIN | 3.43e-03 | 1.84e-01 | 0.0653 |
| 64207 | IRF2BPL | LZE21T | Human | Esophagus | ESCC | 2.86e-04 | 1.18e-01 | 0.0655 |
| 64207 | IRF2BPL | LZE6T | Human | Esophagus | ESCC | 5.65e-05 | -2.25e-01 | 0.0845 |
| 64207 | IRF2BPL | P1T-E | Human | Esophagus | ESCC | 2.34e-04 | 3.93e-01 | 0.0875 |
| 64207 | IRF2BPL | P2T-E | Human | Esophagus | ESCC | 8.59e-33 | 7.06e-01 | 0.1177 |
| 64207 | IRF2BPL | P4T-E | Human | Esophagus | ESCC | 6.47e-11 | 1.01e-01 | 0.1323 |
| 64207 | IRF2BPL | P5T-E | Human | Esophagus | ESCC | 1.67e-09 | -1.88e-01 | 0.1327 |
| 64207 | IRF2BPL | P8T-E | Human | Esophagus | ESCC | 3.10e-19 | 1.05e-01 | 0.0889 |
| 64207 | IRF2BPL | P9T-E | Human | Esophagus | ESCC | 2.32e-17 | -4.65e-03 | 0.1131 |
| 64207 | IRF2BPL | P10T-E | Human | Esophagus | ESCC | 3.13e-16 | 1.64e-01 | 0.116 |
| 64207 | IRF2BPL | P11T-E | Human | Esophagus | ESCC | 4.86e-07 | 2.19e-01 | 0.1426 |
| 64207 | IRF2BPL | P12T-E | Human | Esophagus | ESCC | 1.94e-18 | 4.09e-01 | 0.1122 |
| 64207 | IRF2BPL | P15T-E | Human | Esophagus | ESCC | 6.66e-28 | 8.78e-01 | 0.1149 |
| 64207 | IRF2BPL | P16T-E | Human | Esophagus | ESCC | 1.74e-35 | 6.99e-01 | 0.1153 |
| Page: 1 2 3 4 5 |
| Tissue | Expression Dynamics | Abbreviation |
| Esophagus |  | ESCC: Esophageal squamous cell carcinoma |
| HGIN: High-grade intraepithelial neoplasias | ||
| LGIN: Low-grade intraepithelial neoplasias | ||
| Oral Cavity |  | EOLP: Erosive Oral lichen planus |
| LP: leukoplakia | ||
| NEOLP: Non-erosive oral lichen planus | ||
| OSCC: Oral squamous cell carcinoma | ||
| Prostate |  | BPH: Benign Prostatic Hyperplasia |
| Skin | 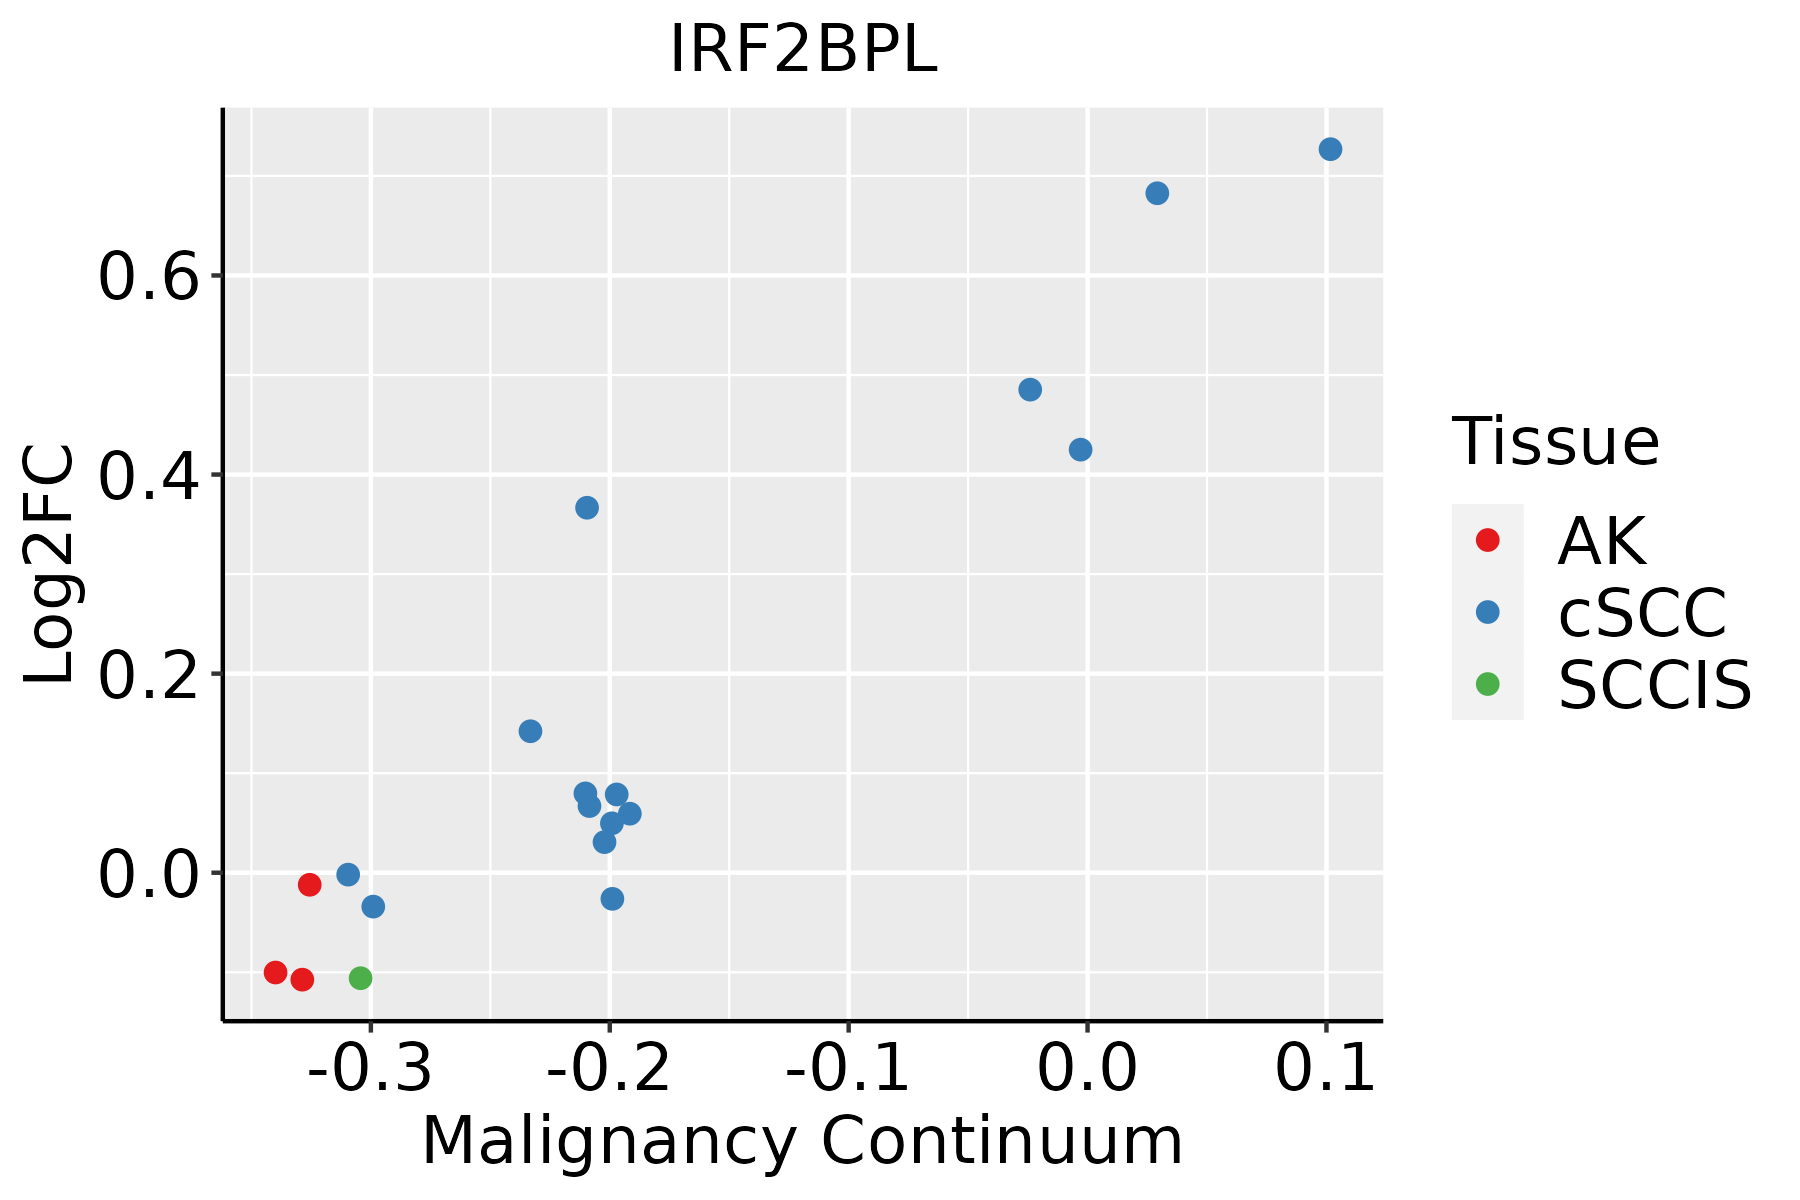 | AK: Actinic keratosis |
| cSCC: Cutaneous squamous cell carcinoma | ||
| SCCIS:squamous cell carcinoma in situ | ||
| Thyroid |  | ATC: Anaplastic thyroid cancer |
| HT: Hashimoto's thyroiditis | ||
| PTC: Papillary thyroid cancer |
| ∗log2FC in expression of this searched gene in stem-like cells from each diseased tissue sample relative to stem-like cells in normal samples in each tissue plotted against the malignancy continuum. Samples are colored based on if they are from different disease stage. |
Top |
Malignant transformation related pathway analysis |
| Find out the enriched GO biological processes and KEGG pathways involved in transition from healthy to precancer to cancer |
| Tissue | Disease Stage | Enriched GO biological Processes |
| Colorectum | AD |  |
| Colorectum | SER |  |
| Colorectum | MSS |  |
| Colorectum | MSI-H |  |
| Colorectum | FAP |  |
| ∗Top 15 enriched GO BP terms are showed in the bar plot of each disease state in each tissue. Each row represents a significant GO biological process which is colored according to the -log10(p.adjust). |
| Page: 1 2 3 4 5 6 7 8 9 |
| GO ID | Tissue | Disease Stage | Description | Gene Ratio | Bg Ratio | pvalue | p.adjust | Count |
| Page: 1 |
| Pathway ID | Tissue | Disease Stage | Description | Gene Ratio | Bg Ratio | pvalue | p.adjust | qvalue | Count |
| Page: 1 |
Top |
Cell-cell communication analysis |
| Identification of potential cell-cell interactions between two cell types and their ligand-receptor pairs for different disease states |
| Ligand | Receptor | LRpair | Pathway | Tissue | Disease Stage |
| Page: 1 |
Top |
Single-cell gene regulatory network inference analysis |
| Find out the significant the regulons (TFs) and the target genes of each regulon across cell types for different disease states |
| TF | Cell Type | Tissue | Disease Stage | Target Gene | RSS | Regulon Activity |
| ∗The dot plots of a searched regulon are shown for all cell subpopulations in each disease state of each tissue based on the regulon specific score inferred using pySCENIC and by calculating the average expression. |
| Page: 1 |
Top |
Somatic mutation of malignant transformation related genes |
| Annotation of somatic variants for genes involved in malignant transformation |
| Hugo Symbol | Variant Class | Variant Classification | dbSNP RS | HGVSc | HGVSp | HGVSp Short | SWISSPROT | BIOTYPE | SIFT | PolyPhen | Tumor Sample Barcode | Tissue | Histology | Sex | Age | Stage | Therapy Types | Drugs | Outcome |
| IRF2BPL | SNV | Missense_Mutation | novel | c.1129N>C | p.Asp377His | p.D377H | Q9H1B7 | protein_coding | deleterious(0) | probably_damaging(0.959) | TCGA-A7-A6VV-01 | Breast | breast invasive carcinoma | Female | <65 | I/II | Chemotherapy | cyclophosphamide | CR |
| IRF2BPL | SNV | Missense_Mutation | c.2114N>T | p.Ser705Phe | p.S705F | Q9H1B7 | protein_coding | deleterious(0) | probably_damaging(0.947) | TCGA-D8-A1J9-01 | Breast | breast invasive carcinoma | Female | <65 | I/II | Unknown | Unknown | SD | |
| IRF2BPL | SNV | Missense_Mutation | novel | c.1408N>C | p.Asp470His | p.D470H | Q9H1B7 | protein_coding | deleterious(0) | probably_damaging(0.945) | TCGA-PE-A5DE-01 | Breast | breast invasive carcinoma | Female | <65 | I/II | Chemotherapy | taxotere | CR |
| IRF2BPL | SNV | Missense_Mutation | novel | c.1447N>T | p.Arg483Cys | p.R483C | Q9H1B7 | protein_coding | deleterious(0) | probably_damaging(0.987) | TCGA-2W-A8YY-01 | Cervix | cervical & endocervical cancer | Female | <65 | I/II | Chemotherapy | cisplatin | CR |
| IRF2BPL | SNV | Missense_Mutation | rs749273166 | c.1396N>A | p.His466Asn | p.H466N | Q9H1B7 | protein_coding | deleterious(0.02) | benign(0.091) | TCGA-EK-A3GN-01 | Cervix | cervical & endocervical cancer | Female | <65 | III/IV | Unknown | Unknown | SD |
| IRF2BPL | deletion | Frame_Shift_Del | novel | c.224_305delNNNNNNNNNNNNNNNNNNNNNNNNNNNNNNNNNNNNNNNNNNNNNNNNNNNNNNNNNNNNNNNNNNNNNNNNNNNNNNNNNN | p.Pro75ArgfsTer50 | p.P75Rfs*50 | Q9H1B7 | protein_coding | TCGA-MA-AA3Y-01 | Cervix | cervical & endocervical cancer | Female | <65 | I/II | Unknown | Unknown | SD | ||
| IRF2BPL | SNV | Missense_Mutation | c.1298G>T | p.Ser433Ile | p.S433I | Q9H1B7 | protein_coding | deleterious(0) | benign(0.403) | TCGA-AA-A01P-01 | Colorectum | colon adenocarcinoma | Female | >=65 | III/IV | Unknown | Unknown | PD | |
| IRF2BPL | SNV | Missense_Mutation | rs147559103 | c.953N>T | p.Ser318Leu | p.S318L | Q9H1B7 | protein_coding | tolerated(0.48) | benign(0.089) | TCGA-AZ-4315-01 | Colorectum | colon adenocarcinoma | Male | <65 | I/II | Unknown | Unknown | SD |
| IRF2BPL | SNV | Missense_Mutation | c.1448N>A | p.Arg483His | p.R483H | Q9H1B7 | protein_coding | deleterious(0) | probably_damaging(0.987) | TCGA-CM-6674-01 | Colorectum | colon adenocarcinoma | Male | <65 | I/II | Unknown | Unknown | SD | |
| IRF2BPL | SNV | Missense_Mutation | novel | c.1384N>C | p.Tyr462His | p.Y462H | Q9H1B7 | protein_coding | deleterious(0) | probably_damaging(0.996) | TCGA-AJ-A3EK-01 | Endometrium | uterine corpus endometrioid carcinoma | Female | <65 | I/II | Chemotherapy | carboplatin | CR |
| Page: 1 2 3 4 5 |
Top |
Related drugs of malignant transformation related genes |
| Identification of chemicals and drugs interact with genes involved in malignant transfromation |
| (DGIdb 4.0) |
| Entrez ID | Symbol | Category | Interaction Types | Drug Claim Name | Drug Name | PMIDs |
| Page: 1 |

Copyright 2023-Present -The University of Texas Health Science Center at Houston |