
|
|||||
|
 | |
| |
| |
| |
| |
| |
|
Gene: IRF2 |
Gene summary for IRF2 |
| Gene information | Species | Human | Gene symbol | IRF2 | Gene ID | 3660 |
| Gene name | interferon regulatory factor 2 | |
| Gene Alias | IRF-2 | |
| Cytomap | 4q35.1 | |
| Gene Type | protein-coding | GO ID | GO:0000122 | UniProtAcc | P14316 |
Top |
Malignant transformation analysis |
| Identification of the aberrant gene expression in precancerous and cancerous lesions by comparing the gene expression of stem-like cells in diseased tissues with normal stem cells |
| Entrez ID | Symbol | Replicates | Species | Organ | Tissue | Adj P-value | Log2FC | Malignancy |
| 3660 | IRF2 | LZE4T | Human | Esophagus | ESCC | 1.75e-16 | 6.44e-01 | 0.0811 |
| 3660 | IRF2 | LZE5T | Human | Esophagus | ESCC | 2.09e-09 | 6.85e-01 | 0.0514 |
| 3660 | IRF2 | LZE7T | Human | Esophagus | ESCC | 2.48e-02 | 1.77e-01 | 0.0667 |
| 3660 | IRF2 | LZE8T | Human | Esophagus | ESCC | 9.83e-09 | 4.08e-01 | 0.067 |
| 3660 | IRF2 | LZE20T | Human | Esophagus | ESCC | 6.73e-14 | 3.18e-01 | 0.0662 |
| 3660 | IRF2 | LZE24T | Human | Esophagus | ESCC | 1.91e-19 | 4.78e-01 | 0.0596 |
| 3660 | IRF2 | LZE21T | Human | Esophagus | ESCC | 1.89e-04 | 4.56e-01 | 0.0655 |
| 3660 | IRF2 | LZE6T | Human | Esophagus | ESCC | 9.13e-07 | 4.82e-01 | 0.0845 |
| 3660 | IRF2 | P1T-E | Human | Esophagus | ESCC | 1.28e-04 | 3.43e-01 | 0.0875 |
| 3660 | IRF2 | P2T-E | Human | Esophagus | ESCC | 1.52e-43 | 7.58e-01 | 0.1177 |
| 3660 | IRF2 | P4T-E | Human | Esophagus | ESCC | 1.15e-17 | 4.57e-01 | 0.1323 |
| 3660 | IRF2 | P5T-E | Human | Esophagus | ESCC | 1.63e-19 | 4.53e-01 | 0.1327 |
| 3660 | IRF2 | P8T-E | Human | Esophagus | ESCC | 2.04e-39 | 7.26e-01 | 0.0889 |
| 3660 | IRF2 | P9T-E | Human | Esophagus | ESCC | 1.16e-17 | 4.49e-01 | 0.1131 |
| 3660 | IRF2 | P10T-E | Human | Esophagus | ESCC | 3.88e-17 | 2.49e-01 | 0.116 |
| 3660 | IRF2 | P11T-E | Human | Esophagus | ESCC | 1.95e-25 | 7.25e-01 | 0.1426 |
| 3660 | IRF2 | P12T-E | Human | Esophagus | ESCC | 3.34e-50 | 9.55e-01 | 0.1122 |
| 3660 | IRF2 | P15T-E | Human | Esophagus | ESCC | 2.68e-40 | 7.14e-01 | 0.1149 |
| 3660 | IRF2 | P16T-E | Human | Esophagus | ESCC | 1.24e-34 | 7.25e-01 | 0.1153 |
| 3660 | IRF2 | P17T-E | Human | Esophagus | ESCC | 4.50e-14 | 4.50e-01 | 0.1278 |
| Page: 1 2 3 4 5 |
| Tissue | Expression Dynamics | Abbreviation |
| Esophagus | 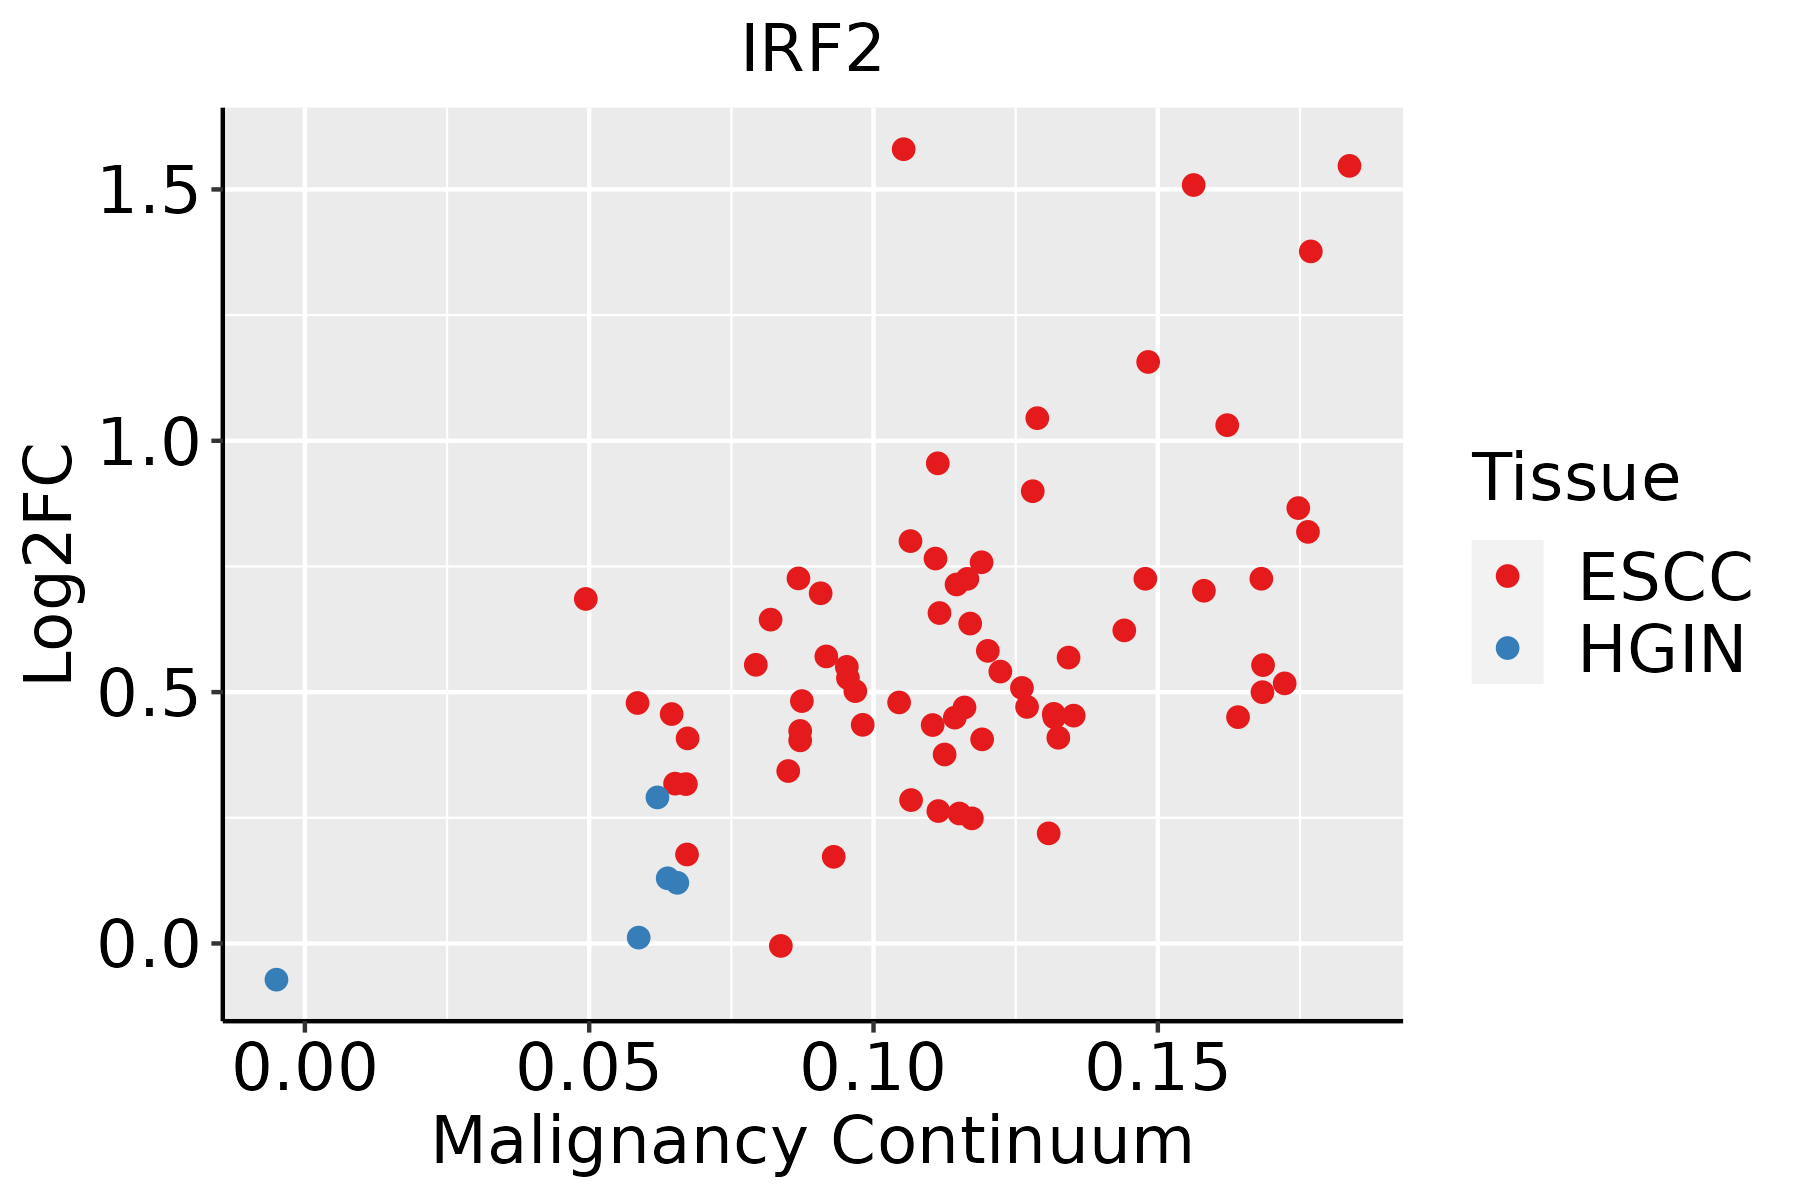 | ESCC: Esophageal squamous cell carcinoma |
| HGIN: High-grade intraepithelial neoplasias | ||
| LGIN: Low-grade intraepithelial neoplasias | ||
| Liver |  | HCC: Hepatocellular carcinoma |
| NAFLD: Non-alcoholic fatty liver disease | ||
| Oral Cavity | 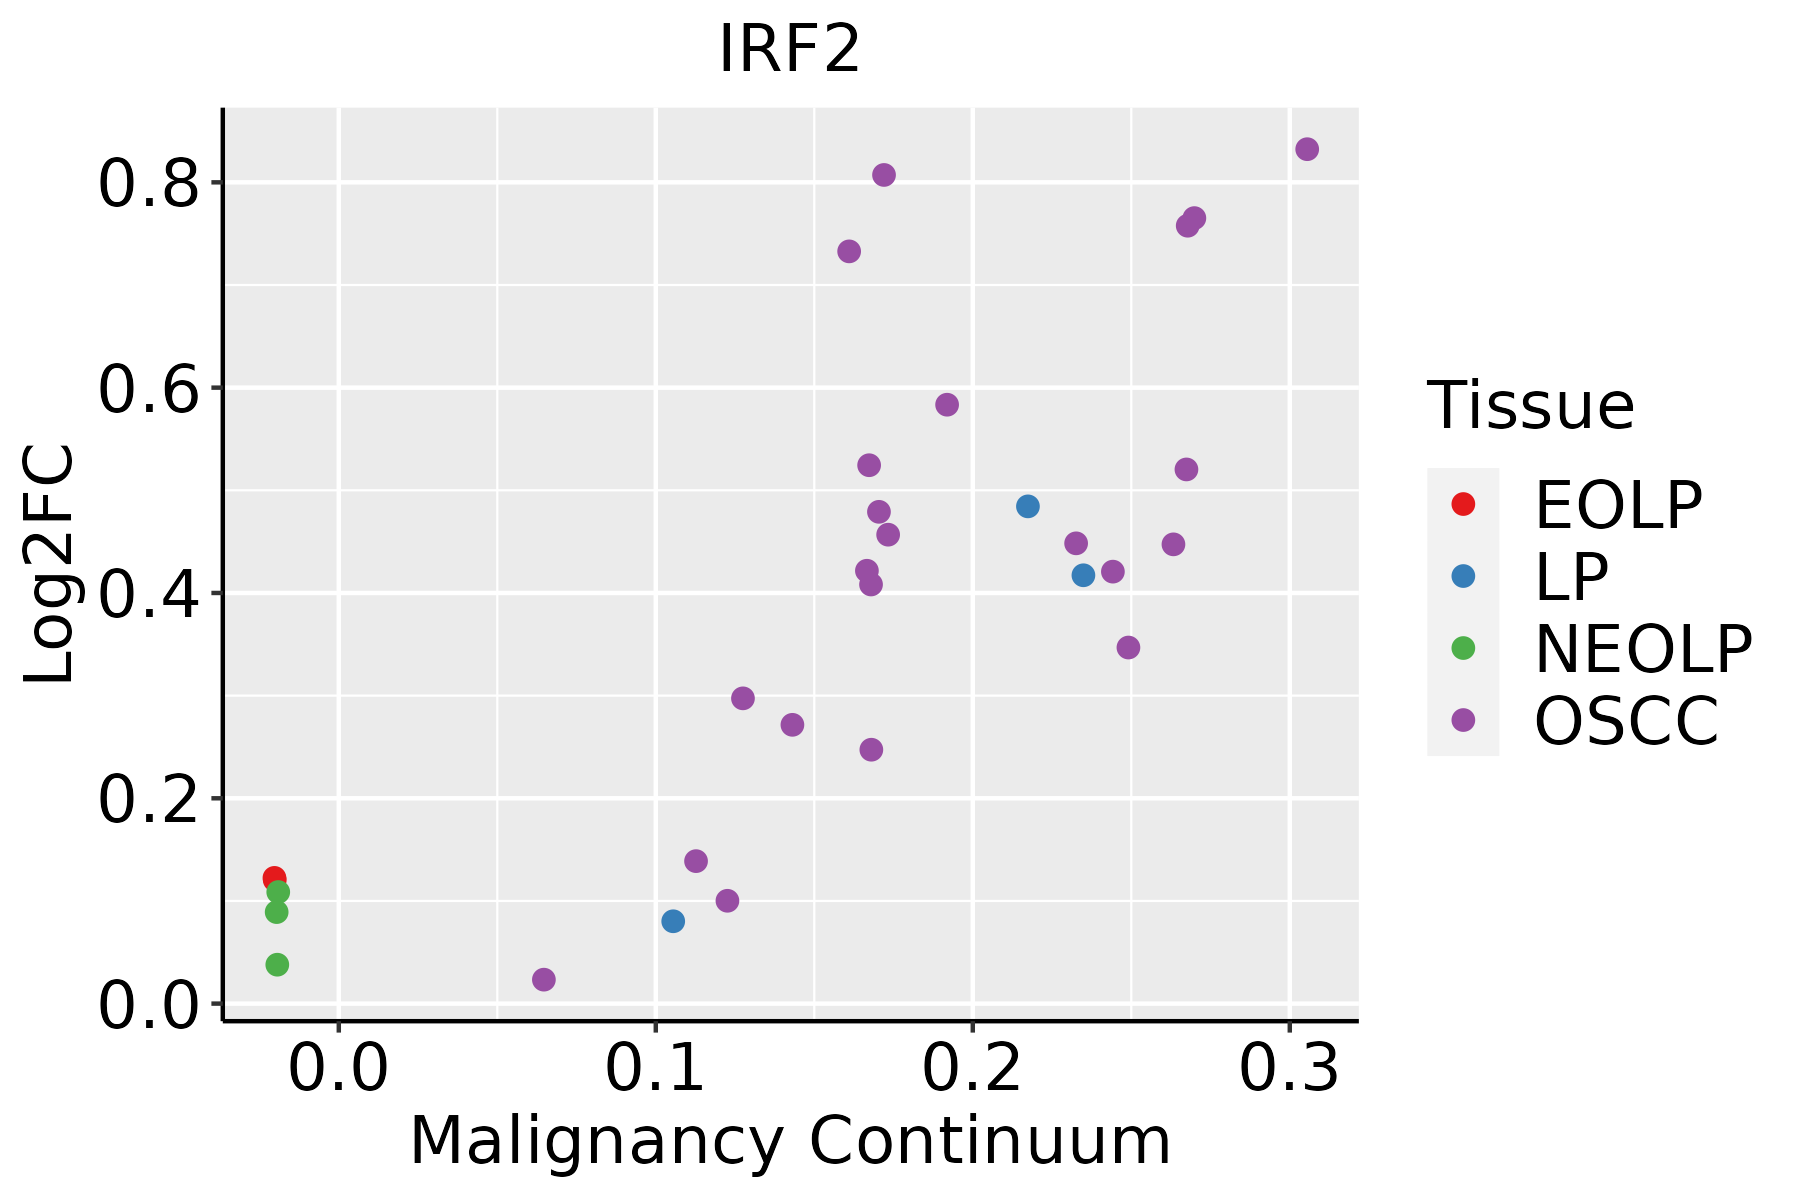 | EOLP: Erosive Oral lichen planus |
| LP: leukoplakia | ||
| NEOLP: Non-erosive oral lichen planus | ||
| OSCC: Oral squamous cell carcinoma |
| ∗log2FC in expression of this searched gene in stem-like cells from each diseased tissue sample relative to stem-like cells in normal samples in each tissue plotted against the malignancy continuum. Samples are colored based on if they are from different disease stage. |
Top |
Malignant transformation related pathway analysis |
| Find out the enriched GO biological processes and KEGG pathways involved in transition from healthy to precancer to cancer |
| Tissue | Disease Stage | Enriched GO biological Processes |
| Colorectum | AD |  |
| Colorectum | SER |  |
| Colorectum | MSS |  |
| Colorectum | MSI-H |  |
| Colorectum | FAP |  |
| ∗Top 15 enriched GO BP terms are showed in the bar plot of each disease state in each tissue. Each row represents a significant GO biological process which is colored according to the -log10(p.adjust). |
| Page: 1 2 3 4 5 6 7 8 9 |
| GO ID | Tissue | Disease Stage | Description | Gene Ratio | Bg Ratio | pvalue | p.adjust | Count |
| GO:1903131 | Colorectum | FAP | mononuclear cell differentiation | 79/2622 | 426/18723 | 5.00e-03 | 3.33e-02 | 79 |
| GO:000961518 | Esophagus | ESCC | response to virus | 238/8552 | 367/18723 | 6.65e-14 | 3.32e-12 | 238 |
| GO:00516075 | Esophagus | ESCC | defense response to virus | 171/8552 | 265/18723 | 3.91e-10 | 1.05e-08 | 171 |
| GO:01405465 | Esophagus | ESCC | defense response to symbiont | 171/8552 | 265/18723 | 3.91e-10 | 1.05e-08 | 171 |
| GO:19031317 | Esophagus | ESCC | mononuclear cell differentiation | 226/8552 | 426/18723 | 1.20e-03 | 5.88e-03 | 226 |
| GO:00300984 | Esophagus | ESCC | lymphocyte differentiation | 192/8552 | 374/18723 | 1.52e-02 | 4.93e-02 | 192 |
| GO:00096155 | Liver | Cirrhotic | response to virus | 126/4634 | 367/18723 | 2.10e-05 | 2.77e-04 | 126 |
| GO:0051607 | Liver | Cirrhotic | defense response to virus | 84/4634 | 265/18723 | 6.02e-03 | 3.00e-02 | 84 |
| GO:0140546 | Liver | Cirrhotic | defense response to symbiont | 84/4634 | 265/18723 | 6.02e-03 | 3.00e-02 | 84 |
| GO:000020921 | Liver | HCC | protein polyubiquitination | 151/7958 | 236/18723 | 1.90e-11 | 7.59e-10 | 151 |
| GO:000961511 | Liver | HCC | response to virus | 210/7958 | 367/18723 | 7.32e-09 | 1.86e-07 | 210 |
| GO:00516071 | Liver | HCC | defense response to virus | 151/7958 | 265/18723 | 1.27e-06 | 1.85e-05 | 151 |
| GO:01405461 | Liver | HCC | defense response to symbiont | 151/7958 | 265/18723 | 1.27e-06 | 1.85e-05 | 151 |
| GO:000961515 | Oral cavity | OSCC | response to virus | 215/7305 | 367/18723 | 1.63e-14 | 9.41e-13 | 215 |
| GO:00516074 | Oral cavity | OSCC | defense response to virus | 154/7305 | 265/18723 | 1.96e-10 | 5.63e-09 | 154 |
| GO:01405464 | Oral cavity | OSCC | defense response to symbiont | 154/7305 | 265/18723 | 1.96e-10 | 5.63e-09 | 154 |
| GO:19031316 | Oral cavity | OSCC | mononuclear cell differentiation | 210/7305 | 426/18723 | 8.44e-06 | 9.02e-05 | 210 |
| GO:00300983 | Oral cavity | OSCC | lymphocyte differentiation | 179/7305 | 374/18723 | 2.74e-04 | 1.74e-03 | 179 |
| GO:190313114 | Oral cavity | EOLP | mononuclear cell differentiation | 88/2218 | 426/18723 | 1.07e-07 | 3.61e-06 | 88 |
| GO:003009812 | Oral cavity | EOLP | lymphocyte differentiation | 76/2218 | 374/18723 | 1.50e-06 | 3.55e-05 | 76 |
| Page: 1 2 |
| Pathway ID | Tissue | Disease Stage | Description | Gene Ratio | Bg Ratio | pvalue | p.adjust | qvalue | Count |
| Page: 1 |
Top |
Cell-cell communication analysis |
| Identification of potential cell-cell interactions between two cell types and their ligand-receptor pairs for different disease states |
| Ligand | Receptor | LRpair | Pathway | Tissue | Disease Stage |
| Page: 1 |
Top |
Single-cell gene regulatory network inference analysis |
| Find out the significant the regulons (TFs) and the target genes of each regulon across cell types for different disease states |
| TF | Cell Type | Tissue | Disease Stage | Target Gene | RSS | Regulon Activity |
| ∗The dot plots of a searched regulon are shown for all cell subpopulations in each disease state of each tissue based on the regulon specific score inferred using pySCENIC and by calculating the average expression. |
| Page: 1 |
Top |
Somatic mutation of malignant transformation related genes |
| Annotation of somatic variants for genes involved in malignant transformation |
| Hugo Symbol | Variant Class | Variant Classification | dbSNP RS | HGVSc | HGVSp | HGVSp Short | SWISSPROT | BIOTYPE | SIFT | PolyPhen | Tumor Sample Barcode | Tissue | Histology | Sex | Age | Stage | Therapy Types | Drugs | Outcome |
| IRF2 | SNV | Missense_Mutation | c.989C>T | p.Thr330Ile | p.T330I | P14316 | protein_coding | deleterious(0.05) | benign(0.057) | TCGA-BH-A18G-01 | Breast | breast invasive carcinoma | Female | >=65 | I/II | Unknown | Unknown | SD | |
| IRF2 | SNV | Missense_Mutation | novel | c.1016C>T | p.Ser339Leu | p.S339L | P14316 | protein_coding | deleterious(0) | probably_damaging(0.945) | TCGA-2W-A8YY-01 | Cervix | cervical & endocervical cancer | Female | <65 | I/II | Chemotherapy | cisplatin | CR |
| IRF2 | SNV | Missense_Mutation | c.128G>C | p.Arg43Thr | p.R43T | P14316 | protein_coding | deleterious(0) | probably_damaging(1) | TCGA-DR-A0ZM-01 | Cervix | cervical & endocervical cancer | Female | <65 | III/IV | Unspecific | Cisplatin | SD | |
| IRF2 | SNV | Missense_Mutation | rs761561042 | c.893C>T | p.Pro298Leu | p.P298L | P14316 | protein_coding | tolerated(0.05) | probably_damaging(0.999) | TCGA-MA-AA42-01 | Cervix | cervical & endocervical cancer | Female | >=65 | I/II | Unknown | Unknown | SD |
| IRF2 | insertion | Nonsense_Mutation | novel | c.997_998insAATAG | p.Ser333LysfsTer2 | p.S333Kfs*2 | P14316 | protein_coding | TCGA-DS-A1OD-01 | Cervix | cervical & endocervical cancer | Female | <65 | I/II | Chemotherapy | cisplatin | SD | ||
| IRF2 | SNV | Missense_Mutation | c.323N>G | p.Val108Gly | p.V108G | P14316 | protein_coding | deleterious(0) | probably_damaging(0.999) | TCGA-AA-3979-01 | Colorectum | colon adenocarcinoma | Male | >=65 | I/II | Unknown | Unknown | SD | |
| IRF2 | SNV | Missense_Mutation | c.300N>T | p.Lys100Asn | p.K100N | P14316 | protein_coding | tolerated(0.26) | probably_damaging(0.999) | TCGA-AA-A010-01 | Colorectum | colon adenocarcinoma | Female | <65 | I/II | Chemotherapy | folinic | CR | |
| IRF2 | SNV | Missense_Mutation | c.122N>T | p.Ala41Val | p.A41V | P14316 | protein_coding | deleterious(0) | probably_damaging(0.999) | TCGA-AA-A010-01 | Colorectum | colon adenocarcinoma | Female | <65 | I/II | Chemotherapy | folinic | CR | |
| IRF2 | SNV | Missense_Mutation | c.25N>T | p.Arg9Cys | p.R9C | P14316 | protein_coding | deleterious(0) | probably_damaging(1) | TCGA-AZ-4315-01 | Colorectum | colon adenocarcinoma | Male | <65 | I/II | Unknown | Unknown | SD | |
| IRF2 | SNV | Missense_Mutation | rs753833490 | c.991N>T | p.Arg331Trp | p.R331W | P14316 | protein_coding | deleterious(0) | probably_damaging(0.999) | TCGA-CM-6162-01 | Colorectum | colon adenocarcinoma | Female | <65 | III/IV | Chemotherapy | oxaliplatin | SD |
| Page: 1 2 3 4 5 6 7 |
Top |
Related drugs of malignant transformation related genes |
| Identification of chemicals and drugs interact with genes involved in malignant transfromation |
| (DGIdb 4.0) |
| Entrez ID | Symbol | Category | Interaction Types | Drug Claim Name | Drug Name | PMIDs |
| 3660 | IRF2 | CLINICALLY ACTIONABLE, TRANSCRIPTION FACTOR | IFN | 16241857,16533423 | ||
| 3660 | IRF2 | CLINICALLY ACTIONABLE, TRANSCRIPTION FACTOR | INTERFERON GAMMA | 10859338 |
| Page: 1 |

Copyright 2023-Present -The University of Texas Health Science Center at Houston |