
|
|||||
|
 | |
| |
| |
| |
| |
| |
|
Gene: IREB2 |
Gene summary for IREB2 |
| Gene information | Species | Human | Gene symbol | IREB2 | Gene ID | 3658 |
| Gene name | iron responsive element binding protein 2 | |
| Gene Alias | ACO3 | |
| Cytomap | 15q25.1 | |
| Gene Type | protein-coding | GO ID | GO:0000041 | UniProtAcc | P48200 |
Top |
Malignant transformation analysis |
| Identification of the aberrant gene expression in precancerous and cancerous lesions by comparing the gene expression of stem-like cells in diseased tissues with normal stem cells |
| Entrez ID | Symbol | Replicates | Species | Organ | Tissue | Adj P-value | Log2FC | Malignancy |
| 3658 | IREB2 | LZE4T | Human | Esophagus | ESCC | 1.90e-12 | 3.21e-01 | 0.0811 |
| 3658 | IREB2 | LZE5T | Human | Esophagus | ESCC | 4.08e-04 | 3.13e-01 | 0.0514 |
| 3658 | IREB2 | LZE7T | Human | Esophagus | ESCC | 7.78e-19 | 6.98e-01 | 0.0667 |
| 3658 | IREB2 | LZE8T | Human | Esophagus | ESCC | 5.52e-06 | 2.61e-01 | 0.067 |
| 3658 | IREB2 | LZE20T | Human | Esophagus | ESCC | 2.73e-04 | 7.69e-02 | 0.0662 |
| 3658 | IREB2 | LZE24T | Human | Esophagus | ESCC | 3.83e-11 | 2.35e-01 | 0.0596 |
| 3658 | IREB2 | LZE21T | Human | Esophagus | ESCC | 2.45e-04 | 2.89e-01 | 0.0655 |
| 3658 | IREB2 | LZE6T | Human | Esophagus | ESCC | 1.27e-04 | 1.59e-01 | 0.0845 |
| 3658 | IREB2 | P1T-E | Human | Esophagus | ESCC | 4.01e-05 | 3.87e-01 | 0.0875 |
| 3658 | IREB2 | P2T-E | Human | Esophagus | ESCC | 1.27e-20 | 3.27e-01 | 0.1177 |
| 3658 | IREB2 | P4T-E | Human | Esophagus | ESCC | 7.50e-17 | 4.58e-01 | 0.1323 |
| 3658 | IREB2 | P5T-E | Human | Esophagus | ESCC | 5.56e-07 | 1.49e-01 | 0.1327 |
| 3658 | IREB2 | P8T-E | Human | Esophagus | ESCC | 1.95e-20 | 4.86e-01 | 0.0889 |
| 3658 | IREB2 | P9T-E | Human | Esophagus | ESCC | 9.88e-16 | 3.76e-01 | 0.1131 |
| 3658 | IREB2 | P10T-E | Human | Esophagus | ESCC | 1.89e-37 | 6.59e-01 | 0.116 |
| 3658 | IREB2 | P11T-E | Human | Esophagus | ESCC | 2.92e-07 | 2.18e-01 | 0.1426 |
| 3658 | IREB2 | P12T-E | Human | Esophagus | ESCC | 5.52e-30 | 5.74e-01 | 0.1122 |
| 3658 | IREB2 | P15T-E | Human | Esophagus | ESCC | 8.71e-24 | 5.78e-01 | 0.1149 |
| 3658 | IREB2 | P16T-E | Human | Esophagus | ESCC | 1.75e-24 | 4.95e-01 | 0.1153 |
| 3658 | IREB2 | P19T-E | Human | Esophagus | ESCC | 1.68e-02 | 3.87e-01 | 0.1662 |
| Page: 1 2 3 4 5 |
| Tissue | Expression Dynamics | Abbreviation |
| Esophagus | 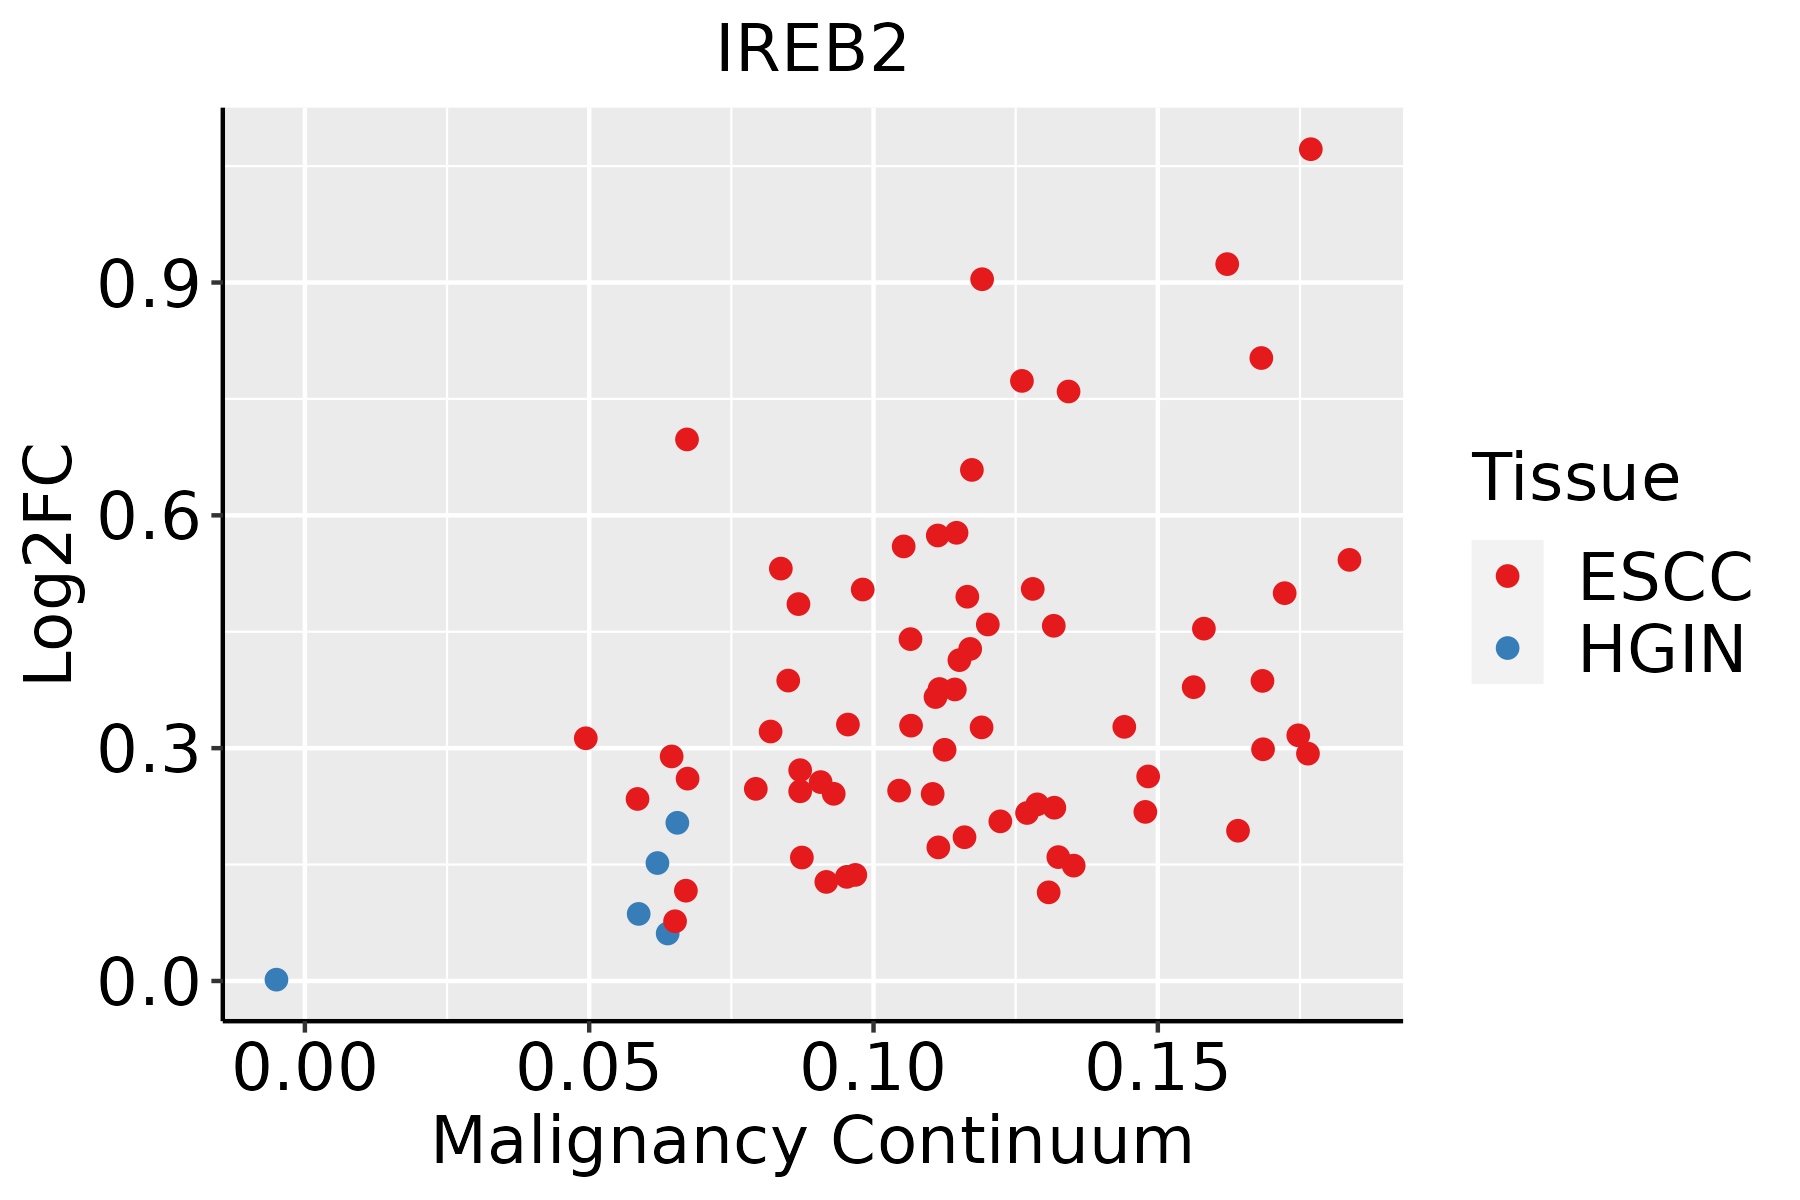 | ESCC: Esophageal squamous cell carcinoma |
| HGIN: High-grade intraepithelial neoplasias | ||
| LGIN: Low-grade intraepithelial neoplasias | ||
| Liver | 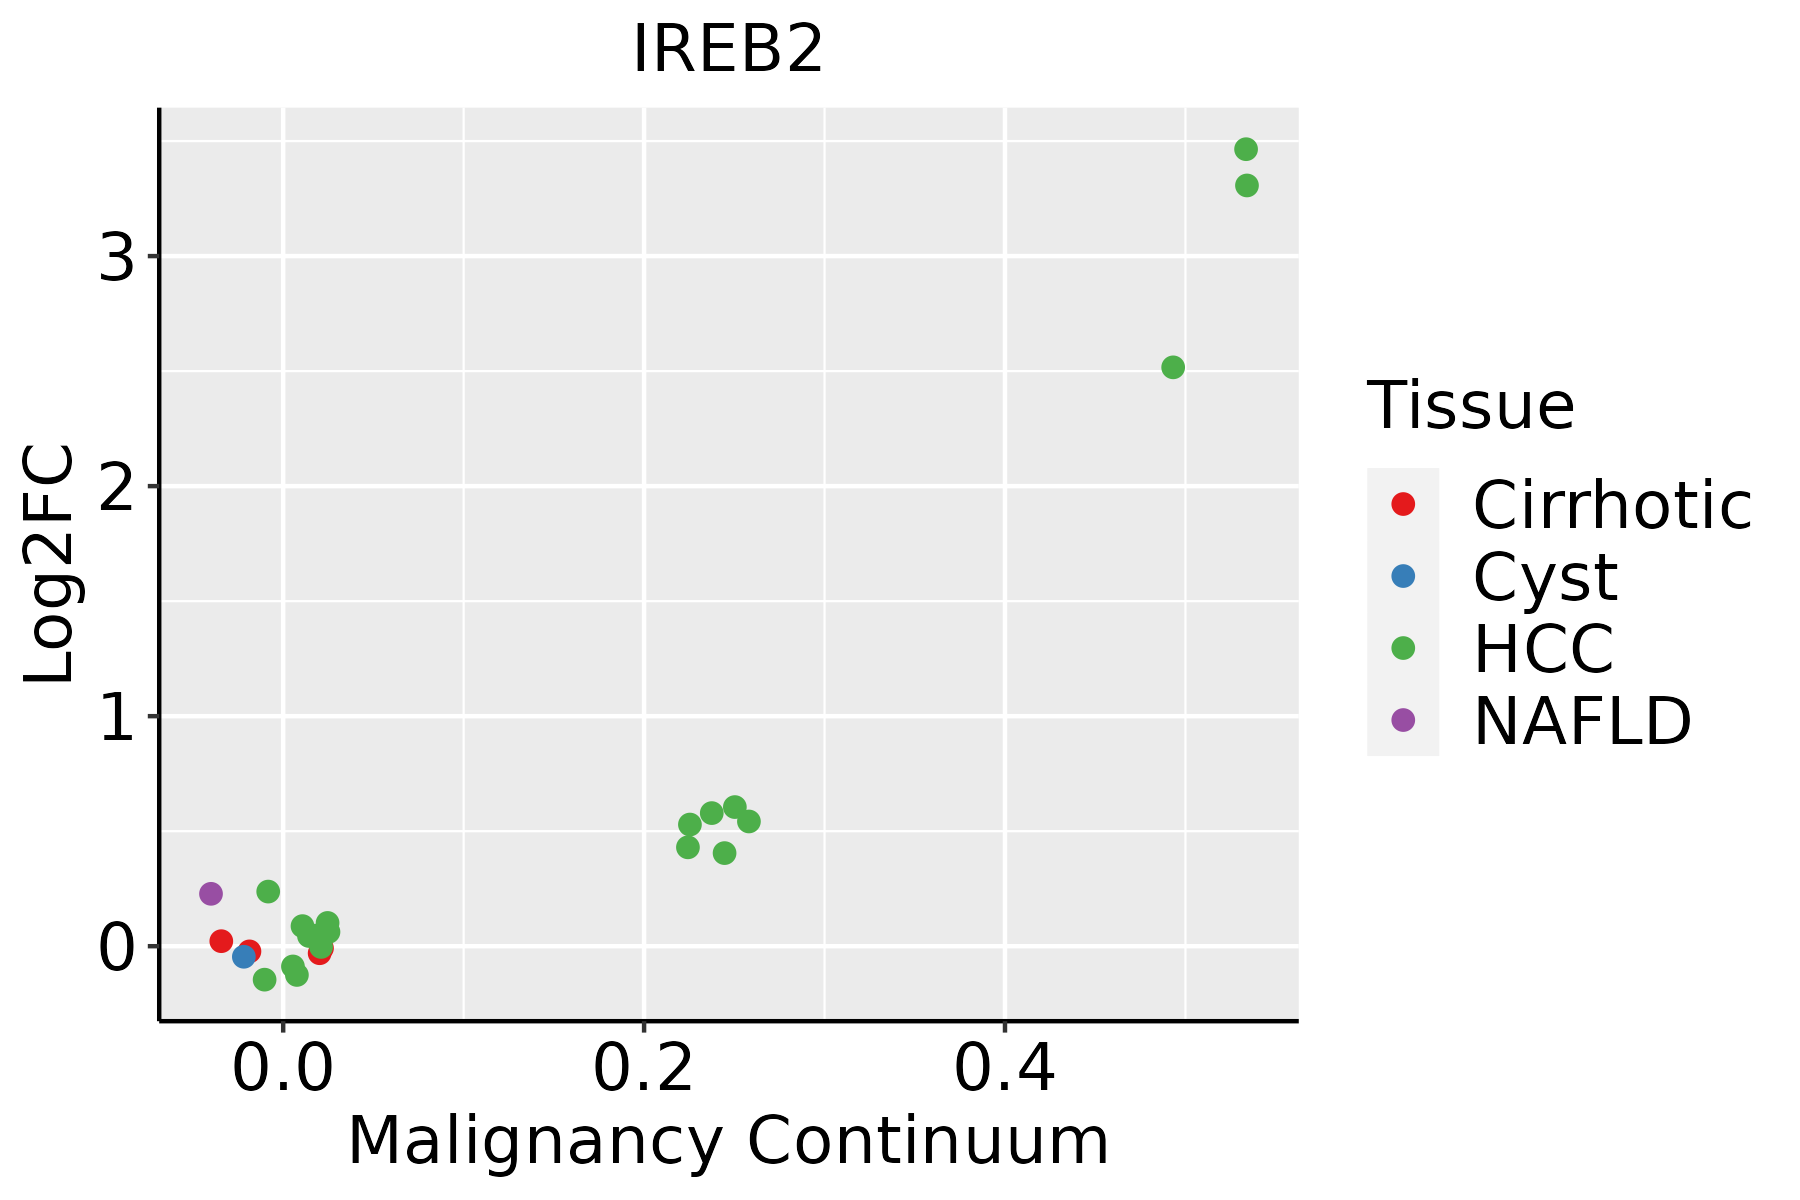 | HCC: Hepatocellular carcinoma |
| NAFLD: Non-alcoholic fatty liver disease | ||
| Oral Cavity |  | EOLP: Erosive Oral lichen planus |
| LP: leukoplakia | ||
| NEOLP: Non-erosive oral lichen planus | ||
| OSCC: Oral squamous cell carcinoma | ||
| Thyroid | 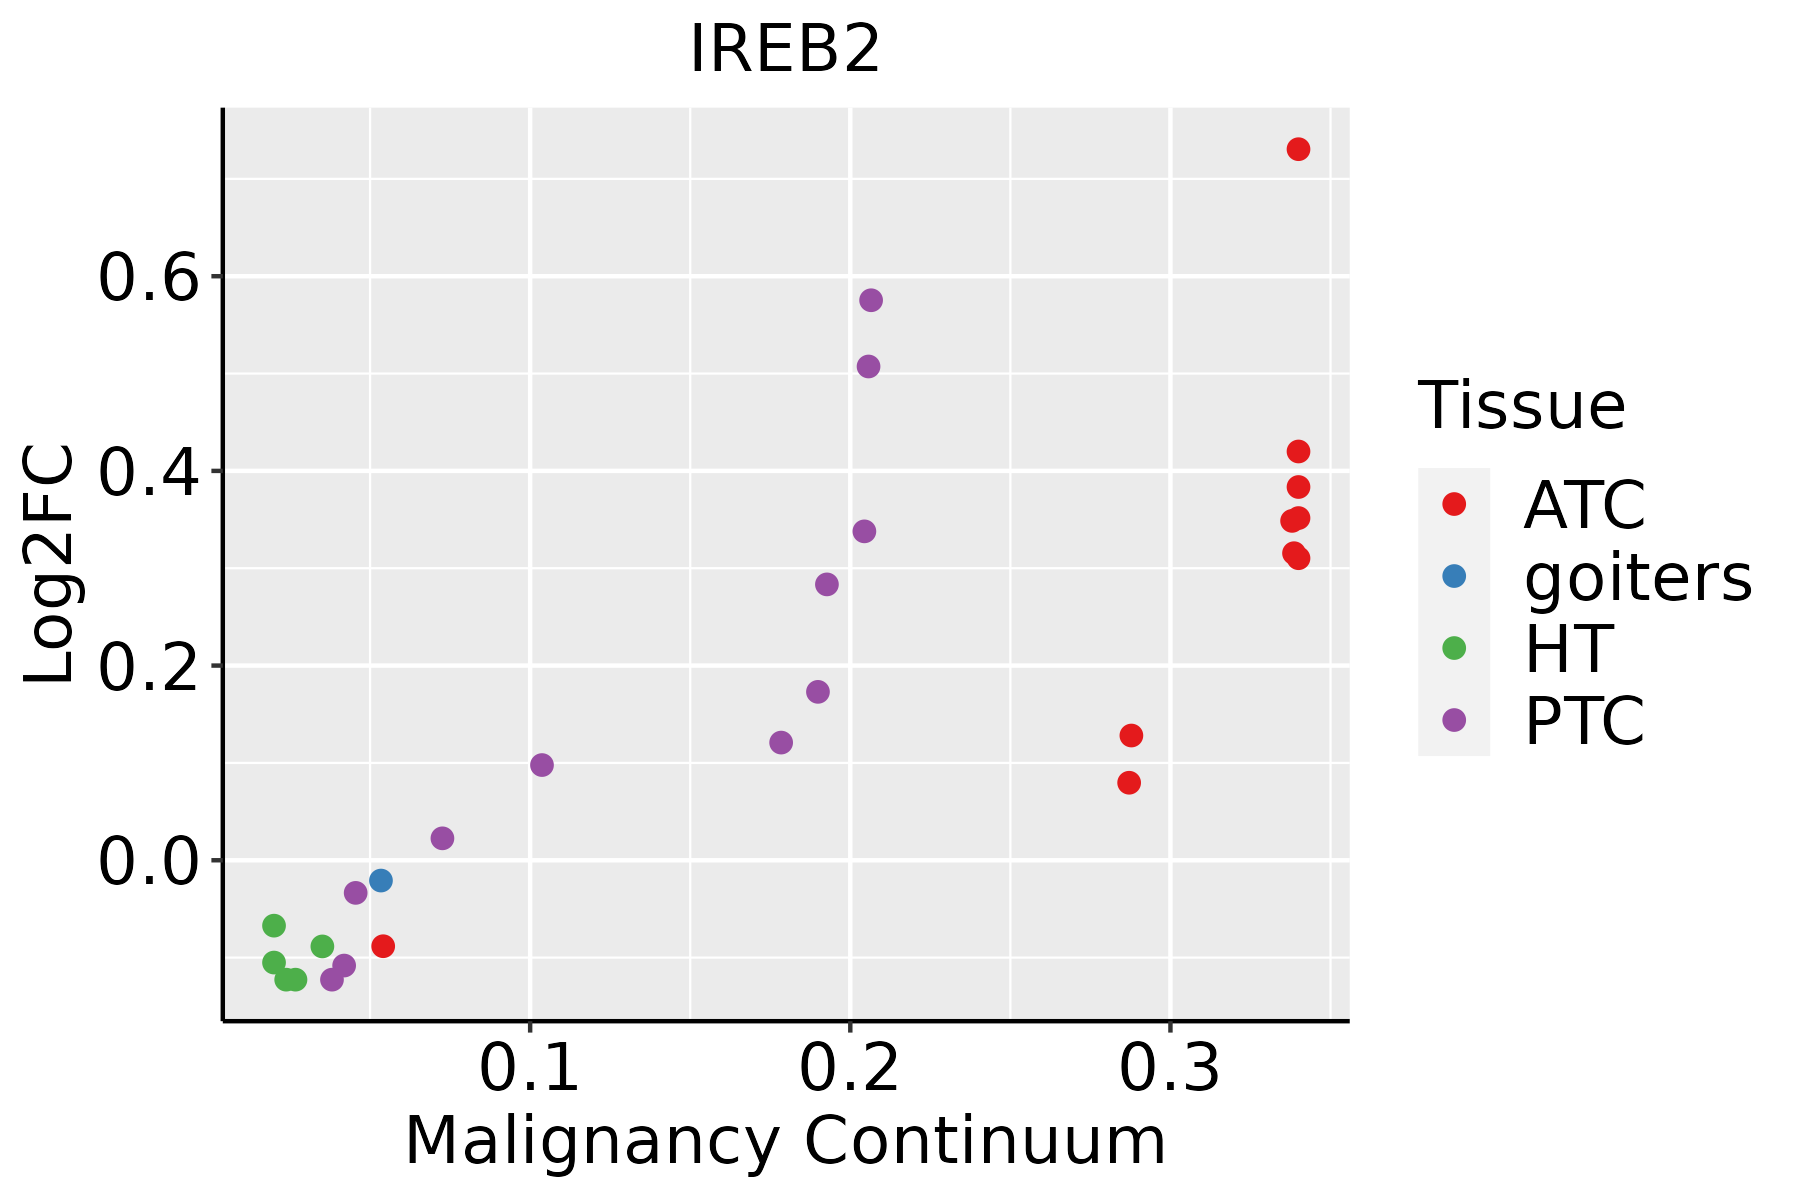 | ATC: Anaplastic thyroid cancer |
| HT: Hashimoto's thyroiditis | ||
| PTC: Papillary thyroid cancer |
| ∗log2FC in expression of this searched gene in stem-like cells from each diseased tissue sample relative to stem-like cells in normal samples in each tissue plotted against the malignancy continuum. Samples are colored based on if they are from different disease stage. |
Top |
Malignant transformation related pathway analysis |
| Find out the enriched GO biological processes and KEGG pathways involved in transition from healthy to precancer to cancer |
| Tissue | Disease Stage | Enriched GO biological Processes |
| Colorectum | AD |  |
| Colorectum | SER |  |
| Colorectum | MSS |  |
| Colorectum | MSI-H |  |
| Colorectum | FAP |  |
| ∗Top 15 enriched GO BP terms are showed in the bar plot of each disease state in each tissue. Each row represents a significant GO biological process which is colored according to the -log10(p.adjust). |
| Page: 1 2 3 4 5 6 7 8 9 |
| GO ID | Tissue | Disease Stage | Description | Gene Ratio | Bg Ratio | pvalue | p.adjust | Count |
| GO:0006091110 | Esophagus | ESCC | generation of precursor metabolites and energy | 331/8552 | 490/18723 | 3.86e-23 | 8.45e-21 | 331 |
| GO:0045333110 | Esophagus | ESCC | cellular respiration | 173/8552 | 230/18723 | 4.53e-20 | 5.99e-18 | 173 |
| GO:0009060110 | Esophagus | ESCC | aerobic respiration | 145/8552 | 189/18723 | 2.16e-18 | 2.21e-16 | 145 |
| GO:0015980110 | Esophagus | ESCC | energy derivation by oxidation of organic compounds | 220/8552 | 318/18723 | 1.20e-17 | 1.09e-15 | 220 |
| GO:0006417111 | Esophagus | ESCC | regulation of translation | 304/8552 | 468/18723 | 1.53e-17 | 1.33e-15 | 304 |
| GO:0030099111 | Esophagus | ESCC | myeloid cell differentiation | 232/8552 | 381/18723 | 1.22e-09 | 2.90e-08 | 232 |
| GO:0002262111 | Esophagus | ESCC | myeloid cell homeostasis | 104/8552 | 157/18723 | 1.49e-07 | 2.36e-06 | 104 |
| GO:0034101111 | Esophagus | ESCC | erythrocyte homeostasis | 88/8552 | 129/18723 | 1.81e-07 | 2.84e-06 | 88 |
| GO:00060997 | Esophagus | ESCC | tricarboxylic acid cycle | 27/8552 | 30/18723 | 4.54e-07 | 6.15e-06 | 27 |
| GO:0048872111 | Esophagus | ESCC | homeostasis of number of cells | 163/8552 | 272/18723 | 1.40e-06 | 1.69e-05 | 163 |
| GO:000257317 | Esophagus | ESCC | myeloid leukocyte differentiation | 128/8552 | 208/18723 | 2.75e-06 | 3.15e-05 | 128 |
| GO:00097919 | Esophagus | ESCC | post-embryonic development | 56/8552 | 80/18723 | 9.08e-06 | 8.71e-05 | 56 |
| GO:005507617 | Esophagus | ESCC | transition metal ion homeostasis | 87/8552 | 138/18723 | 2.85e-05 | 2.37e-04 | 87 |
| GO:00469169 | Esophagus | ESCC | cellular transition metal ion homeostasis | 70/8552 | 115/18723 | 7.28e-04 | 3.79e-03 | 70 |
| GO:00067791 | Esophagus | ESCC | porphyrin-containing compound biosynthetic process | 23/8552 | 31/18723 | 1.20e-03 | 5.88e-03 | 23 |
| GO:00330141 | Esophagus | ESCC | tetrapyrrole biosynthetic process | 23/8552 | 31/18723 | 1.20e-03 | 5.88e-03 | 23 |
| GO:00461482 | Esophagus | ESCC | pigment biosynthetic process | 40/8552 | 62/18723 | 2.14e-03 | 9.54e-03 | 40 |
| GO:00723503 | Esophagus | ESCC | tricarboxylic acid metabolic process | 12/8552 | 14/18723 | 2.51e-03 | 1.08e-02 | 12 |
| GO:00067832 | Esophagus | ESCC | heme biosynthetic process | 20/8552 | 27/18723 | 2.61e-03 | 1.11e-02 | 20 |
| GO:00550729 | Esophagus | ESCC | iron ion homeostasis | 52/8552 | 85/18723 | 2.86e-03 | 1.21e-02 | 52 |
| Page: 1 2 3 4 5 6 |
| Pathway ID | Tissue | Disease Stage | Description | Gene Ratio | Bg Ratio | pvalue | p.adjust | qvalue | Count |
| Page: 1 |
Top |
Cell-cell communication analysis |
| Identification of potential cell-cell interactions between two cell types and their ligand-receptor pairs for different disease states |
| Ligand | Receptor | LRpair | Pathway | Tissue | Disease Stage |
| Page: 1 |
Top |
Single-cell gene regulatory network inference analysis |
| Find out the significant the regulons (TFs) and the target genes of each regulon across cell types for different disease states |
| TF | Cell Type | Tissue | Disease Stage | Target Gene | RSS | Regulon Activity |
| ∗The dot plots of a searched regulon are shown for all cell subpopulations in each disease state of each tissue based on the regulon specific score inferred using pySCENIC and by calculating the average expression. |
| Page: 1 |
Top |
Somatic mutation of malignant transformation related genes |
| Annotation of somatic variants for genes involved in malignant transformation |
| Hugo Symbol | Variant Class | Variant Classification | dbSNP RS | HGVSc | HGVSp | HGVSp Short | SWISSPROT | BIOTYPE | SIFT | PolyPhen | Tumor Sample Barcode | Tissue | Histology | Sex | Age | Stage | Therapy Types | Drugs | Outcome |
| IREB2 | SNV | Missense_Mutation | c.452N>G | p.Gln151Arg | p.Q151R | protein_coding | tolerated(0.24) | benign(0.003) | TCGA-A8-A0A7-01 | Breast | breast invasive carcinoma | Female | <65 | I/II | Unknown | Unknown | SD | ||
| IREB2 | SNV | Missense_Mutation | c.2649G>C | p.Leu883Phe | p.L883F | protein_coding | deleterious(0) | probably_damaging(0.998) | TCGA-AC-A23H-01 | Breast | breast invasive carcinoma | Female | >=65 | I/II | Unknown | Unknown | PD | ||
| IREB2 | SNV | Missense_Mutation | novel | c.248C>T | p.Ala83Val | p.A83V | protein_coding | deleterious(0.02) | benign(0.429) | TCGA-AN-A046-01 | Breast | breast invasive carcinoma | Female | >=65 | I/II | Unknown | Unknown | SD | |
| IREB2 | SNV | Missense_Mutation | c.306N>A | p.Met102Ile | p.M102I | protein_coding | tolerated(0.06) | benign(0.055) | TCGA-AN-A0FT-01 | Breast | breast invasive carcinoma | Female | <65 | I/II | Unknown | Unknown | SD | ||
| IREB2 | SNV | Missense_Mutation | novel | c.956N>A | p.Gly319Glu | p.G319E | protein_coding | deleterious(0) | probably_damaging(0.948) | TCGA-BH-A0B6-01 | Breast | breast invasive carcinoma | Female | <65 | I/II | Unknown | Unknown | SD | |
| IREB2 | SNV | Missense_Mutation | rs200306100 | c.2471C>T | p.Thr824Met | p.T824M | protein_coding | tolerated(0.11) | benign(0.014) | TCGA-D8-A13Y-01 | Breast | breast invasive carcinoma | Female | <65 | I/II | Chemotherapy | doxorubicin | SD | |
| IREB2 | SNV | Missense_Mutation | c.1106N>G | p.Thr369Ser | p.T369S | protein_coding | deleterious(0.01) | benign(0.223) | TCGA-D8-A143-01 | Breast | breast invasive carcinoma | Female | <65 | I/II | Chemotherapy | doxorubicin | SD | ||
| IREB2 | SNV | Missense_Mutation | c.2221C>A | p.His741Asn | p.H741N | protein_coding | tolerated(0.07) | probably_damaging(0.996) | TCGA-D8-A1XQ-01 | Breast | breast invasive carcinoma | Female | >=65 | I/II | Unknown | Unknown | SD | ||
| IREB2 | SNV | Missense_Mutation | c.1682N>C | p.Gly561Ala | p.G561A | protein_coding | deleterious(0) | probably_damaging(0.998) | TCGA-D8-A27G-01 | Breast | breast invasive carcinoma | Female | >=65 | I/II | Unknown | Unknown | SD | ||
| IREB2 | SNV | Missense_Mutation | novel | c.1864N>T | p.Arg622Cys | p.R622C | protein_coding | deleterious(0.05) | probably_damaging(0.999) | TCGA-D8-A27V-01 | Breast | breast invasive carcinoma | Female | <65 | I/II | Hormone Therapy | tamoxiphen | SD |
| Page: 1 2 3 4 5 6 7 8 9 10 11 |
Top |
Related drugs of malignant transformation related genes |
| Identification of chemicals and drugs interact with genes involved in malignant transfromation |
| (DGIdb 4.0) |
| Entrez ID | Symbol | Category | Interaction Types | Drug Claim Name | Drug Name | PMIDs |
| Page: 1 |

Copyright 2023-Present -The University of Texas Health Science Center at Houston |