
|
|||||
|
 | |
| |
| |
| |
| |
| |
|
Gene: IRAK4 |
Gene summary for IRAK4 |
| Gene information | Species | Human | Gene symbol | IRAK4 | Gene ID | 51135 |
| Gene name | interleukin 1 receptor associated kinase 4 | |
| Gene Alias | IMD67 | |
| Cytomap | 12q12 | |
| Gene Type | protein-coding | GO ID | GO:0000165 | UniProtAcc | B4E359 |
Top |
Malignant transformation analysis |
| Identification of the aberrant gene expression in precancerous and cancerous lesions by comparing the gene expression of stem-like cells in diseased tissues with normal stem cells |
| Entrez ID | Symbol | Replicates | Species | Organ | Tissue | Adj P-value | Log2FC | Malignancy |
| 51135 | IRAK4 | LZE4T | Human | Esophagus | ESCC | 7.09e-06 | 2.95e-01 | 0.0811 |
| 51135 | IRAK4 | LZE7T | Human | Esophagus | ESCC | 6.09e-08 | 4.48e-01 | 0.0667 |
| 51135 | IRAK4 | LZE20T | Human | Esophagus | ESCC | 6.30e-14 | 3.22e-01 | 0.0662 |
| 51135 | IRAK4 | LZE21D1 | Human | Esophagus | HGIN | 4.61e-04 | 3.04e-01 | 0.0632 |
| 51135 | IRAK4 | LZE22D1 | Human | Esophagus | HGIN | 2.05e-02 | 1.61e-01 | 0.0595 |
| 51135 | IRAK4 | LZE22T | Human | Esophagus | ESCC | 1.39e-02 | 2.77e-01 | 0.068 |
| 51135 | IRAK4 | LZE24T | Human | Esophagus | ESCC | 7.73e-13 | 3.63e-01 | 0.0596 |
| 51135 | IRAK4 | LZE21T | Human | Esophagus | ESCC | 3.98e-02 | 2.41e-01 | 0.0655 |
| 51135 | IRAK4 | P1T-E | Human | Esophagus | ESCC | 4.48e-17 | 8.75e-01 | 0.0875 |
| 51135 | IRAK4 | P2T-E | Human | Esophagus | ESCC | 4.43e-22 | 4.79e-01 | 0.1177 |
| 51135 | IRAK4 | P4T-E | Human | Esophagus | ESCC | 2.88e-32 | 9.00e-01 | 0.1323 |
| 51135 | IRAK4 | P5T-E | Human | Esophagus | ESCC | 2.26e-12 | 2.64e-01 | 0.1327 |
| 51135 | IRAK4 | P8T-E | Human | Esophagus | ESCC | 5.70e-19 | 2.23e-01 | 0.0889 |
| 51135 | IRAK4 | P9T-E | Human | Esophagus | ESCC | 8.26e-07 | 1.88e-01 | 0.1131 |
| 51135 | IRAK4 | P10T-E | Human | Esophagus | ESCC | 2.82e-19 | 3.21e-01 | 0.116 |
| 51135 | IRAK4 | P12T-E | Human | Esophagus | ESCC | 2.19e-20 | 2.71e-01 | 0.1122 |
| 51135 | IRAK4 | P15T-E | Human | Esophagus | ESCC | 1.04e-15 | 3.90e-01 | 0.1149 |
| 51135 | IRAK4 | P16T-E | Human | Esophagus | ESCC | 1.73e-11 | 1.60e-01 | 0.1153 |
| 51135 | IRAK4 | P17T-E | Human | Esophagus | ESCC | 1.80e-02 | 2.56e-01 | 0.1278 |
| 51135 | IRAK4 | P20T-E | Human | Esophagus | ESCC | 2.57e-20 | 4.30e-01 | 0.1124 |
| Page: 1 2 3 4 5 |
| Tissue | Expression Dynamics | Abbreviation |
| Esophagus | 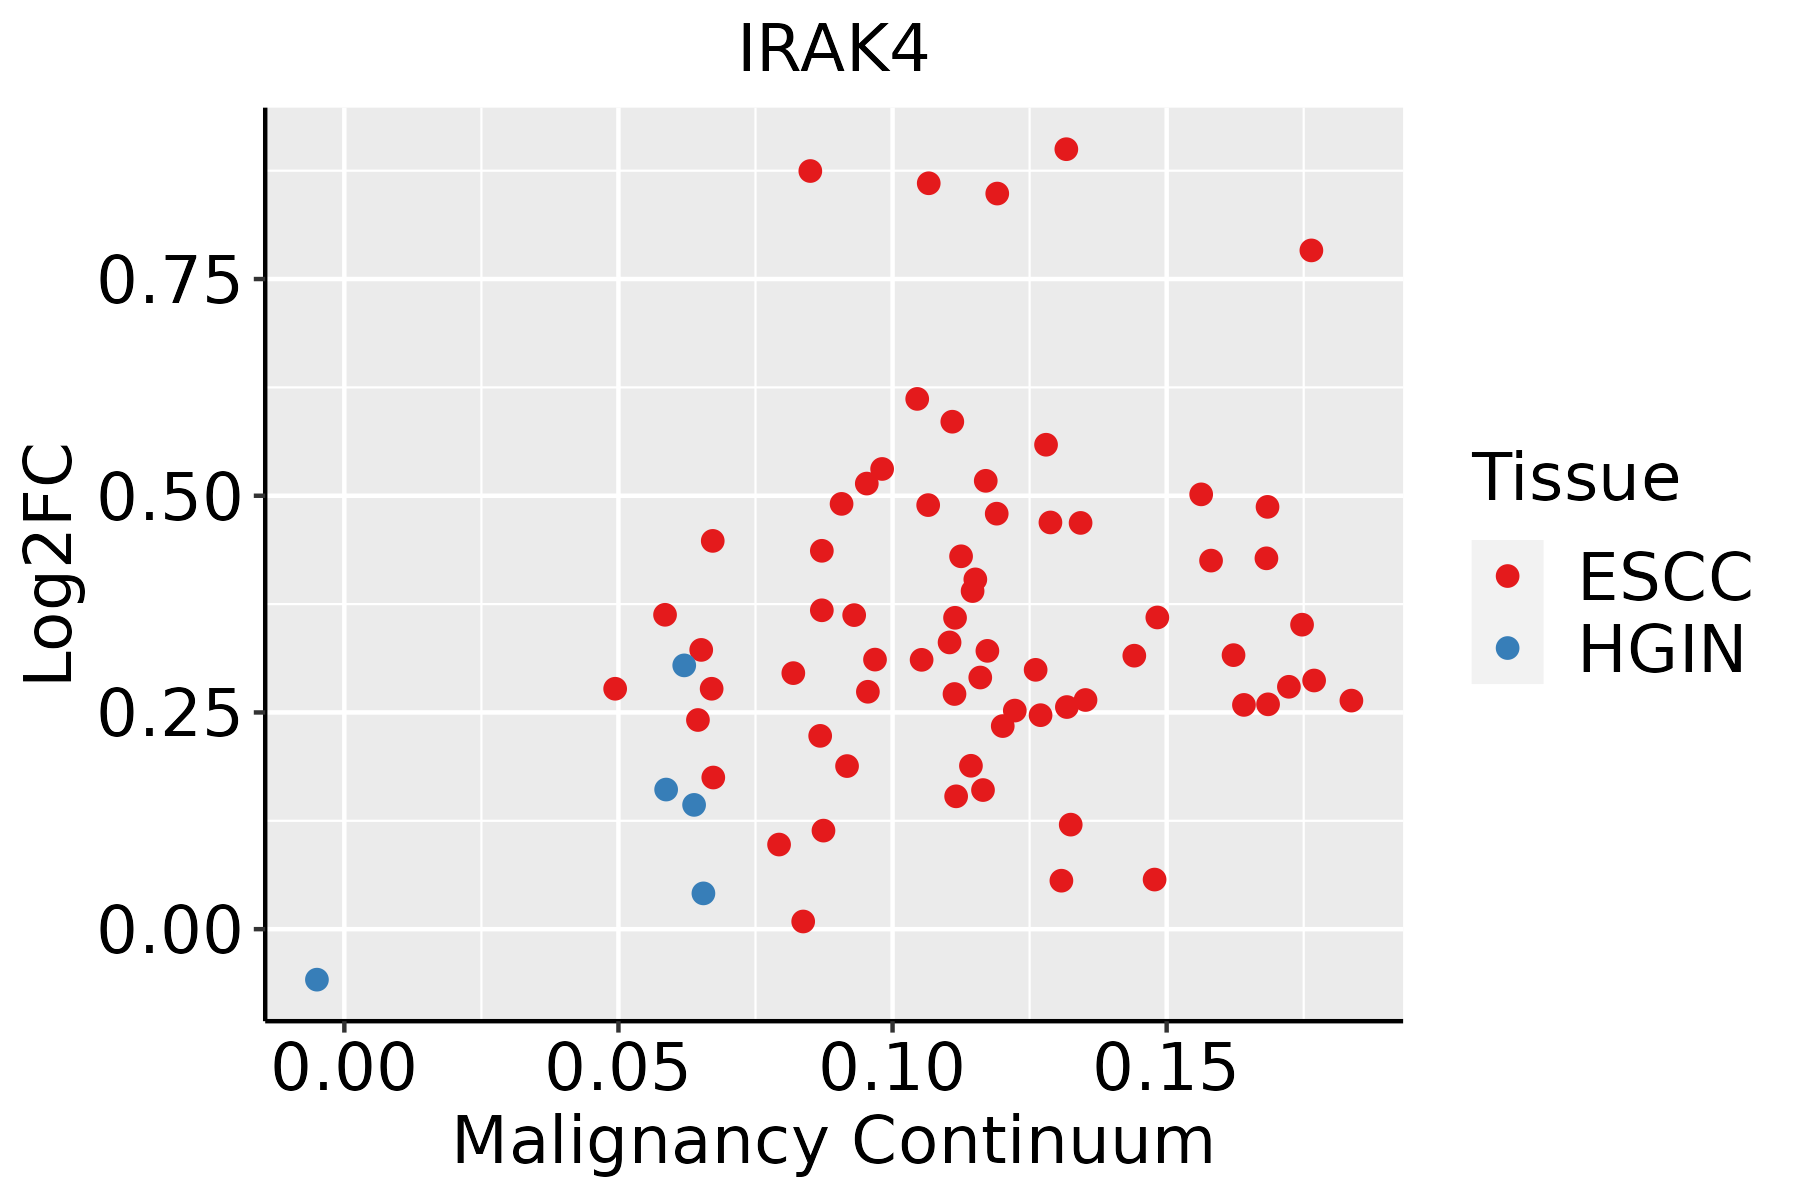 | ESCC: Esophageal squamous cell carcinoma |
| HGIN: High-grade intraepithelial neoplasias | ||
| LGIN: Low-grade intraepithelial neoplasias | ||
| Liver | 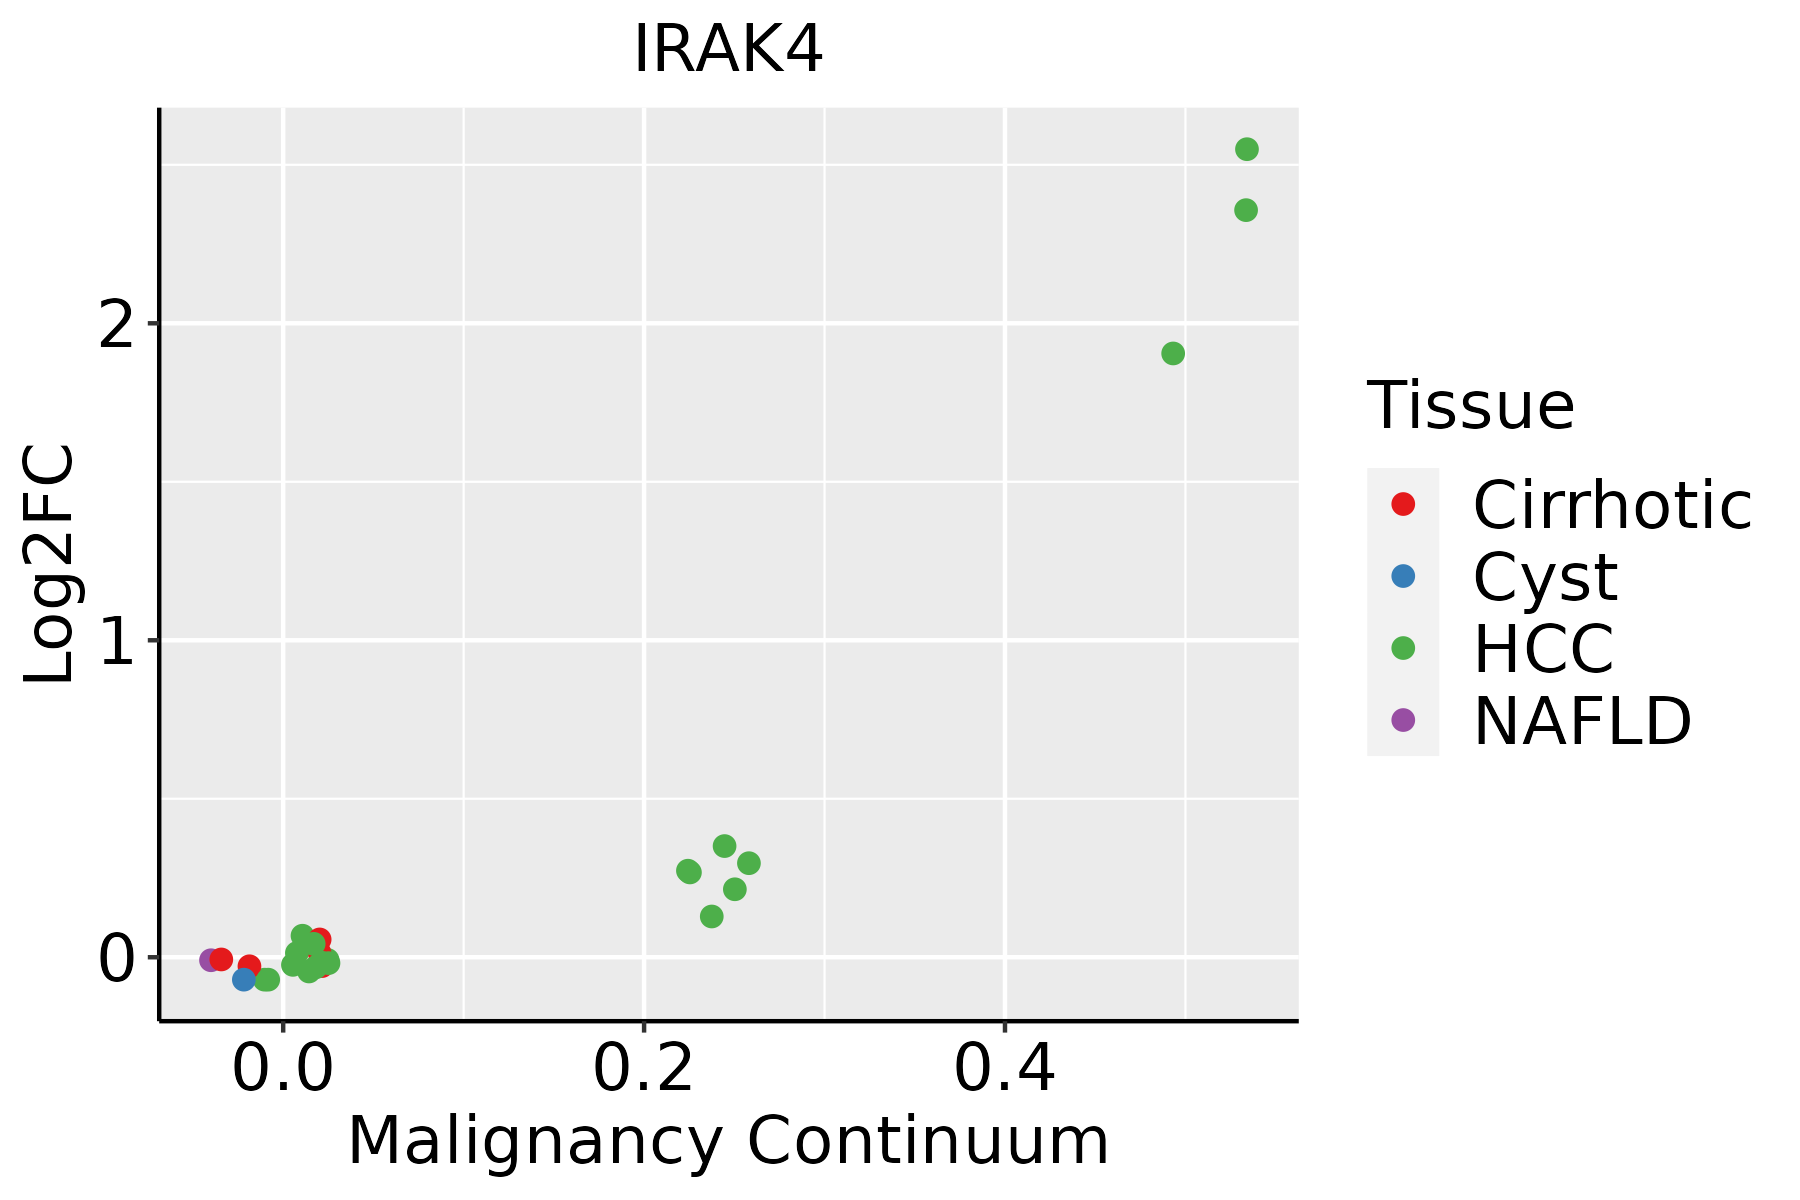 | HCC: Hepatocellular carcinoma |
| NAFLD: Non-alcoholic fatty liver disease | ||
| Thyroid | 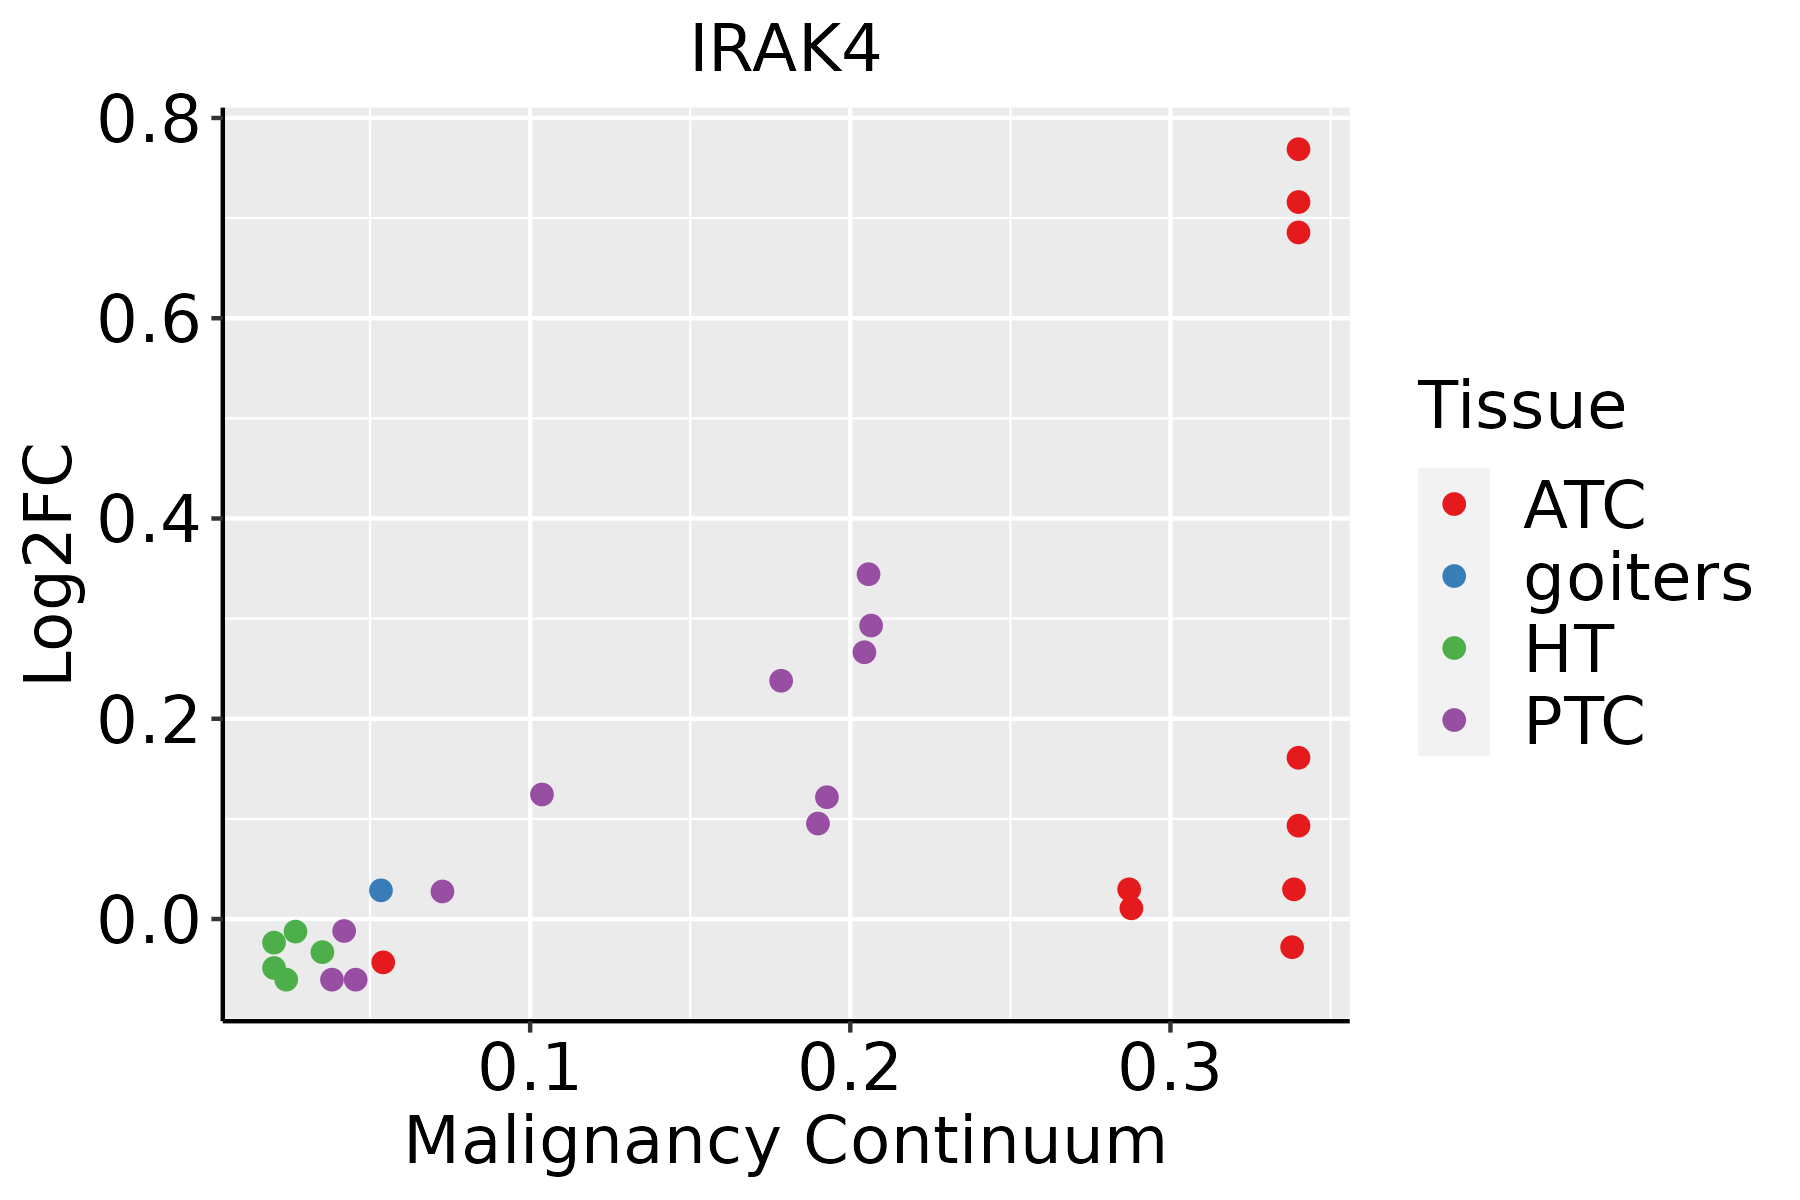 | ATC: Anaplastic thyroid cancer |
| HT: Hashimoto's thyroiditis | ||
| PTC: Papillary thyroid cancer |
| ∗log2FC in expression of this searched gene in stem-like cells from each diseased tissue sample relative to stem-like cells in normal samples in each tissue plotted against the malignancy continuum. Samples are colored based on if they are from different disease stage. |
Top |
Malignant transformation related pathway analysis |
| Find out the enriched GO biological processes and KEGG pathways involved in transition from healthy to precancer to cancer |
| Tissue | Disease Stage | Enriched GO biological Processes |
| Colorectum | AD |  |
| Colorectum | SER |  |
| Colorectum | MSS |  |
| Colorectum | MSI-H |  |
| Colorectum | FAP |  |
| ∗Top 15 enriched GO BP terms are showed in the bar plot of each disease state in each tissue. Each row represents a significant GO biological process which is colored according to the -log10(p.adjust). |
| Page: 1 2 3 4 5 6 7 8 9 |
| GO ID | Tissue | Disease Stage | Description | Gene Ratio | Bg Ratio | pvalue | p.adjust | Count |
| GO:004312220 | Esophagus | HGIN | regulation of I-kappaB kinase/NF-kappaB signaling | 63/2587 | 249/18723 | 8.91e-07 | 3.61e-05 | 63 |
| GO:000724918 | Esophagus | HGIN | I-kappaB kinase/NF-kappaB signaling | 67/2587 | 281/18723 | 3.84e-06 | 1.29e-04 | 67 |
| GO:004312317 | Esophagus | HGIN | positive regulation of I-kappaB kinase/NF-kappaB signaling | 49/2587 | 186/18723 | 4.22e-06 | 1.40e-04 | 49 |
| GO:004312318 | Esophagus | ESCC | positive regulation of I-kappaB kinase/NF-kappaB signaling | 132/8552 | 186/18723 | 2.07e-12 | 8.58e-11 | 132 |
| GO:0043122110 | Esophagus | ESCC | regulation of I-kappaB kinase/NF-kappaB signaling | 167/8552 | 249/18723 | 6.11e-12 | 2.32e-10 | 167 |
| GO:000724919 | Esophagus | ESCC | I-kappaB kinase/NF-kappaB signaling | 183/8552 | 281/18723 | 3.02e-11 | 1.01e-09 | 183 |
| GO:003109818 | Esophagus | ESCC | stress-activated protein kinase signaling cascade | 154/8552 | 247/18723 | 8.53e-08 | 1.44e-06 | 154 |
| GO:005140318 | Esophagus | ESCC | stress-activated MAPK cascade | 147/8552 | 239/18723 | 5.43e-07 | 7.18e-06 | 147 |
| GO:00072549 | Esophagus | ESCC | JNK cascade | 102/8552 | 167/18723 | 4.22e-05 | 3.39e-04 | 102 |
| GO:00486597 | Esophagus | ESCC | smooth muscle cell proliferation | 103/8552 | 184/18723 | 3.08e-03 | 1.28e-02 | 103 |
| GO:00486607 | Esophagus | ESCC | regulation of smooth muscle cell proliferation | 100/8552 | 180/18723 | 4.76e-03 | 1.85e-02 | 100 |
| GO:00330025 | Esophagus | ESCC | muscle cell proliferation | 134/8552 | 248/18723 | 4.80e-03 | 1.86e-02 | 134 |
| GO:00486615 | Esophagus | ESCC | positive regulation of smooth muscle cell proliferation | 61/8552 | 104/18723 | 5.22e-03 | 1.97e-02 | 61 |
| GO:00022211 | Liver | HCC | pattern recognition receptor signaling pathway | 107/7958 | 172/18723 | 1.37e-07 | 2.58e-06 | 107 |
| GO:000724912 | Liver | HCC | I-kappaB kinase/NF-kappaB signaling | 156/7958 | 281/18723 | 6.66e-06 | 8.00e-05 | 156 |
| GO:004312312 | Liver | HCC | positive regulation of I-kappaB kinase/NF-kappaB signaling | 108/7958 | 186/18723 | 1.28e-05 | 1.43e-04 | 108 |
| GO:003109822 | Liver | HCC | stress-activated protein kinase signaling cascade | 138/7958 | 247/18723 | 1.43e-05 | 1.57e-04 | 138 |
| GO:005140322 | Liver | HCC | stress-activated MAPK cascade | 134/7958 | 239/18723 | 1.50e-05 | 1.64e-04 | 134 |
| GO:004312212 | Liver | HCC | regulation of I-kappaB kinase/NF-kappaB signaling | 138/7958 | 249/18723 | 2.47e-05 | 2.58e-04 | 138 |
| GO:00705551 | Liver | HCC | response to interleukin-1 | 80/7958 | 143/18723 | 7.95e-04 | 4.77e-03 | 80 |
| Page: 1 2 3 |
| Pathway ID | Tissue | Disease Stage | Description | Gene Ratio | Bg Ratio | pvalue | p.adjust | qvalue | Count |
| hsa0517139 | Esophagus | HGIN | Coronavirus disease - COVID-19 | 105/1383 | 232/8465 | 7.84e-26 | 5.11e-24 | 4.06e-24 | 105 |
| hsa0513239 | Esophagus | HGIN | Salmonella infection | 69/1383 | 249/8465 | 3.02e-06 | 4.47e-05 | 3.55e-05 | 69 |
| hsa0513039 | Esophagus | HGIN | Pathogenic Escherichia coli infection | 54/1383 | 197/8465 | 4.91e-05 | 6.15e-04 | 4.89e-04 | 54 |
| hsa0516930 | Esophagus | HGIN | Epstein-Barr virus infection | 55/1383 | 202/8465 | 5.13e-05 | 6.19e-04 | 4.92e-04 | 55 |
| hsa0517029 | Esophagus | HGIN | Human immunodeficiency virus 1 infection | 51/1383 | 212/8465 | 2.16e-03 | 1.90e-02 | 1.51e-02 | 51 |
| hsa0541739 | Esophagus | HGIN | Lipid and atherosclerosis | 51/1383 | 215/8465 | 2.95e-03 | 2.41e-02 | 1.91e-02 | 51 |
| hsa046219 | Esophagus | HGIN | NOD-like receptor signaling pathway | 45/1383 | 186/8465 | 3.40e-03 | 2.54e-02 | 2.02e-02 | 45 |
| hsa0516420 | Esophagus | HGIN | Influenza A | 42/1383 | 171/8465 | 3.41e-03 | 2.54e-02 | 2.02e-02 | 42 |
| hsa05171115 | Esophagus | HGIN | Coronavirus disease - COVID-19 | 105/1383 | 232/8465 | 7.84e-26 | 5.11e-24 | 4.06e-24 | 105 |
| hsa05132115 | Esophagus | HGIN | Salmonella infection | 69/1383 | 249/8465 | 3.02e-06 | 4.47e-05 | 3.55e-05 | 69 |
| hsa05130115 | Esophagus | HGIN | Pathogenic Escherichia coli infection | 54/1383 | 197/8465 | 4.91e-05 | 6.15e-04 | 4.89e-04 | 54 |
| hsa05169114 | Esophagus | HGIN | Epstein-Barr virus infection | 55/1383 | 202/8465 | 5.13e-05 | 6.19e-04 | 4.92e-04 | 55 |
| hsa05170112 | Esophagus | HGIN | Human immunodeficiency virus 1 infection | 51/1383 | 212/8465 | 2.16e-03 | 1.90e-02 | 1.51e-02 | 51 |
| hsa05417114 | Esophagus | HGIN | Lipid and atherosclerosis | 51/1383 | 215/8465 | 2.95e-03 | 2.41e-02 | 1.91e-02 | 51 |
| hsa0462114 | Esophagus | HGIN | NOD-like receptor signaling pathway | 45/1383 | 186/8465 | 3.40e-03 | 2.54e-02 | 2.02e-02 | 45 |
| hsa05164110 | Esophagus | HGIN | Influenza A | 42/1383 | 171/8465 | 3.41e-03 | 2.54e-02 | 2.02e-02 | 42 |
| hsa05132211 | Esophagus | ESCC | Salmonella infection | 191/4205 | 249/8465 | 6.51e-19 | 5.45e-17 | 2.79e-17 | 191 |
| hsa05169210 | Esophagus | ESCC | Epstein-Barr virus infection | 151/4205 | 202/8465 | 1.55e-13 | 3.45e-12 | 1.77e-12 | 151 |
| hsa05130211 | Esophagus | ESCC | Pathogenic Escherichia coli infection | 142/4205 | 197/8465 | 8.21e-11 | 1.06e-09 | 5.42e-10 | 142 |
| hsa05170210 | Esophagus | ESCC | Human immunodeficiency virus 1 infection | 147/4205 | 212/8465 | 3.37e-09 | 3.53e-08 | 1.81e-08 | 147 |
| Page: 1 2 3 4 |
Top |
Cell-cell communication analysis |
| Identification of potential cell-cell interactions between two cell types and their ligand-receptor pairs for different disease states |
| Ligand | Receptor | LRpair | Pathway | Tissue | Disease Stage |
| Page: 1 |
Top |
Single-cell gene regulatory network inference analysis |
| Find out the significant the regulons (TFs) and the target genes of each regulon across cell types for different disease states |
| TF | Cell Type | Tissue | Disease Stage | Target Gene | RSS | Regulon Activity |
| ∗The dot plots of a searched regulon are shown for all cell subpopulations in each disease state of each tissue based on the regulon specific score inferred using pySCENIC and by calculating the average expression. |
| Page: 1 |
Top |
Somatic mutation of malignant transformation related genes |
| Annotation of somatic variants for genes involved in malignant transformation |
| Hugo Symbol | Variant Class | Variant Classification | dbSNP RS | HGVSc | HGVSp | HGVSp Short | SWISSPROT | BIOTYPE | SIFT | PolyPhen | Tumor Sample Barcode | Tissue | Histology | Sex | Age | Stage | Therapy Types | Drugs | Outcome |
| IRAK4 | SNV | Missense_Mutation | c.988N>G | p.Phe330Val | p.F330V | Q9NWZ3 | protein_coding | deleterious(0) | probably_damaging(0.998) | TCGA-A8-A07R-01 | Breast | breast invasive carcinoma | Female | >=65 | III/IV | Ancillary | zoledronic | SD | |
| IRAK4 | SNV | Missense_Mutation | novel | c.844N>T | p.Pro282Ser | p.P282S | Q9NWZ3 | protein_coding | deleterious(0.02) | probably_damaging(0.968) | TCGA-AR-A0TY-01 | Breast | breast invasive carcinoma | Female | <65 | I/II | Unspecific | Paclitaxel | PD |
| IRAK4 | SNV | Missense_Mutation | c.1294N>T | p.Val432Phe | p.V432F | Q9NWZ3 | protein_coding | deleterious(0.02) | benign(0.307) | TCGA-E2-A15G-01 | Breast | breast invasive carcinoma | Female | >=65 | I/II | Hormone Therapy | arimidex | SD | |
| IRAK4 | SNV | Missense_Mutation | c.1103C>A | p.Ser368Tyr | p.S368Y | Q9NWZ3 | protein_coding | deleterious(0.01) | probably_damaging(0.997) | TCGA-E9-A1RF-01 | Breast | breast invasive carcinoma | Female | >=65 | III/IV | Hormone Therapy | tamoxiphen | SD | |
| IRAK4 | SNV | Missense_Mutation | rs377584435 | c.34C>T | p.Arg12Cys | p.R12C | Q9NWZ3 | protein_coding | deleterious(0) | probably_damaging(0.999) | TCGA-JX-A3Q0-01 | Cervix | cervical & endocervical cancer | Female | <65 | III/IV | Unknown | Unknown | SD |
| IRAK4 | SNV | Missense_Mutation | novel | c.673G>A | p.Glu225Lys | p.E225K | Q9NWZ3 | protein_coding | tolerated(0.17) | benign(0.181) | TCGA-VS-A9U7-01 | Cervix | cervical & endocervical cancer | Female | <65 | I/II | Chemotherapy | cisplatin | CR |
| IRAK4 | SNV | Missense_Mutation | c.1224G>C | p.Lys408Asn | p.K408N | Q9NWZ3 | protein_coding | tolerated(0.43) | benign(0.044) | TCGA-AA-3509-01 | Colorectum | colon adenocarcinoma | Female | <65 | I/II | Unknown | Unknown | SD | |
| IRAK4 | SNV | Missense_Mutation | rs141209982 | c.529N>G | p.Thr177Ala | p.T177A | Q9NWZ3 | protein_coding | deleterious(0) | probably_damaging(0.931) | TCGA-AA-3984-01 | Colorectum | colon adenocarcinoma | Female | <65 | I/II | Unknown | Unknown | SD |
| IRAK4 | SNV | Missense_Mutation | c.1076N>T | p.Ala359Val | p.A359V | Q9NWZ3 | protein_coding | deleterious(0) | probably_damaging(0.985) | TCGA-AA-3984-01 | Colorectum | colon adenocarcinoma | Female | <65 | I/II | Unknown | Unknown | SD | |
| IRAK4 | SNV | Missense_Mutation | c.309T>G | p.Asp103Glu | p.D103E | Q9NWZ3 | protein_coding | tolerated(0.44) | benign(0.009) | TCGA-AA-A02R-01 | Colorectum | colon adenocarcinoma | Female | >=65 | I/II | Unknown | Unknown | PD |
| Page: 1 2 3 4 5 |
Top |
Related drugs of malignant transformation related genes |
| Identification of chemicals and drugs interact with genes involved in malignant transfromation |
| (DGIdb 4.0) |
| Entrez ID | Symbol | Category | Interaction Types | Drug Claim Name | Drug Name | PMIDs |
| 51135 | IRAK4 | DRUGGABLE GENOME, KINASE, SERINE THREONINE KINASE, ENZYME | inhibitor | 249565762 | ||
| 51135 | IRAK4 | DRUGGABLE GENOME, KINASE, SERINE THREONINE KINASE, ENZYME | TAE-684 | TAE-684 | ||
| 51135 | IRAK4 | DRUGGABLE GENOME, KINASE, SERINE THREONINE KINASE, ENZYME | GO-6976 | GO-6976 | ||
| 51135 | IRAK4 | DRUGGABLE GENOME, KINASE, SERINE THREONINE KINASE, ENZYME | Fused benzoheterocycle amide derivative 1 | |||
| 51135 | IRAK4 | DRUGGABLE GENOME, KINASE, SERINE THREONINE KINASE, ENZYME | Pyrazolopyrimidine and thienopyrimidine amide derivative 1 | |||
| 51135 | IRAK4 | DRUGGABLE GENOME, KINASE, SERINE THREONINE KINASE, ENZYME | inhibitor | 249565765 | ||
| 51135 | IRAK4 | DRUGGABLE GENOME, KINASE, SERINE THREONINE KINASE, ENZYME | inhibitor | 381118862 | ||
| 51135 | IRAK4 | DRUGGABLE GENOME, KINASE, SERINE THREONINE KINASE, ENZYME | Amidopyrazole derivative 2 | |||
| 51135 | IRAK4 | DRUGGABLE GENOME, KINASE, SERINE THREONINE KINASE, ENZYME | Amidopyrazole derivative 1 | |||
| 51135 | IRAK4 | DRUGGABLE GENOME, KINASE, SERINE THREONINE KINASE, ENZYME | ILORASERTIB | ILORASERTIB |
| Page: 1 2 3 4 5 6 |

Copyright 2023-Present -The University of Texas Health Science Center at Houston |