
|
|||||
|
 | |
| |
| |
| |
| |
| |
|
Gene: IRAK2 |
Gene summary for IRAK2 |
| Gene information | Species | Human | Gene symbol | IRAK2 | Gene ID | 3656 |
| Gene name | interleukin 1 receptor associated kinase 2 | |
| Gene Alias | IRAK-2 | |
| Cytomap | 3p25.3 | |
| Gene Type | protein-coding | GO ID | GO:0001959 | UniProtAcc | O43187 |
Top |
Malignant transformation analysis |
| Identification of the aberrant gene expression in precancerous and cancerous lesions by comparing the gene expression of stem-like cells in diseased tissues with normal stem cells |
| Entrez ID | Symbol | Replicates | Species | Organ | Tissue | Adj P-value | Log2FC | Malignancy |
| 3656 | IRAK2 | LZE8T | Human | Esophagus | ESCC | 1.86e-02 | 1.96e-01 | 0.067 |
| 3656 | IRAK2 | P2T-E | Human | Esophagus | ESCC | 2.47e-08 | 1.83e-01 | 0.1177 |
| 3656 | IRAK2 | P4T-E | Human | Esophagus | ESCC | 5.15e-05 | 1.70e-01 | 0.1323 |
| 3656 | IRAK2 | P5T-E | Human | Esophagus | ESCC | 1.12e-02 | 7.41e-02 | 0.1327 |
| 3656 | IRAK2 | P16T-E | Human | Esophagus | ESCC | 1.90e-03 | 4.67e-02 | 0.1153 |
| 3656 | IRAK2 | P20T-E | Human | Esophagus | ESCC | 9.10e-12 | 3.15e-01 | 0.1124 |
| 3656 | IRAK2 | P21T-E | Human | Esophagus | ESCC | 7.04e-04 | 1.42e-01 | 0.1617 |
| 3656 | IRAK2 | P23T-E | Human | Esophagus | ESCC | 1.66e-20 | 6.88e-01 | 0.108 |
| 3656 | IRAK2 | P24T-E | Human | Esophagus | ESCC | 1.16e-06 | 1.07e-01 | 0.1287 |
| 3656 | IRAK2 | P27T-E | Human | Esophagus | ESCC | 5.97e-04 | 1.09e-01 | 0.1055 |
| 3656 | IRAK2 | P28T-E | Human | Esophagus | ESCC | 5.55e-03 | 7.80e-02 | 0.1149 |
| 3656 | IRAK2 | P31T-E | Human | Esophagus | ESCC | 2.89e-02 | 4.43e-02 | 0.1251 |
| 3656 | IRAK2 | P32T-E | Human | Esophagus | ESCC | 1.79e-02 | 4.89e-02 | 0.1666 |
| 3656 | IRAK2 | P36T-E | Human | Esophagus | ESCC | 1.25e-02 | 2.29e-01 | 0.1187 |
| 3656 | IRAK2 | P37T-E | Human | Esophagus | ESCC | 2.70e-03 | 8.20e-02 | 0.1371 |
| 3656 | IRAK2 | P39T-E | Human | Esophagus | ESCC | 4.23e-03 | 1.12e-01 | 0.0894 |
| 3656 | IRAK2 | P40T-E | Human | Esophagus | ESCC | 2.05e-02 | 1.96e-01 | 0.109 |
| 3656 | IRAK2 | P42T-E | Human | Esophagus | ESCC | 3.71e-12 | 3.60e-01 | 0.1175 |
| 3656 | IRAK2 | P57T-E | Human | Esophagus | ESCC | 3.83e-04 | 1.63e-01 | 0.0926 |
| 3656 | IRAK2 | P62T-E | Human | Esophagus | ESCC | 8.62e-31 | 6.05e-01 | 0.1302 |
| Page: 1 2 |
| Tissue | Expression Dynamics | Abbreviation |
| Esophagus | 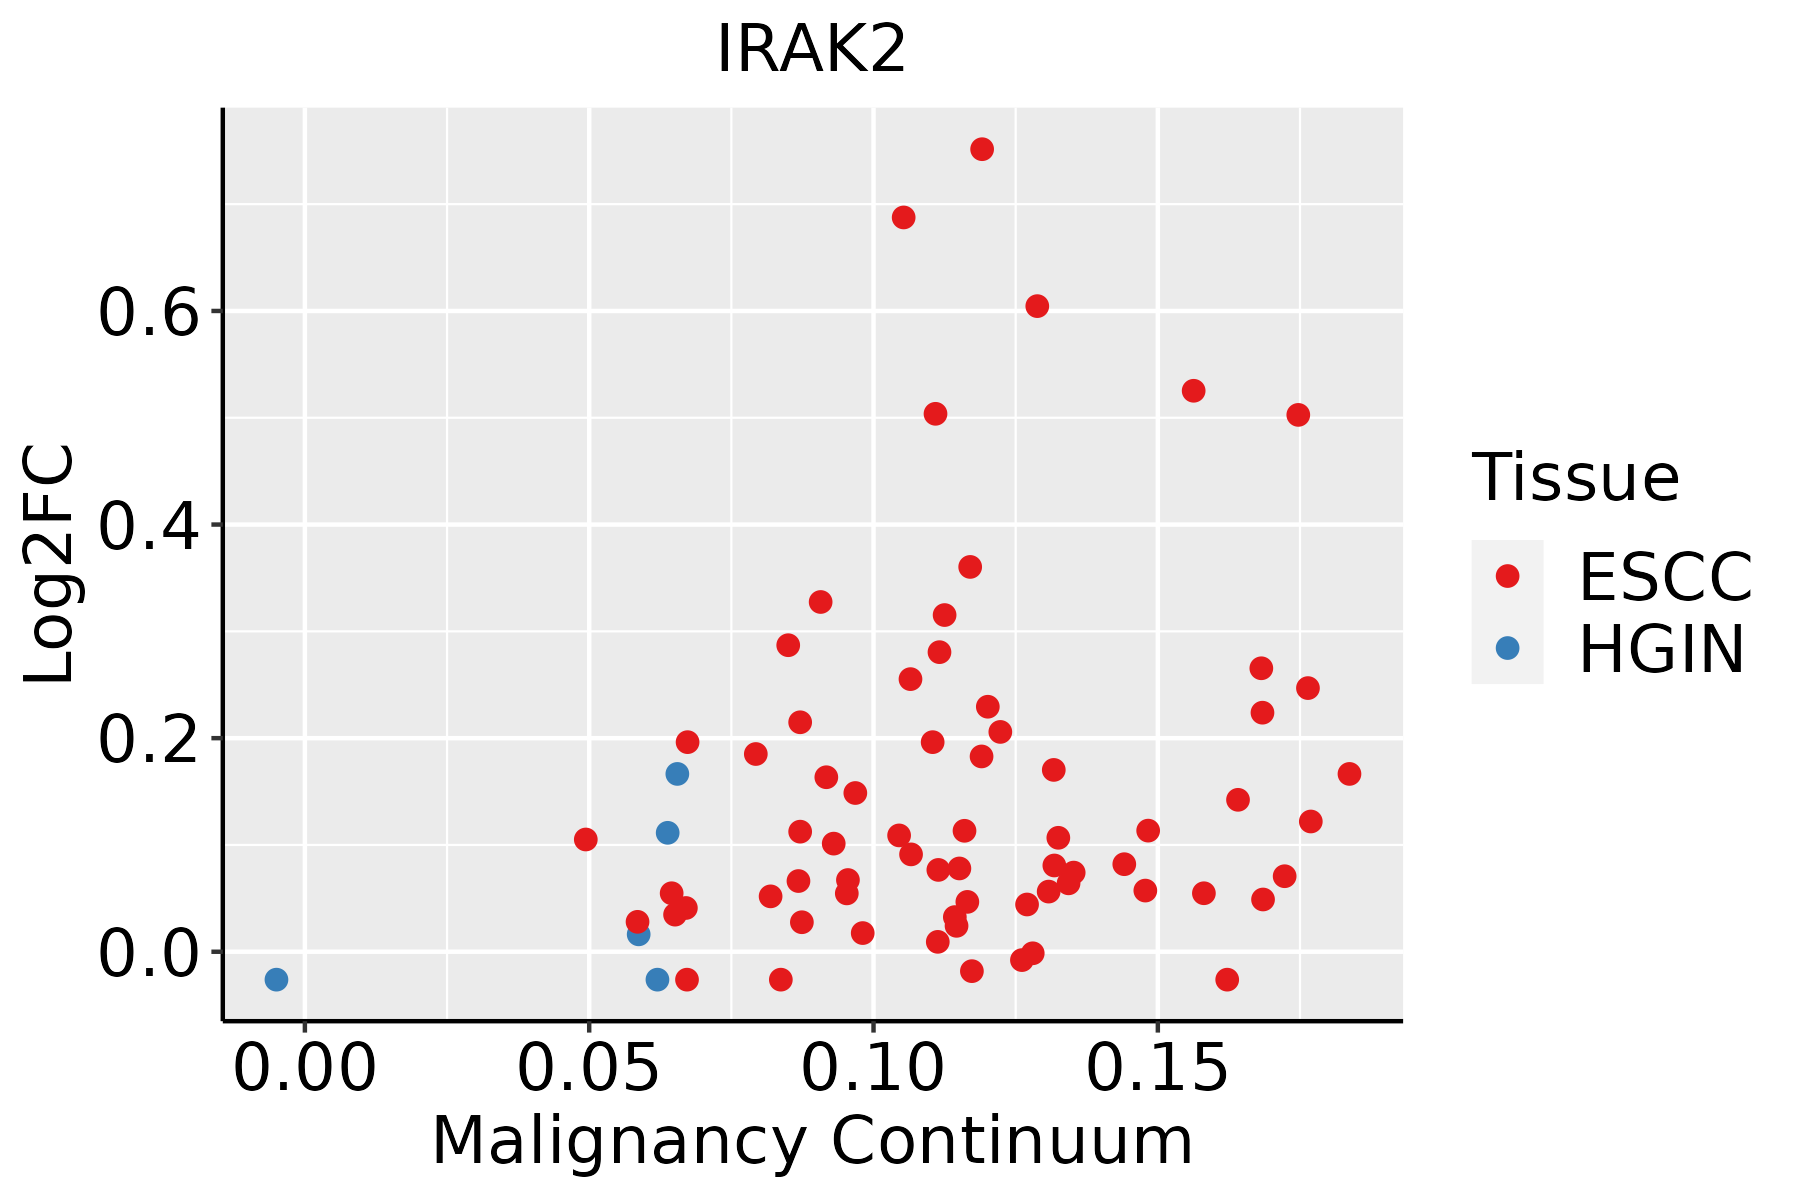 | ESCC: Esophageal squamous cell carcinoma |
| HGIN: High-grade intraepithelial neoplasias | ||
| LGIN: Low-grade intraepithelial neoplasias | ||
| Liver | 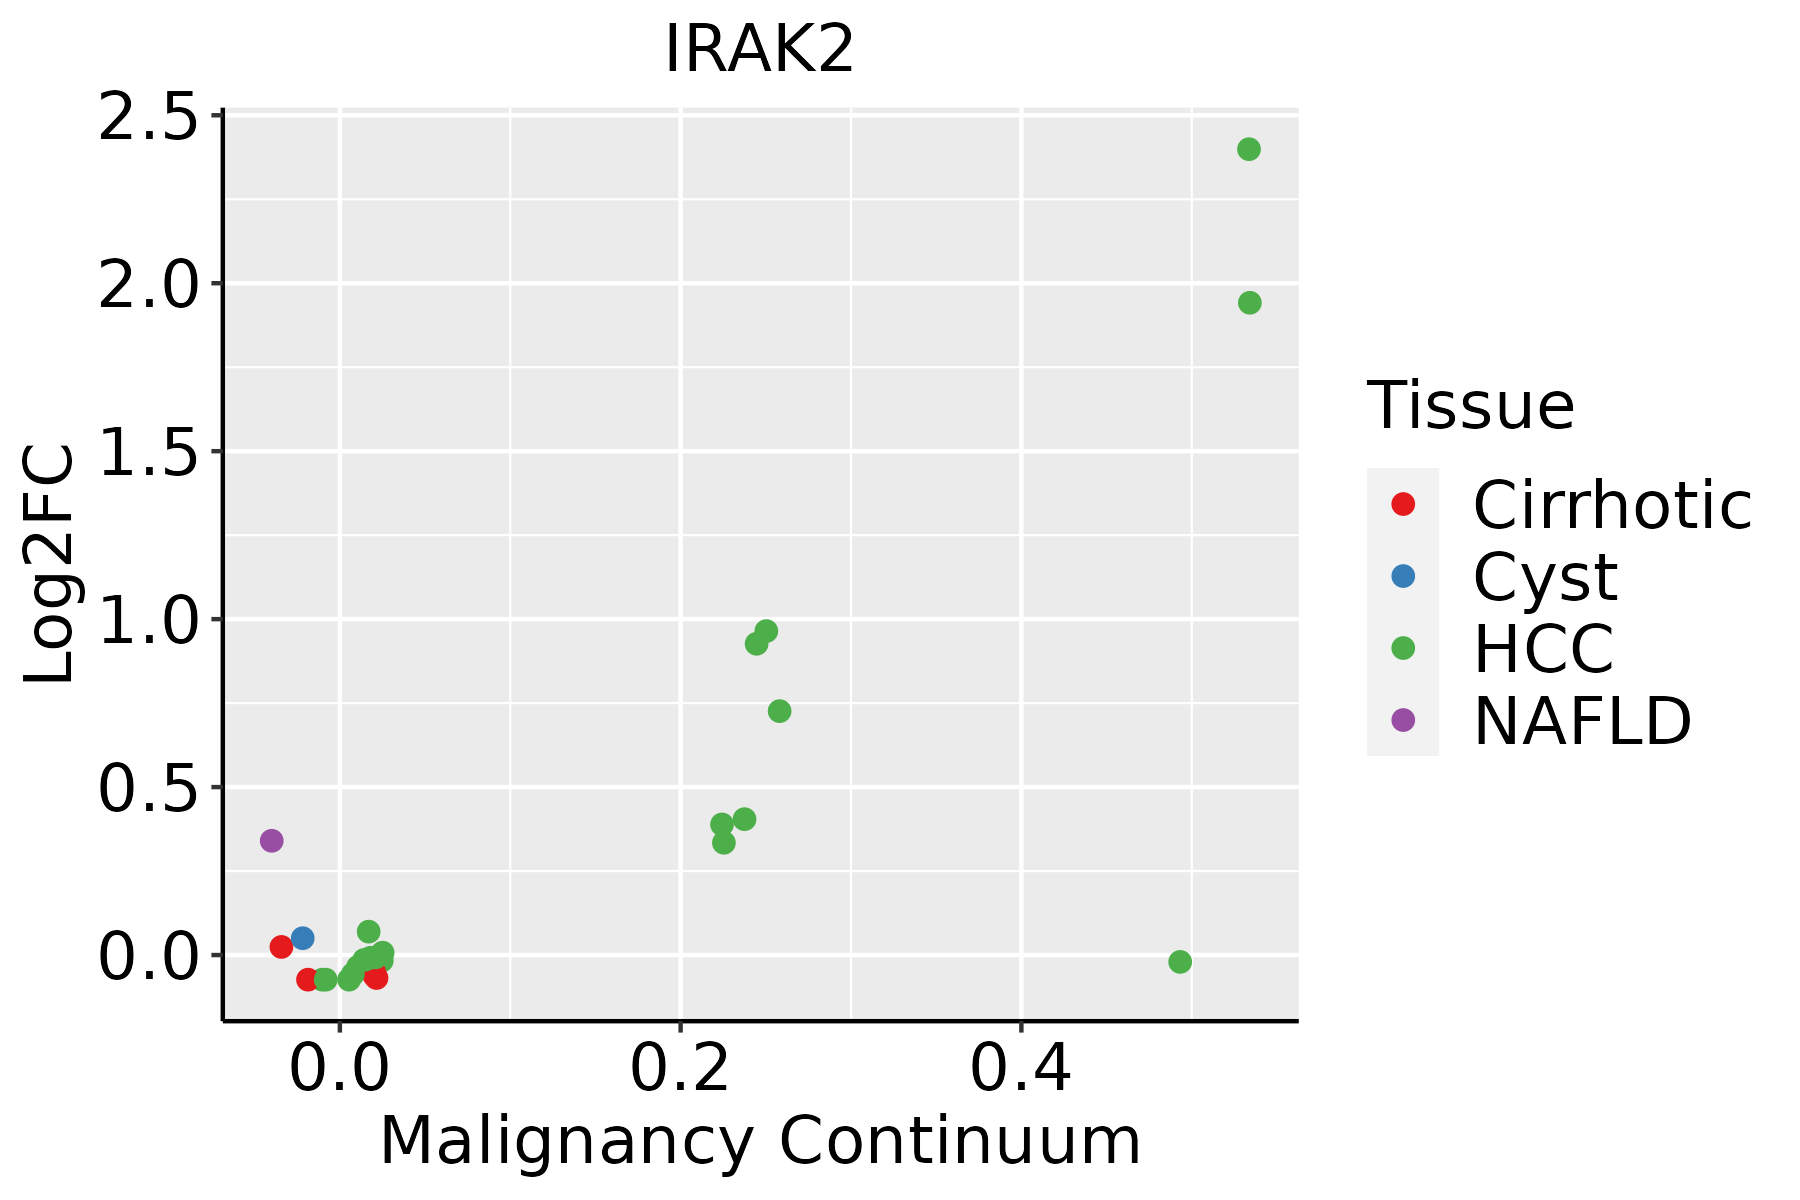 | HCC: Hepatocellular carcinoma |
| NAFLD: Non-alcoholic fatty liver disease |
| ∗log2FC in expression of this searched gene in stem-like cells from each diseased tissue sample relative to stem-like cells in normal samples in each tissue plotted against the malignancy continuum. Samples are colored based on if they are from different disease stage. |
Top |
Malignant transformation related pathway analysis |
| Find out the enriched GO biological processes and KEGG pathways involved in transition from healthy to precancer to cancer |
| Tissue | Disease Stage | Enriched GO biological Processes |
| Colorectum | AD |  |
| Colorectum | SER |  |
| Colorectum | MSS |  |
| Colorectum | MSI-H |  |
| Colorectum | FAP |  |
| ∗Top 15 enriched GO BP terms are showed in the bar plot of each disease state in each tissue. Each row represents a significant GO biological process which is colored according to the -log10(p.adjust). |
| Page: 1 2 3 4 5 6 7 8 9 |
| GO ID | Tissue | Disease Stage | Description | Gene Ratio | Bg Ratio | pvalue | p.adjust | Count |
| GO:000724919 | Esophagus | ESCC | I-kappaB kinase/NF-kappaB signaling | 183/8552 | 281/18723 | 3.02e-11 | 1.01e-09 | 183 |
| GO:00510908 | Esophagus | ESCC | regulation of DNA-binding transcription factor activity | 252/8552 | 440/18723 | 5.22e-07 | 6.97e-06 | 252 |
| GO:00607595 | Esophagus | ESCC | regulation of response to cytokine stimulus | 103/8552 | 162/18723 | 3.14e-06 | 3.53e-05 | 103 |
| GO:00510918 | Esophagus | ESCC | positive regulation of DNA-binding transcription factor activity | 155/8552 | 260/18723 | 3.83e-06 | 4.14e-05 | 155 |
| GO:00019595 | Esophagus | ESCC | regulation of cytokine-mediated signaling pathway | 95/8552 | 150/18723 | 9.48e-06 | 9.04e-05 | 95 |
| GO:003249619 | Esophagus | ESCC | response to lipopolysaccharide | 191/8552 | 343/18723 | 1.11e-04 | 7.73e-04 | 191 |
| GO:00510926 | Esophagus | ESCC | positive regulation of NF-kappaB transcription factor activity | 91/8552 | 152/18723 | 2.91e-04 | 1.75e-03 | 91 |
| GO:000223719 | Esophagus | ESCC | response to molecule of bacterial origin | 194/8552 | 363/18723 | 1.64e-03 | 7.61e-03 | 194 |
| GO:00434332 | Esophagus | ESCC | negative regulation of DNA-binding transcription factor activity | 103/8552 | 185/18723 | 3.86e-03 | 1.57e-02 | 103 |
| GO:007122215 | Esophagus | ESCC | cellular response to lipopolysaccharide | 113/8552 | 209/18723 | 8.79e-03 | 3.10e-02 | 113 |
| GO:00316633 | Esophagus | ESCC | lipopolysaccharide-mediated signaling pathway | 37/8552 | 60/18723 | 9.17e-03 | 3.19e-02 | 37 |
| GO:007121617 | Esophagus | ESCC | cellular response to biotic stimulus | 131/8552 | 246/18723 | 9.85e-03 | 3.39e-02 | 131 |
| GO:00320882 | Esophagus | ESCC | negative regulation of NF-kappaB transcription factor activity | 54/8552 | 93/18723 | 1.08e-02 | 3.67e-02 | 54 |
| GO:00022211 | Liver | HCC | pattern recognition receptor signaling pathway | 107/7958 | 172/18723 | 1.37e-07 | 2.58e-06 | 107 |
| GO:000724912 | Liver | HCC | I-kappaB kinase/NF-kappaB signaling | 156/7958 | 281/18723 | 6.66e-06 | 8.00e-05 | 156 |
| GO:00705551 | Liver | HCC | response to interleukin-1 | 80/7958 | 143/18723 | 7.95e-04 | 4.77e-03 | 80 |
| GO:00510902 | Liver | HCC | regulation of DNA-binding transcription factor activity | 220/7958 | 440/18723 | 8.04e-04 | 4.82e-03 | 220 |
| GO:003249611 | Liver | HCC | response to lipopolysaccharide | 174/7958 | 343/18723 | 1.19e-03 | 6.62e-03 | 174 |
| GO:00712166 | Liver | HCC | cellular response to biotic stimulus | 128/7958 | 246/18723 | 1.53e-03 | 8.10e-03 | 128 |
| GO:00712226 | Liver | HCC | cellular response to lipopolysaccharide | 110/7958 | 209/18723 | 1.92e-03 | 9.77e-03 | 110 |
| Page: 1 2 |
| Pathway ID | Tissue | Disease Stage | Description | Gene Ratio | Bg Ratio | pvalue | p.adjust | qvalue | Count |
| hsa0472225 | Esophagus | ESCC | Neurotrophin signaling pathway | 80/4205 | 119/8465 | 7.33e-05 | 3.07e-04 | 1.57e-04 | 80 |
| hsa051527 | Esophagus | ESCC | Tuberculosis | 111/4205 | 180/8465 | 7.14e-04 | 2.32e-03 | 1.19e-03 | 111 |
| hsa04722111 | Esophagus | ESCC | Neurotrophin signaling pathway | 80/4205 | 119/8465 | 7.33e-05 | 3.07e-04 | 1.57e-04 | 80 |
| hsa0515212 | Esophagus | ESCC | Tuberculosis | 111/4205 | 180/8465 | 7.14e-04 | 2.32e-03 | 1.19e-03 | 111 |
| hsa0472210 | Liver | HCC | Neurotrophin signaling pathway | 74/4020 | 119/8465 | 8.27e-04 | 3.26e-03 | 1.81e-03 | 74 |
| hsa0472211 | Liver | HCC | Neurotrophin signaling pathway | 74/4020 | 119/8465 | 8.27e-04 | 3.26e-03 | 1.81e-03 | 74 |
| Page: 1 |
Top |
Cell-cell communication analysis |
| Identification of potential cell-cell interactions between two cell types and their ligand-receptor pairs for different disease states |
| Ligand | Receptor | LRpair | Pathway | Tissue | Disease Stage |
| Page: 1 |
Top |
Single-cell gene regulatory network inference analysis |
| Find out the significant the regulons (TFs) and the target genes of each regulon across cell types for different disease states |
| TF | Cell Type | Tissue | Disease Stage | Target Gene | RSS | Regulon Activity |
| ∗The dot plots of a searched regulon are shown for all cell subpopulations in each disease state of each tissue based on the regulon specific score inferred using pySCENIC and by calculating the average expression. |
| Page: 1 |
Top |
Somatic mutation of malignant transformation related genes |
| Annotation of somatic variants for genes involved in malignant transformation |
| Hugo Symbol | Variant Class | Variant Classification | dbSNP RS | HGVSc | HGVSp | HGVSp Short | SWISSPROT | BIOTYPE | SIFT | PolyPhen | Tumor Sample Barcode | Tissue | Histology | Sex | Age | Stage | Therapy Types | Drugs | Outcome |
| IRAK2 | SNV | Missense_Mutation | c.682N>T | p.His228Tyr | p.H228Y | O43187 | protein_coding | deleterious(0.04) | benign(0.113) | TCGA-A8-A09A-01 | Breast | breast invasive carcinoma | Female | <65 | I/II | Hormone Therapy | tamoxiphen | SD | |
| IRAK2 | SNV | Missense_Mutation | novel | c.1150N>A | p.Glu384Lys | p.E384K | O43187 | protein_coding | deleterious(0) | possibly_damaging(0.836) | TCGA-BH-A0HF-01 | Breast | breast invasive carcinoma | Female | >=65 | I/II | Hormone Therapy | arimidex | SD |
| IRAK2 | SNV | Missense_Mutation | c.442G>A | p.Ala148Thr | p.A148T | O43187 | protein_coding | tolerated(0.31) | benign(0.003) | TCGA-BH-A18U-01 | Breast | breast invasive carcinoma | Female | >=65 | III/IV | Unknown | Unknown | SD | |
| IRAK2 | SNV | Missense_Mutation | c.617N>T | p.Ala206Val | p.A206V | O43187 | protein_coding | deleterious(0.01) | probably_damaging(0.996) | TCGA-EW-A1IW-01 | Breast | breast invasive carcinoma | Female | >=65 | I/II | Hormone Therapy | aromasin | SD | |
| IRAK2 | insertion | Frame_Shift_Ins | novel | c.1502dupA | p.Arg502AlafsTer16 | p.R502Afs*16 | O43187 | protein_coding | TCGA-AO-A03P-01 | Breast | breast invasive carcinoma | Female | <65 | I/II | Hormone Therapy | letrozole | PD | ||
| IRAK2 | insertion | Frame_Shift_Ins | novel | c.1503_1504insAAACATTCCTTCCTTGCTTC | p.Arg502LysfsTer49 | p.R502Kfs*49 | O43187 | protein_coding | TCGA-AO-A03P-01 | Breast | breast invasive carcinoma | Female | <65 | I/II | Hormone Therapy | letrozole | PD | ||
| IRAK2 | deletion | Frame_Shift_Del | novel | c.915delN | p.Leu307SerfsTer63 | p.L307Sfs*63 | O43187 | protein_coding | TCGA-EW-A2FV-01 | Breast | breast invasive carcinoma | Female | <65 | III/IV | Chemotherapy | docetaxel | SD | ||
| IRAK2 | SNV | Missense_Mutation | c.50N>A | p.Cys17Tyr | p.C17Y | O43187 | protein_coding | tolerated(0.05) | probably_damaging(1) | TCGA-AA-3710-01 | Colorectum | colon adenocarcinoma | Female | >=65 | I/II | Unknown | Unknown | SD | |
| IRAK2 | SNV | Missense_Mutation | c.1613N>T | p.Asp538Val | p.D538V | O43187 | protein_coding | tolerated(0.09) | benign(0.014) | TCGA-AA-3715-01 | Colorectum | colon adenocarcinoma | Male | >=65 | I/II | Unknown | Unknown | PD | |
| IRAK2 | SNV | Missense_Mutation | c.1619C>T | p.Ser540Phe | p.S540F | O43187 | protein_coding | deleterious(0.01) | possibly_damaging(0.548) | TCGA-AA-3855-01 | Colorectum | colon adenocarcinoma | Male | >=65 | I/II | Unknown | Unknown | SD |
| Page: 1 2 3 4 5 6 |
Top |
Related drugs of malignant transformation related genes |
| Identification of chemicals and drugs interact with genes involved in malignant transfromation |
| (DGIdb 4.0) |
| Entrez ID | Symbol | Category | Interaction Types | Drug Claim Name | Drug Name | PMIDs |
| Page: 1 |

Copyright 2023-Present -The University of Texas Health Science Center at Houston |