
|
|||||
|
 | |
| |
| |
| |
| |
| |
|
Gene: IQSEC1 |
Gene summary for IQSEC1 |
| Gene information | Species | Human | Gene symbol | IQSEC1 | Gene ID | 9922 |
| Gene name | IQ motif and Sec7 domain ArfGEF 1 | |
| Gene Alias | ARF-GEP100 | |
| Cytomap | 3p25.2-p25.1 | |
| Gene Type | protein-coding | GO ID | GO:0001667 | UniProtAcc | A0A087WWK8 |
Top |
Malignant transformation analysis |
| Identification of the aberrant gene expression in precancerous and cancerous lesions by comparing the gene expression of stem-like cells in diseased tissues with normal stem cells |
| Entrez ID | Symbol | Replicates | Species | Organ | Tissue | Adj P-value | Log2FC | Malignancy |
| 9922 | IQSEC1 | S41 | Human | Liver | Cirrhotic | 7.50e-06 | 5.99e-01 | -0.0343 |
| 9922 | IQSEC1 | HCC1_Meng | Human | Liver | HCC | 6.48e-31 | 8.20e-03 | 0.0246 |
| 9922 | IQSEC1 | HCC1 | Human | Liver | HCC | 1.05e-15 | 3.14e+00 | 0.5336 |
| 9922 | IQSEC1 | HCC2 | Human | Liver | HCC | 2.10e-26 | 4.13e+00 | 0.5341 |
| 9922 | IQSEC1 | S014 | Human | Liver | HCC | 1.06e-19 | 7.30e-01 | 0.2254 |
| 9922 | IQSEC1 | S015 | Human | Liver | HCC | 3.64e-13 | 7.04e-01 | 0.2375 |
| 9922 | IQSEC1 | S016 | Human | Liver | HCC | 1.97e-17 | 6.29e-01 | 0.2243 |
| 9922 | IQSEC1 | S027 | Human | Liver | HCC | 8.74e-12 | 8.13e-01 | 0.2446 |
| 9922 | IQSEC1 | S028 | Human | Liver | HCC | 7.29e-23 | 9.02e-01 | 0.2503 |
| 9922 | IQSEC1 | S029 | Human | Liver | HCC | 3.11e-21 | 1.01e+00 | 0.2581 |
| 9922 | IQSEC1 | male-WTA | Human | Thyroid | PTC | 3.67e-09 | 5.91e-02 | 0.1037 |
| 9922 | IQSEC1 | PTC01 | Human | Thyroid | PTC | 4.25e-03 | 6.51e-03 | 0.1899 |
| 9922 | IQSEC1 | PTC04 | Human | Thyroid | PTC | 2.08e-08 | 7.62e-02 | 0.1927 |
| 9922 | IQSEC1 | PTC05 | Human | Thyroid | PTC | 1.98e-07 | 3.38e-01 | 0.2065 |
| 9922 | IQSEC1 | PTC06 | Human | Thyroid | PTC | 1.25e-09 | 1.35e-01 | 0.2057 |
| 9922 | IQSEC1 | PTC07 | Human | Thyroid | PTC | 2.57e-05 | 1.07e-01 | 0.2044 |
| 9922 | IQSEC1 | ATC12 | Human | Thyroid | ATC | 1.55e-05 | 1.29e-01 | 0.34 |
| 9922 | IQSEC1 | ATC13 | Human | Thyroid | ATC | 2.20e-29 | 4.55e-01 | 0.34 |
| 9922 | IQSEC1 | ATC2 | Human | Thyroid | ATC | 1.33e-02 | 6.36e-01 | 0.34 |
| 9922 | IQSEC1 | ATC4 | Human | Thyroid | ATC | 2.49e-06 | 1.64e-01 | 0.34 |
| Page: 1 2 |
| Tissue | Expression Dynamics | Abbreviation |
| Liver | 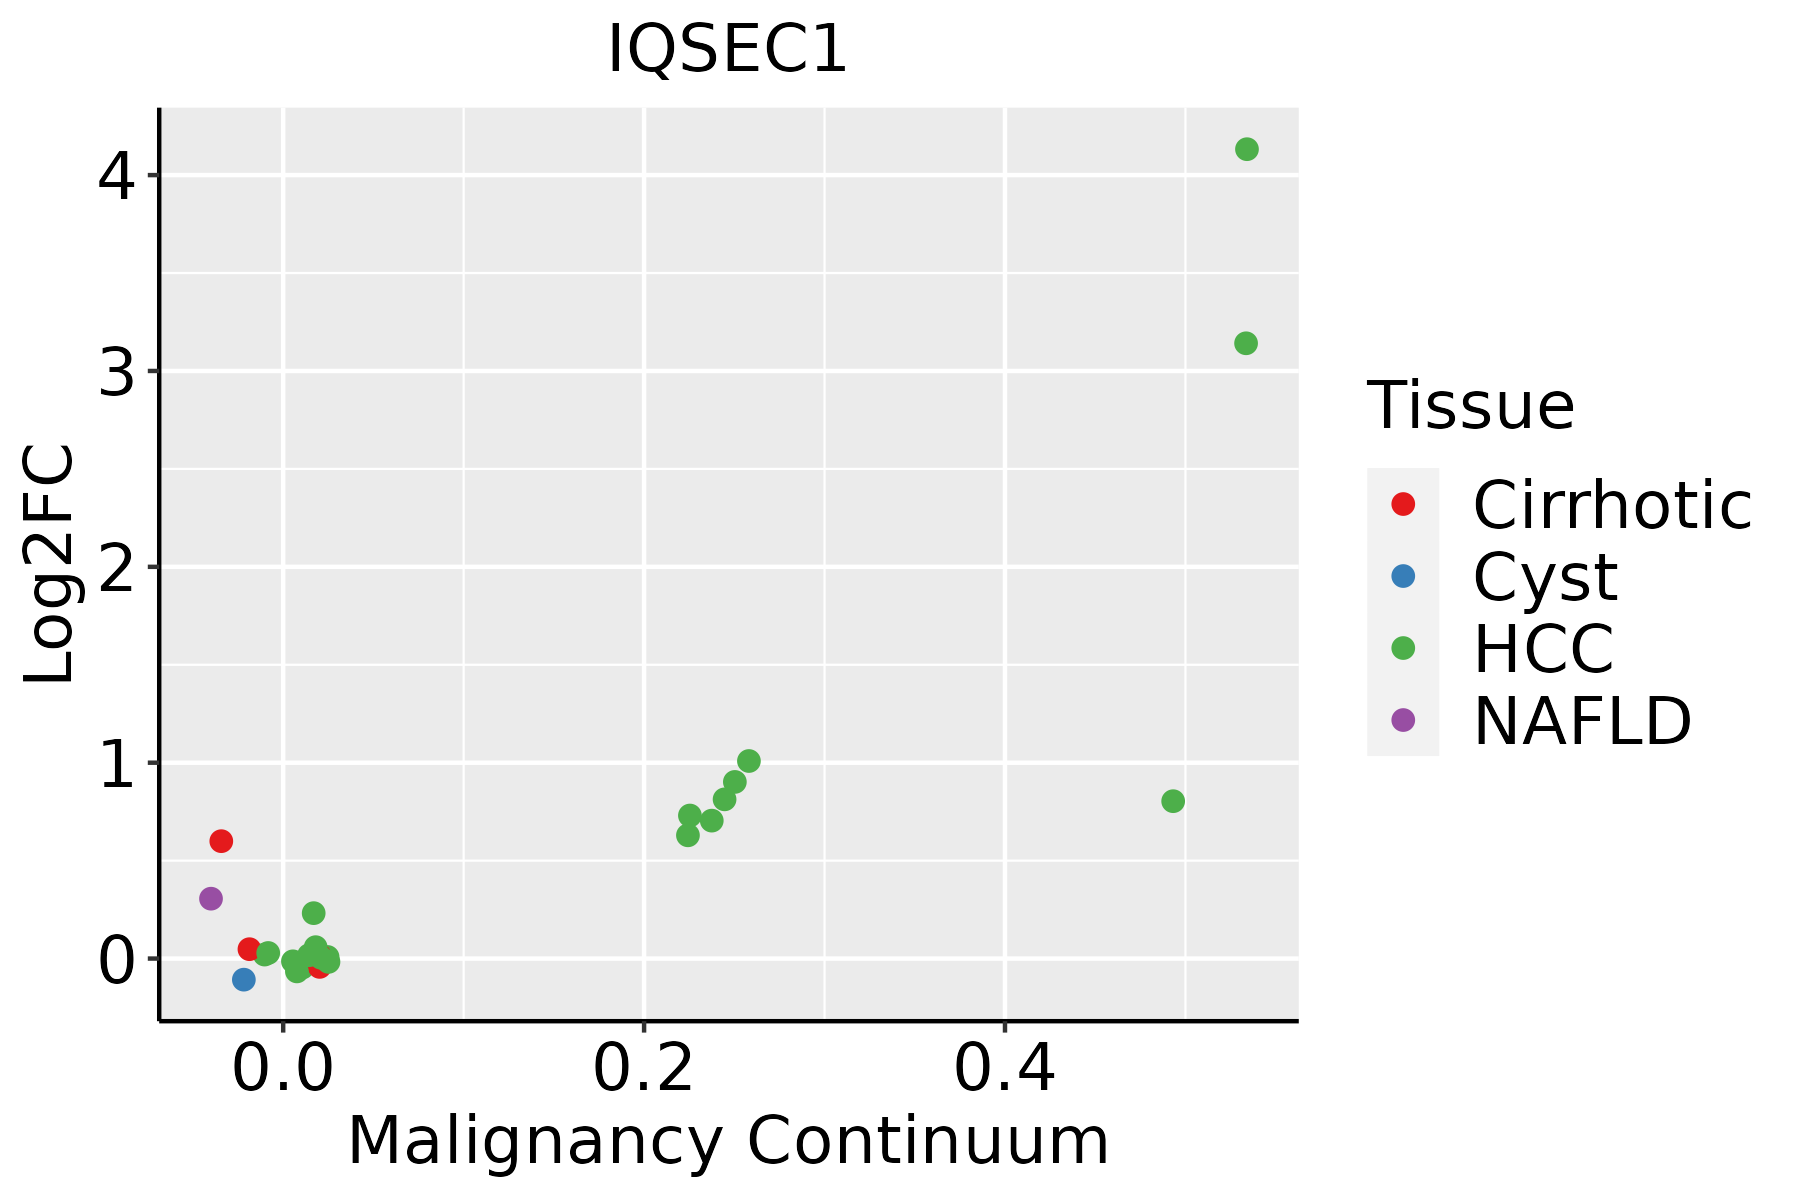 | HCC: Hepatocellular carcinoma |
| NAFLD: Non-alcoholic fatty liver disease | ||
| Thyroid | 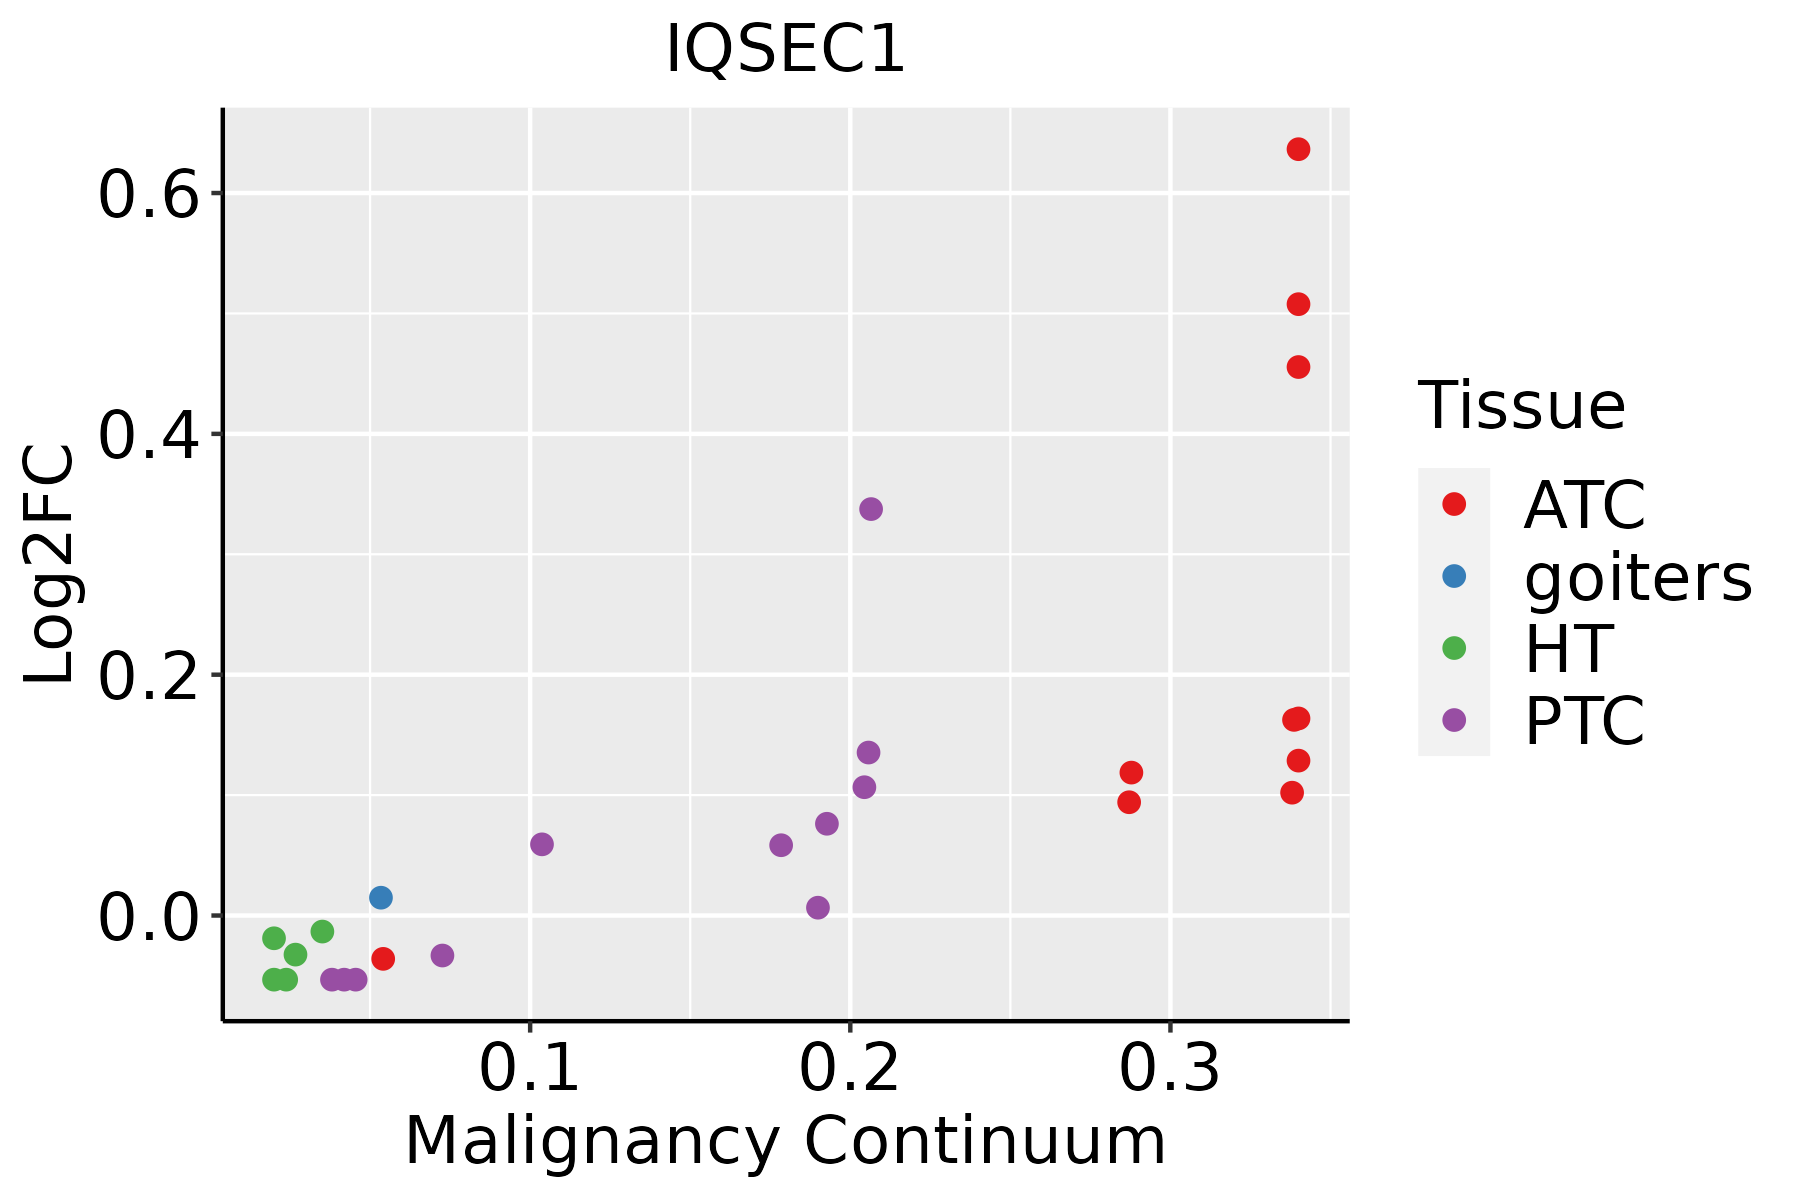 | ATC: Anaplastic thyroid cancer |
| HT: Hashimoto's thyroiditis | ||
| PTC: Papillary thyroid cancer |
| ∗log2FC in expression of this searched gene in stem-like cells from each diseased tissue sample relative to stem-like cells in normal samples in each tissue plotted against the malignancy continuum. Samples are colored based on if they are from different disease stage. |
Top |
Malignant transformation related pathway analysis |
| Find out the enriched GO biological processes and KEGG pathways involved in transition from healthy to precancer to cancer |
| Tissue | Disease Stage | Enriched GO biological Processes |
| Colorectum | AD |  |
| Colorectum | SER |  |
| Colorectum | MSS |  |
| Colorectum | MSI-H |  |
| Colorectum | FAP |  |
| ∗Top 15 enriched GO BP terms are showed in the bar plot of each disease state in each tissue. Each row represents a significant GO biological process which is colored according to the -log10(p.adjust). |
| Page: 1 2 3 4 5 6 7 8 9 |
| GO ID | Tissue | Disease Stage | Description | Gene Ratio | Bg Ratio | pvalue | p.adjust | Count |
| GO:00224117 | Liver | Cirrhotic | cellular component disassembly | 182/4634 | 443/18723 | 1.59e-14 | 1.54e-12 | 182 |
| GO:015011512 | Liver | Cirrhotic | cell-substrate junction organization | 51/4634 | 101/18723 | 2.08e-08 | 7.47e-07 | 51 |
| GO:015011612 | Liver | Cirrhotic | regulation of cell-substrate junction organization | 38/4634 | 71/18723 | 1.84e-07 | 4.82e-06 | 38 |
| GO:01501171 | Liver | Cirrhotic | positive regulation of cell-substrate junction organization | 21/4634 | 33/18723 | 2.55e-06 | 4.63e-05 | 21 |
| GO:000726511 | Liver | Cirrhotic | Ras protein signal transduction | 119/4634 | 337/18723 | 8.16e-06 | 1.22e-04 | 119 |
| GO:0150146 | Liver | Cirrhotic | cell junction disassembly | 12/4634 | 21/18723 | 1.53e-03 | 9.98e-03 | 12 |
| GO:000166712 | Liver | Cirrhotic | ameboidal-type cell migration | 145/4634 | 475/18723 | 2.23e-03 | 1.36e-02 | 145 |
| GO:00106327 | Liver | Cirrhotic | regulation of epithelial cell migration | 93/4634 | 292/18723 | 3.46e-03 | 1.92e-02 | 93 |
| GO:00106317 | Liver | Cirrhotic | epithelial cell migration | 110/4634 | 357/18723 | 5.14e-03 | 2.65e-02 | 110 |
| GO:00901327 | Liver | Cirrhotic | epithelium migration | 110/4634 | 360/18723 | 6.79e-03 | 3.35e-02 | 110 |
| GO:00901307 | Liver | Cirrhotic | tissue migration | 111/4634 | 365/18723 | 7.66e-03 | 3.61e-02 | 111 |
| GO:00106346 | Liver | Cirrhotic | positive regulation of epithelial cell migration | 58/4634 | 176/18723 | 8.54e-03 | 3.96e-02 | 58 |
| GO:002241112 | Liver | HCC | cellular component disassembly | 282/7958 | 443/18723 | 1.02e-19 | 1.38e-17 | 282 |
| GO:015011522 | Liver | HCC | cell-substrate junction organization | 69/7958 | 101/18723 | 1.36e-07 | 2.57e-06 | 69 |
| GO:000726521 | Liver | HCC | Ras protein signal transduction | 187/7958 | 337/18723 | 8.89e-07 | 1.35e-05 | 187 |
| GO:015011622 | Liver | HCC | regulation of cell-substrate junction organization | 48/7958 | 71/18723 | 1.67e-05 | 1.81e-04 | 48 |
| GO:01501172 | Liver | HCC | positive regulation of cell-substrate junction organization | 24/7958 | 33/18723 | 4.24e-04 | 2.85e-03 | 24 |
| GO:004657811 | Liver | HCC | regulation of Ras protein signal transduction | 100/7958 | 189/18723 | 2.42e-03 | 1.18e-02 | 100 |
| GO:01501461 | Liver | HCC | cell junction disassembly | 15/7958 | 21/18723 | 7.03e-03 | 2.80e-02 | 15 |
| GO:006099611 | Liver | HCC | dendritic spine development | 54/7958 | 99/18723 | 1.03e-02 | 3.86e-02 | 54 |
| Page: 1 2 3 |
| Pathway ID | Tissue | Disease Stage | Description | Gene Ratio | Bg Ratio | pvalue | p.adjust | qvalue | Count |
| hsa0414412 | Liver | Cirrhotic | Endocytosis | 119/2530 | 251/8465 | 2.33e-09 | 4.56e-08 | 2.81e-08 | 119 |
| hsa0414413 | Liver | Cirrhotic | Endocytosis | 119/2530 | 251/8465 | 2.33e-09 | 4.56e-08 | 2.81e-08 | 119 |
| hsa0414422 | Liver | HCC | Endocytosis | 178/4020 | 251/8465 | 2.03e-14 | 5.22e-13 | 2.91e-13 | 178 |
| hsa0414432 | Liver | HCC | Endocytosis | 178/4020 | 251/8465 | 2.03e-14 | 5.22e-13 | 2.91e-13 | 178 |
| Page: 1 |
Top |
Cell-cell communication analysis |
| Identification of potential cell-cell interactions between two cell types and their ligand-receptor pairs for different disease states |
| Ligand | Receptor | LRpair | Pathway | Tissue | Disease Stage |
| Page: 1 |
Top |
Single-cell gene regulatory network inference analysis |
| Find out the significant the regulons (TFs) and the target genes of each regulon across cell types for different disease states |
| TF | Cell Type | Tissue | Disease Stage | Target Gene | RSS | Regulon Activity |
| ∗The dot plots of a searched regulon are shown for all cell subpopulations in each disease state of each tissue based on the regulon specific score inferred using pySCENIC and by calculating the average expression. |
| Page: 1 |
Top |
Somatic mutation of malignant transformation related genes |
| Annotation of somatic variants for genes involved in malignant transformation |
| Hugo Symbol | Variant Class | Variant Classification | dbSNP RS | HGVSc | HGVSp | HGVSp Short | SWISSPROT | BIOTYPE | SIFT | PolyPhen | Tumor Sample Barcode | Tissue | Histology | Sex | Age | Stage | Therapy Types | Drugs | Outcome |
| IQSEC1 | SNV | Missense_Mutation | novel | c.2047N>A | p.Arg683Ser | p.R683S | protein_coding | deleterious(0.03) | possibly_damaging(0.84) | TCGA-A7-A0DB-01 | Breast | breast invasive carcinoma | Female | <65 | I/II | Hormone Therapy | arimidex | SD | |
| IQSEC1 | SNV | Missense_Mutation | c.1363N>C | p.Asp455His | p.D455H | protein_coding | deleterious(0) | probably_damaging(0.999) | TCGA-AO-A0J4-01 | Breast | breast invasive carcinoma | Female | <65 | I/II | Chemotherapy | doxorubicin | SD | ||
| IQSEC1 | SNV | Missense_Mutation | c.2248G>C | p.Asp750His | p.D750H | protein_coding | deleterious(0) | probably_damaging(0.989) | TCGA-AO-A0JB-01 | Breast | breast invasive carcinoma | Female | <65 | III/IV | Chemotherapy | cyclophosphamide | SD | ||
| IQSEC1 | SNV | Missense_Mutation | novel | c.804N>T | p.Gln268His | p.Q268H | protein_coding | tolerated(0.07) | benign(0.125) | TCGA-E2-A573-01 | Breast | breast invasive carcinoma | Female | <65 | I/II | Chemotherapy | taxotere | CR | |
| IQSEC1 | SNV | Missense_Mutation | novel | c.1843N>C | p.Glu615Gln | p.E615Q | protein_coding | tolerated(0.06) | benign(0.426) | TCGA-EW-A3U0-01 | Breast | breast invasive carcinoma | Female | <65 | III/IV | Chemotherapy | cisplatin | CR | |
| IQSEC1 | insertion | In_Frame_Ins | novel | c.2193_2194insAAT | p.Val731_Leu732insAsn | p.V731_L732insN | protein_coding | TCGA-A2-A0D2-01 | Breast | breast invasive carcinoma | Female | <65 | I/II | Chemotherapy | adriamycin | SD | |||
| IQSEC1 | insertion | Frame_Shift_Ins | novel | c.2192_2193insTCAAATCCTTTATGAAGAACTCCTGACCTTGAGC | p.Leu732GlnfsTer27 | p.L732Qfs*27 | protein_coding | TCGA-A2-A0D2-01 | Breast | breast invasive carcinoma | Female | <65 | I/II | Chemotherapy | adriamycin | SD | |||
| IQSEC1 | deletion | Frame_Shift_Del | novel | c.3300delN | p.Thr1101ProfsTer19 | p.T1101Pfs*19 | protein_coding | TCGA-D8-A27V-01 | Breast | breast invasive carcinoma | Female | <65 | I/II | Hormone Therapy | tamoxiphen | SD | |||
| IQSEC1 | deletion | Frame_Shift_Del | novel | c.2583delN | p.Glu861AspfsTer28 | p.E861Dfs*28 | protein_coding | TCGA-D8-A27V-01 | Breast | breast invasive carcinoma | Female | <65 | I/II | Hormone Therapy | tamoxiphen | SD | |||
| IQSEC1 | SNV | Missense_Mutation | c.62N>T | p.Ser21Phe | p.S21F | protein_coding | tolerated_low_confidence(0.2) | possibly_damaging(0.862) | TCGA-C5-A1M6-01 | Cervix | cervical & endocervical cancer | Female | <65 | I/II | Chemotherapy | cisplatin | PD |
| Page: 1 2 3 4 5 6 7 8 9 10 11 12 |
Top |
Related drugs of malignant transformation related genes |
| Identification of chemicals and drugs interact with genes involved in malignant transfromation |
| (DGIdb 4.0) |
| Entrez ID | Symbol | Category | Interaction Types | Drug Claim Name | Drug Name | PMIDs |
| Page: 1 |

Copyright 2023-Present -The University of Texas Health Science Center at Houston |