
|
|||||
|
 | |
| |
| |
| |
| |
| |
|
Gene: IQGAP1 |
Gene summary for IQGAP1 |
| Gene information | Species | Human | Gene symbol | IQGAP1 | Gene ID | 8826 |
| Gene name | IQ motif containing GTPase activating protein 1 | |
| Gene Alias | HUMORFA01 | |
| Cytomap | 15q26.1 | |
| Gene Type | protein-coding | GO ID | GO:0000165 | UniProtAcc | A0A024RC65 |
Top |
Malignant transformation analysis |
| Identification of the aberrant gene expression in precancerous and cancerous lesions by comparing the gene expression of stem-like cells in diseased tissues with normal stem cells |
| Entrez ID | Symbol | Replicates | Species | Organ | Tissue | Adj P-value | Log2FC | Malignancy |
| 8826 | IQGAP1 | HTA11_3410_2000001011 | Human | Colorectum | AD | 4.46e-11 | -4.68e-01 | 0.0155 |
| 8826 | IQGAP1 | HTA11_78_2000001011 | Human | Colorectum | AD | 9.20e-07 | 6.42e-01 | -0.1088 |
| 8826 | IQGAP1 | HTA11_347_2000001011 | Human | Colorectum | AD | 1.48e-26 | 9.36e-01 | -0.1954 |
| 8826 | IQGAP1 | HTA11_411_2000001011 | Human | Colorectum | SER | 4.45e-05 | 7.50e-01 | -0.2602 |
| 8826 | IQGAP1 | HTA11_99999971662_82457 | Human | Colorectum | MSS | 2.10e-06 | -3.67e-01 | 0.3859 |
| 8826 | IQGAP1 | HTA11_99999973899_84307 | Human | Colorectum | MSS | 2.86e-04 | -4.90e-01 | 0.2585 |
| 8826 | IQGAP1 | HTA11_99999974143_84620 | Human | Colorectum | MSS | 7.27e-20 | -5.83e-01 | 0.3005 |
| 8826 | IQGAP1 | F007 | Human | Colorectum | FAP | 1.50e-03 | -2.70e-01 | 0.1176 |
| 8826 | IQGAP1 | A001-C-207 | Human | Colorectum | FAP | 1.20e-02 | -2.44e-02 | 0.1278 |
| 8826 | IQGAP1 | A015-C-203 | Human | Colorectum | FAP | 3.26e-43 | -4.42e-01 | -0.1294 |
| 8826 | IQGAP1 | A015-C-204 | Human | Colorectum | FAP | 1.51e-07 | -2.92e-01 | -0.0228 |
| 8826 | IQGAP1 | A014-C-040 | Human | Colorectum | FAP | 1.38e-04 | -1.80e-01 | -0.1184 |
| 8826 | IQGAP1 | A002-C-201 | Human | Colorectum | FAP | 2.26e-17 | -2.99e-01 | 0.0324 |
| 8826 | IQGAP1 | A002-C-203 | Human | Colorectum | FAP | 1.04e-04 | -1.35e-01 | 0.2786 |
| 8826 | IQGAP1 | A001-C-119 | Human | Colorectum | FAP | 1.84e-08 | -3.77e-01 | -0.1557 |
| 8826 | IQGAP1 | A001-C-108 | Human | Colorectum | FAP | 9.65e-21 | -1.14e-01 | -0.0272 |
| 8826 | IQGAP1 | A002-C-205 | Human | Colorectum | FAP | 1.43e-28 | -4.52e-01 | -0.1236 |
| 8826 | IQGAP1 | A001-C-104 | Human | Colorectum | FAP | 8.21e-03 | -3.14e-02 | 0.0184 |
| 8826 | IQGAP1 | A015-C-005 | Human | Colorectum | FAP | 1.16e-04 | -2.61e-01 | -0.0336 |
| 8826 | IQGAP1 | A015-C-006 | Human | Colorectum | FAP | 7.66e-21 | -5.94e-01 | -0.0994 |
| Page: 1 2 3 4 5 6 7 8 9 10 11 |
| Tissue | Expression Dynamics | Abbreviation |
| Colorectum (GSE201348) |  | FAP: Familial adenomatous polyposis |
| CRC: Colorectal cancer | ||
| Colorectum (HTA11) |  | AD: Adenomas |
| SER: Sessile serrated lesions | ||
| MSI-H: Microsatellite-high colorectal cancer | ||
| MSS: Microsatellite stable colorectal cancer | ||
| Esophagus | 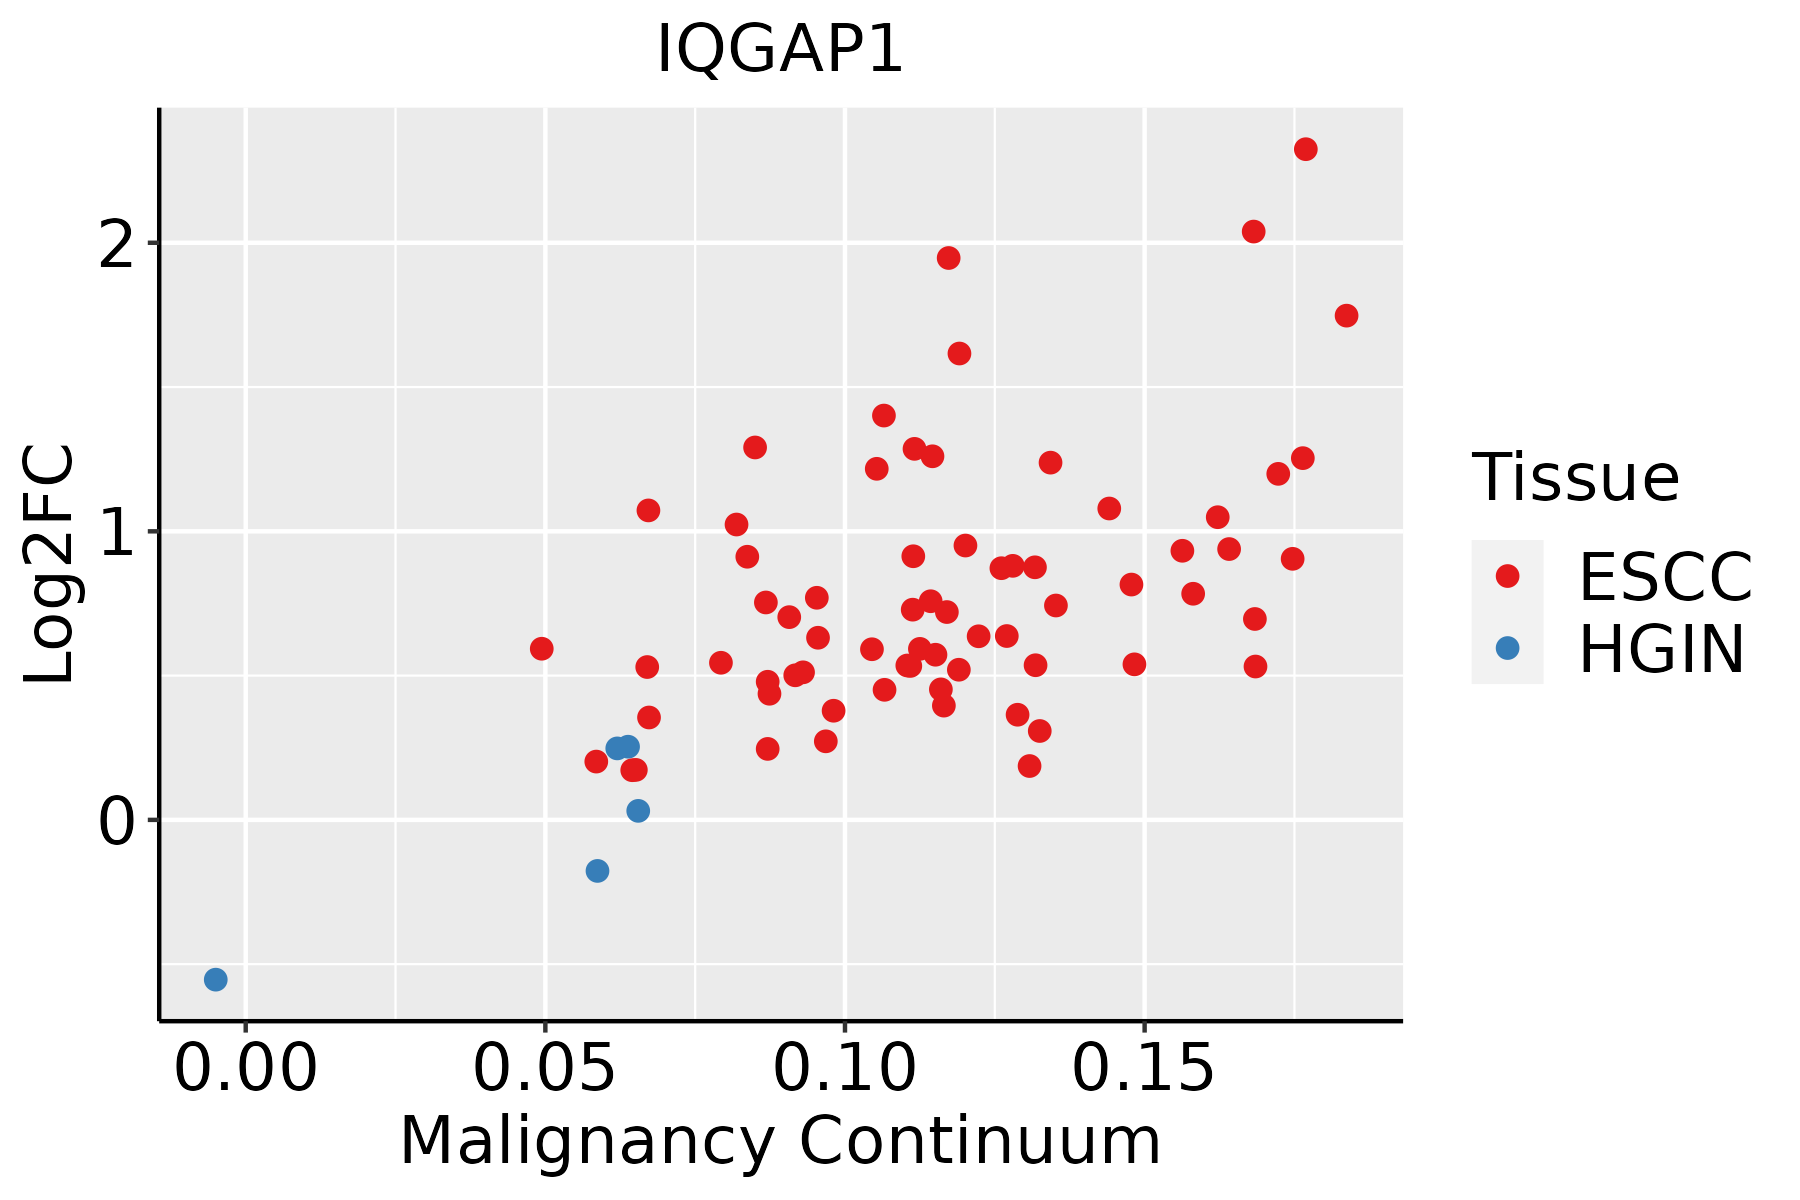 | ESCC: Esophageal squamous cell carcinoma |
| HGIN: High-grade intraepithelial neoplasias | ||
| LGIN: Low-grade intraepithelial neoplasias | ||
| Liver |  | HCC: Hepatocellular carcinoma |
| NAFLD: Non-alcoholic fatty liver disease | ||
| Lung | 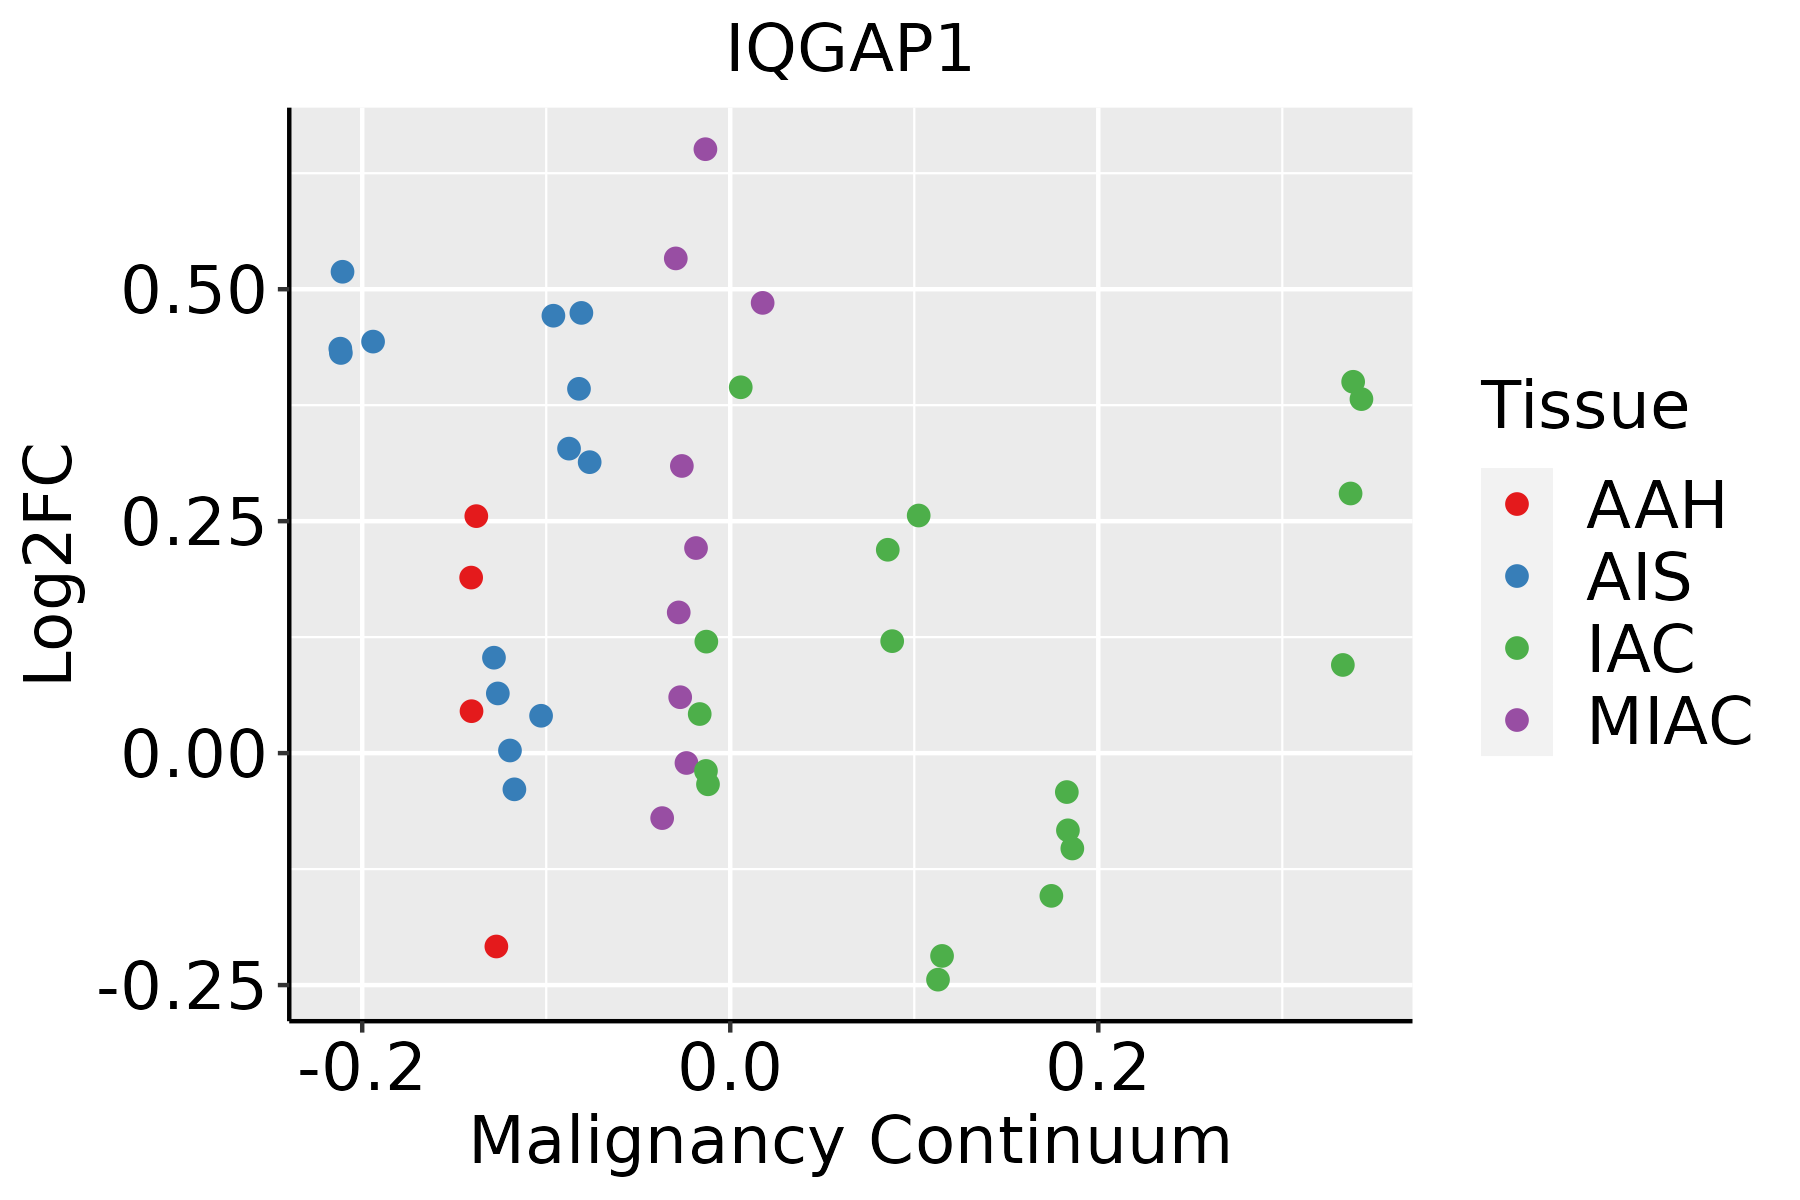 | AAH: Atypical adenomatous hyperplasia |
| AIS: Adenocarcinoma in situ | ||
| IAC: Invasive lung adenocarcinoma | ||
| MIA: Minimally invasive adenocarcinoma | ||
| Oral Cavity |  | EOLP: Erosive Oral lichen planus |
| LP: leukoplakia | ||
| NEOLP: Non-erosive oral lichen planus | ||
| OSCC: Oral squamous cell carcinoma | ||
| Prostate | 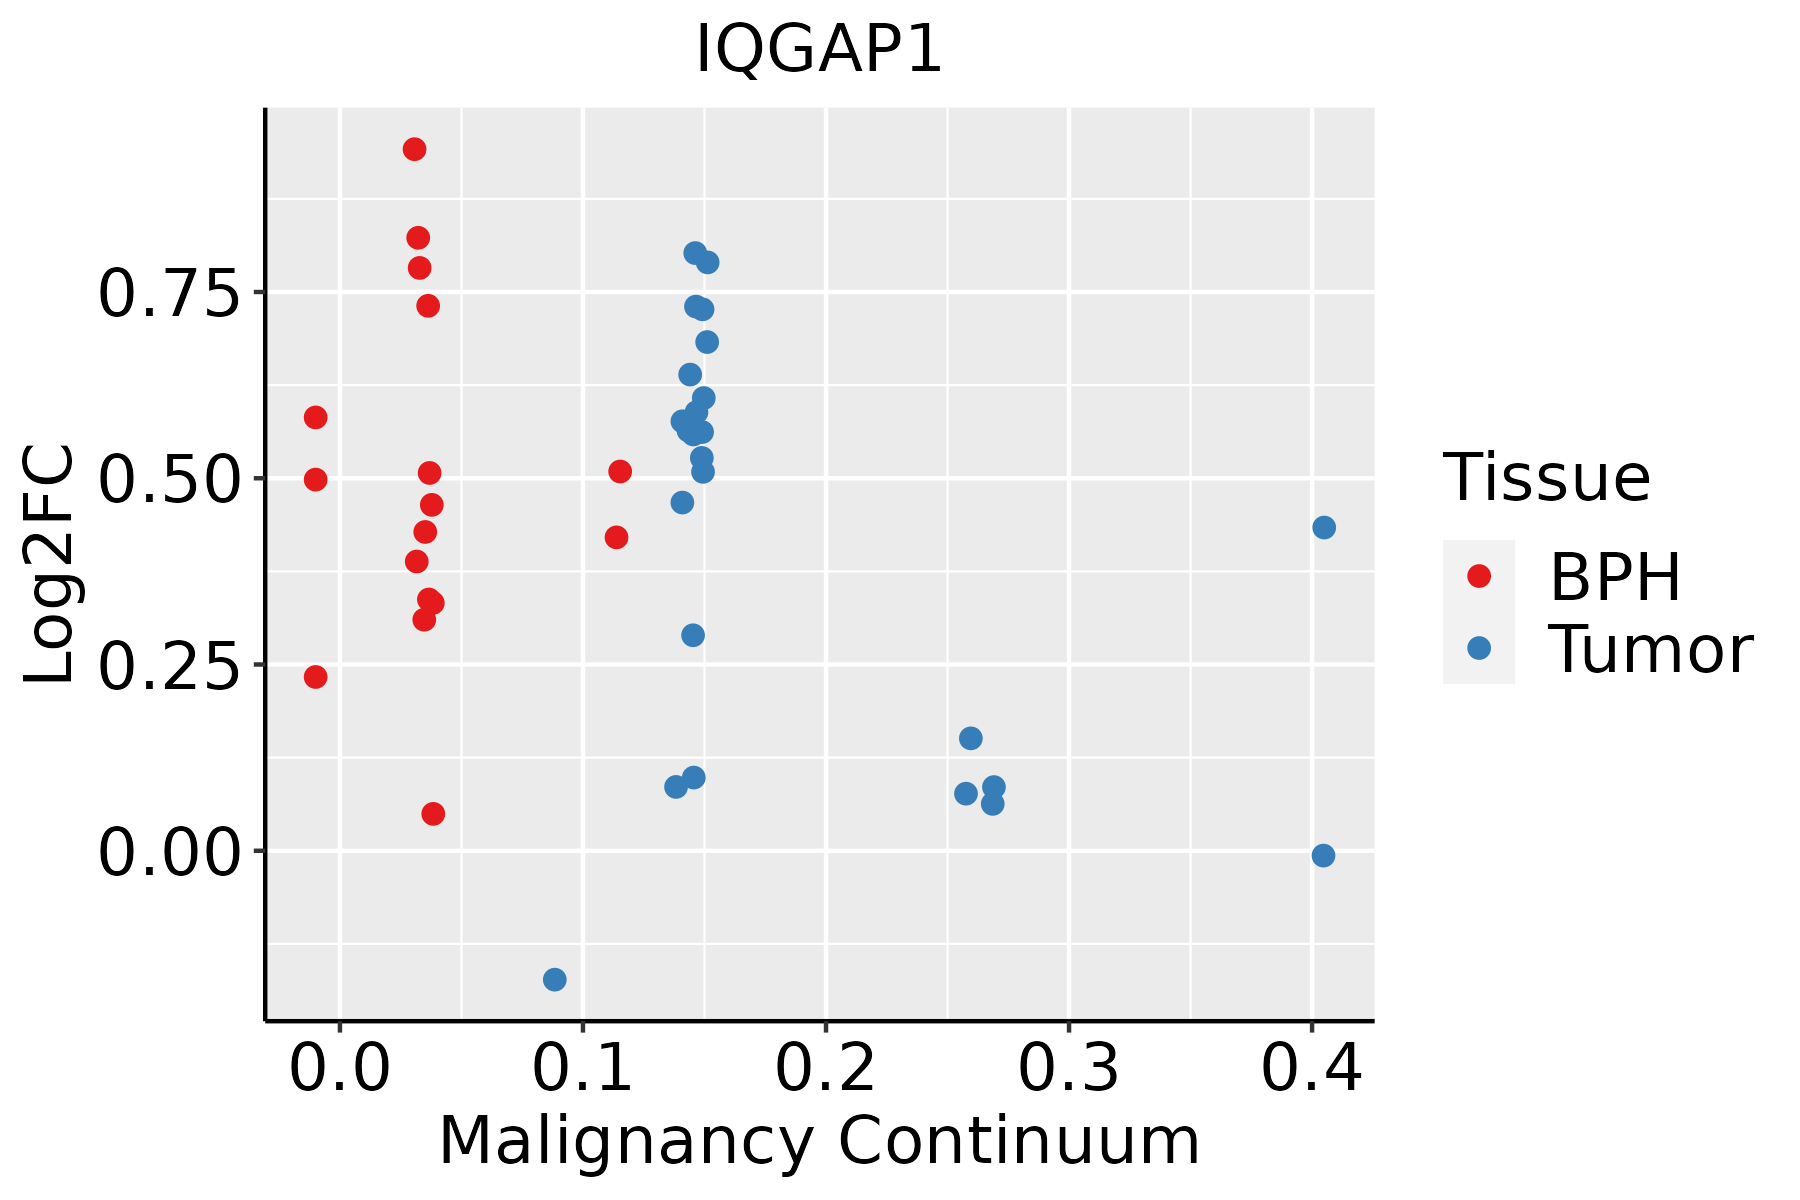 | BPH: Benign Prostatic Hyperplasia |
| Skin |  | AK: Actinic keratosis |
| cSCC: Cutaneous squamous cell carcinoma | ||
| SCCIS:squamous cell carcinoma in situ | ||
| Thyroid |  | ATC: Anaplastic thyroid cancer |
| HT: Hashimoto's thyroiditis | ||
| PTC: Papillary thyroid cancer |
| ∗log2FC in expression of this searched gene in stem-like cells from each diseased tissue sample relative to stem-like cells in normal samples in each tissue plotted against the malignancy continuum. Samples are colored based on if they are from different disease stage. |
Top |
Malignant transformation related pathway analysis |
| Find out the enriched GO biological processes and KEGG pathways involved in transition from healthy to precancer to cancer |
| Tissue | Disease Stage | Enriched GO biological Processes |
| Colorectum | AD |  |
| Colorectum | SER |  |
| Colorectum | MSS |  |
| Colorectum | MSI-H |  |
| Colorectum | FAP |  |
| ∗Top 15 enriched GO BP terms are showed in the bar plot of each disease state in each tissue. Each row represents a significant GO biological process which is colored according to the -log10(p.adjust). |
| Page: 1 2 3 4 5 6 7 8 9 |
| GO ID | Tissue | Disease Stage | Description | Gene Ratio | Bg Ratio | pvalue | p.adjust | Count |
| GO:1903829 | Colorectum | AD | positive regulation of cellular protein localization | 110/3918 | 276/18723 | 4.58e-13 | 8.44e-11 | 110 |
| GO:0032970 | Colorectum | AD | regulation of actin filament-based process | 142/3918 | 397/18723 | 4.05e-12 | 5.90e-10 | 142 |
| GO:0002064 | Colorectum | AD | epithelial cell development | 89/3918 | 220/18723 | 2.98e-11 | 3.52e-09 | 89 |
| GO:0032956 | Colorectum | AD | regulation of actin cytoskeleton organization | 127/3918 | 358/18723 | 1.03e-10 | 1.04e-08 | 127 |
| GO:0038127 | Colorectum | AD | ERBB signaling pathway | 55/3918 | 121/18723 | 1.19e-09 | 8.85e-08 | 55 |
| GO:0007173 | Colorectum | AD | epidermal growth factor receptor signaling pathway | 50/3918 | 108/18723 | 3.08e-09 | 2.07e-07 | 50 |
| GO:0034329 | Colorectum | AD | cell junction assembly | 136/3918 | 420/18723 | 2.02e-08 | 1.15e-06 | 136 |
| GO:0010811 | Colorectum | AD | positive regulation of cell-substrate adhesion | 53/3918 | 123/18723 | 2.30e-08 | 1.27e-06 | 53 |
| GO:0010810 | Colorectum | AD | regulation of cell-substrate adhesion | 81/3918 | 221/18723 | 4.80e-08 | 2.55e-06 | 81 |
| GO:0150115 | Colorectum | AD | cell-substrate junction organization | 44/3918 | 101/18723 | 2.38e-07 | 9.81e-06 | 44 |
| GO:0031589 | Colorectum | AD | cell-substrate adhesion | 116/3918 | 363/18723 | 4.68e-07 | 1.76e-05 | 116 |
| GO:0007044 | Colorectum | AD | cell-substrate junction assembly | 41/3918 | 95/18723 | 8.20e-07 | 2.85e-05 | 41 |
| GO:0043087 | Colorectum | AD | regulation of GTPase activity | 110/3918 | 348/18723 | 1.64e-06 | 5.03e-05 | 110 |
| GO:0001952 | Colorectum | AD | regulation of cell-matrix adhesion | 50/3918 | 128/18723 | 2.05e-06 | 6.05e-05 | 50 |
| GO:0043434 | Colorectum | AD | response to peptide hormone | 126/3918 | 414/18723 | 2.70e-06 | 7.86e-05 | 126 |
| GO:0016049 | Colorectum | AD | cell growth | 143/3918 | 482/18723 | 2.83e-06 | 8.09e-05 | 143 |
| GO:0001954 | Colorectum | AD | positive regulation of cell-matrix adhesion | 27/3918 | 58/18723 | 1.12e-05 | 2.55e-04 | 27 |
| GO:0046777 | Colorectum | AD | protein autophosphorylation | 74/3918 | 227/18723 | 2.48e-05 | 4.76e-04 | 74 |
| GO:0010975 | Colorectum | AD | regulation of neuron projection development | 129/3918 | 445/18723 | 2.88e-05 | 5.37e-04 | 129 |
| GO:0007160 | Colorectum | AD | cell-matrix adhesion | 75/3918 | 233/18723 | 3.56e-05 | 6.45e-04 | 75 |
| Page: 1 2 3 4 5 6 7 8 9 10 11 12 13 14 15 16 17 18 19 20 21 22 23 24 25 26 27 28 29 30 31 32 33 34 35 36 37 38 39 40 41 42 43 44 45 46 47 48 49 50 51 52 53 54 55 56 57 58 |
| Pathway ID | Tissue | Disease Stage | Description | Gene Ratio | Bg Ratio | pvalue | p.adjust | qvalue | Count |
| hsa04520 | Colorectum | AD | Adherens junction | 50/2092 | 93/8465 | 1.52e-09 | 2.83e-08 | 1.81e-08 | 50 |
| hsa05205 | Colorectum | AD | Proteoglycans in cancer | 70/2092 | 205/8465 | 1.37e-03 | 8.46e-03 | 5.39e-03 | 70 |
| hsa04810 | Colorectum | AD | Regulation of actin cytoskeleton | 75/2092 | 229/8465 | 3.36e-03 | 1.76e-02 | 1.12e-02 | 75 |
| hsa045201 | Colorectum | AD | Adherens junction | 50/2092 | 93/8465 | 1.52e-09 | 2.83e-08 | 1.81e-08 | 50 |
| hsa052051 | Colorectum | AD | Proteoglycans in cancer | 70/2092 | 205/8465 | 1.37e-03 | 8.46e-03 | 5.39e-03 | 70 |
| hsa048101 | Colorectum | AD | Regulation of actin cytoskeleton | 75/2092 | 229/8465 | 3.36e-03 | 1.76e-02 | 1.12e-02 | 75 |
| hsa045202 | Colorectum | SER | Adherens junction | 37/1580 | 93/8465 | 1.54e-06 | 2.35e-05 | 1.71e-05 | 37 |
| hsa052052 | Colorectum | SER | Proteoglycans in cancer | 58/1580 | 205/8465 | 4.37e-04 | 3.82e-03 | 2.77e-03 | 58 |
| hsa048102 | Colorectum | SER | Regulation of actin cytoskeleton | 60/1580 | 229/8465 | 2.74e-03 | 2.02e-02 | 1.47e-02 | 60 |
| hsa045203 | Colorectum | SER | Adherens junction | 37/1580 | 93/8465 | 1.54e-06 | 2.35e-05 | 1.71e-05 | 37 |
| hsa052053 | Colorectum | SER | Proteoglycans in cancer | 58/1580 | 205/8465 | 4.37e-04 | 3.82e-03 | 2.77e-03 | 58 |
| hsa048103 | Colorectum | SER | Regulation of actin cytoskeleton | 60/1580 | 229/8465 | 2.74e-03 | 2.02e-02 | 1.47e-02 | 60 |
| hsa045204 | Colorectum | MSS | Adherens junction | 42/1875 | 93/8465 | 6.18e-07 | 9.01e-06 | 5.52e-06 | 42 |
| hsa052054 | Colorectum | MSS | Proteoglycans in cancer | 65/1875 | 205/8465 | 8.66e-04 | 5.38e-03 | 3.29e-03 | 65 |
| hsa048104 | Colorectum | MSS | Regulation of actin cytoskeleton | 68/1875 | 229/8465 | 4.27e-03 | 1.86e-02 | 1.14e-02 | 68 |
| hsa045205 | Colorectum | MSS | Adherens junction | 42/1875 | 93/8465 | 6.18e-07 | 9.01e-06 | 5.52e-06 | 42 |
| hsa052055 | Colorectum | MSS | Proteoglycans in cancer | 65/1875 | 205/8465 | 8.66e-04 | 5.38e-03 | 3.29e-03 | 65 |
| hsa048105 | Colorectum | MSS | Regulation of actin cytoskeleton | 68/1875 | 229/8465 | 4.27e-03 | 1.86e-02 | 1.14e-02 | 68 |
| hsa045208 | Colorectum | FAP | Adherens junction | 45/1404 | 93/8465 | 8.66e-13 | 2.89e-10 | 1.76e-10 | 45 |
| hsa048106 | Colorectum | FAP | Regulation of actin cytoskeleton | 65/1404 | 229/8465 | 4.07e-06 | 5.91e-05 | 3.59e-05 | 65 |
| Page: 1 2 3 4 5 |
Top |
Cell-cell communication analysis |
| Identification of potential cell-cell interactions between two cell types and their ligand-receptor pairs for different disease states |
| Ligand | Receptor | LRpair | Pathway | Tissue | Disease Stage |
| Page: 1 |
Top |
Single-cell gene regulatory network inference analysis |
| Find out the significant the regulons (TFs) and the target genes of each regulon across cell types for different disease states |
| TF | Cell Type | Tissue | Disease Stage | Target Gene | RSS | Regulon Activity |
| ∗The dot plots of a searched regulon are shown for all cell subpopulations in each disease state of each tissue based on the regulon specific score inferred using pySCENIC and by calculating the average expression. |
| Page: 1 |
Top |
Somatic mutation of malignant transformation related genes |
| Annotation of somatic variants for genes involved in malignant transformation |
| Hugo Symbol | Variant Class | Variant Classification | dbSNP RS | HGVSc | HGVSp | HGVSp Short | SWISSPROT | BIOTYPE | SIFT | PolyPhen | Tumor Sample Barcode | Tissue | Histology | Sex | Age | Stage | Therapy Types | Drugs | Outcome |
| IQGAP1 | SNV | Missense_Mutation | c.3757G>A | p.Glu1253Lys | p.E1253K | P46940 | protein_coding | tolerated(0.66) | benign(0.018) | TCGA-AC-A23H-01 | Breast | breast invasive carcinoma | Female | >=65 | I/II | Unknown | Unknown | PD | |
| IQGAP1 | SNV | Missense_Mutation | novel | c.3227N>G | p.Val1076Gly | p.V1076G | P46940 | protein_coding | deleterious(0) | probably_damaging(0.997) | TCGA-AC-A3W5-01 | Breast | breast invasive carcinoma | Female | >=65 | I/II | Chemotherapy | docetaxel | CR |
| IQGAP1 | SNV | Missense_Mutation | novel | c.1006N>G | p.Arg336Gly | p.R336G | P46940 | protein_coding | tolerated(0.12) | benign(0.106) | TCGA-AC-A3W6-01 | Breast | breast invasive carcinoma | Female | >=65 | III/IV | Unknown | Unknown | SD |
| IQGAP1 | SNV | Missense_Mutation | c.2844G>T | p.Met948Ile | p.M948I | P46940 | protein_coding | deleterious(0.02) | benign(0.009) | TCGA-BH-A0B9-01 | Breast | breast invasive carcinoma | Female | <65 | I/II | Chemotherapy | cyclophosphamide | SD | |
| IQGAP1 | SNV | Missense_Mutation | c.2844N>A | p.Met948Ile | p.M948I | P46940 | protein_coding | deleterious(0.02) | benign(0.009) | TCGA-D8-A1JA-01 | Breast | breast invasive carcinoma | Female | <65 | III/IV | Chemotherapy | adriamycin | PD | |
| IQGAP1 | SNV | Missense_Mutation | c.3315N>C | p.Gln1105His | p.Q1105H | P46940 | protein_coding | deleterious(0.01) | probably_damaging(0.953) | TCGA-D8-A1JA-01 | Breast | breast invasive carcinoma | Female | <65 | III/IV | Chemotherapy | adriamycin | PD | |
| IQGAP1 | insertion | Frame_Shift_Ins | novel | c.1231_1232insGAGAACAGTTAGGAGGCTGCTTTTTGAAGAAAACATCT | p.Leu411ArgfsTer14 | p.L411Rfs*14 | P46940 | protein_coding | TCGA-BH-A0BA-01 | Breast | breast invasive carcinoma | Female | <65 | III/IV | Chemotherapy | cytoxan | SD | ||
| IQGAP1 | insertion | Frame_Shift_Ins | novel | c.2814_2815insA | p.Asn941LysfsTer2 | p.N941Kfs*2 | P46940 | protein_coding | TCGA-BH-A18G-01 | Breast | breast invasive carcinoma | Female | >=65 | I/II | Unknown | Unknown | SD | ||
| IQGAP1 | SNV | Missense_Mutation | c.4966N>A | p.Gly1656Arg | p.G1656R | P46940 | protein_coding | tolerated(0.16) | benign(0.119) | TCGA-C5-A7UE-01 | Cervix | cervical & endocervical cancer | Female | <65 | I/II | Chemotherapy | cisplatin | SD | |
| IQGAP1 | SNV | Missense_Mutation | c.2715N>T | p.Gln905His | p.Q905H | P46940 | protein_coding | deleterious(0.01) | probably_damaging(0.957) | TCGA-EA-A439-01 | Cervix | cervical & endocervical cancer | Female | <65 | I/II | Unknown | Unknown | PD |
| Page: 1 2 3 4 5 6 7 8 9 10 11 12 13 14 15 |
Top |
Related drugs of malignant transformation related genes |
| Identification of chemicals and drugs interact with genes involved in malignant transfromation |
| (DGIdb 4.0) |
| Entrez ID | Symbol | Category | Interaction Types | Drug Claim Name | Drug Name | PMIDs |
| Page: 1 |

Copyright 2023-Present -The University of Texas Health Science Center at Houston |