
|
|||||
|
 | |
| |
| |
| |
| |
| |
|
Gene: IQCK |
Gene summary for IQCK |
| Gene information | Species | Human | Gene symbol | IQCK | Gene ID | 124152 |
| Gene name | IQ motif containing K | |
| Gene Alias | IQCK | |
| Cytomap | 16p12.3 | |
| Gene Type | protein-coding | GO ID | NA | UniProtAcc | B4E1V3 |
Top |
Malignant transformation analysis |
| Identification of the aberrant gene expression in precancerous and cancerous lesions by comparing the gene expression of stem-like cells in diseased tissues with normal stem cells |
| Entrez ID | Symbol | Replicates | Species | Organ | Tissue | Adj P-value | Log2FC | Malignancy |
| 124152 | IQCK | LZE7T | Human | Esophagus | ESCC | 3.46e-03 | 1.24e-01 | 0.0667 |
| 124152 | IQCK | LZE8T | Human | Esophagus | ESCC | 1.06e-02 | 7.54e-02 | 0.067 |
| 124152 | IQCK | LZE24T | Human | Esophagus | ESCC | 1.50e-04 | 1.57e-01 | 0.0596 |
| 124152 | IQCK | P1T-E | Human | Esophagus | ESCC | 1.25e-03 | 1.69e-01 | 0.0875 |
| 124152 | IQCK | P2T-E | Human | Esophagus | ESCC | 5.69e-44 | 7.03e-01 | 0.1177 |
| 124152 | IQCK | P4T-E | Human | Esophagus | ESCC | 9.32e-14 | 2.26e-01 | 0.1323 |
| 124152 | IQCK | P5T-E | Human | Esophagus | ESCC | 4.42e-05 | 1.12e-01 | 0.1327 |
| 124152 | IQCK | P8T-E | Human | Esophagus | ESCC | 2.50e-14 | 3.67e-01 | 0.0889 |
| 124152 | IQCK | P9T-E | Human | Esophagus | ESCC | 2.10e-03 | 5.98e-02 | 0.1131 |
| 124152 | IQCK | P10T-E | Human | Esophagus | ESCC | 5.31e-10 | 1.17e-01 | 0.116 |
| 124152 | IQCK | P11T-E | Human | Esophagus | ESCC | 1.35e-07 | 2.46e-01 | 0.1426 |
| 124152 | IQCK | P12T-E | Human | Esophagus | ESCC | 8.57e-12 | 1.77e-01 | 0.1122 |
| 124152 | IQCK | P15T-E | Human | Esophagus | ESCC | 1.29e-14 | 2.34e-01 | 0.1149 |
| 124152 | IQCK | P16T-E | Human | Esophagus | ESCC | 5.97e-35 | 6.85e-01 | 0.1153 |
| 124152 | IQCK | P17T-E | Human | Esophagus | ESCC | 4.42e-03 | 1.07e-01 | 0.1278 |
| 124152 | IQCK | P20T-E | Human | Esophagus | ESCC | 6.83e-09 | 1.25e-01 | 0.1124 |
| 124152 | IQCK | P21T-E | Human | Esophagus | ESCC | 1.86e-09 | 2.81e-01 | 0.1617 |
| 124152 | IQCK | P22T-E | Human | Esophagus | ESCC | 1.44e-15 | 1.91e-01 | 0.1236 |
| 124152 | IQCK | P23T-E | Human | Esophagus | ESCC | 8.98e-09 | 2.49e-01 | 0.108 |
| 124152 | IQCK | P24T-E | Human | Esophagus | ESCC | 1.21e-10 | 2.54e-01 | 0.1287 |
| Page: 1 2 3 4 |
| Tissue | Expression Dynamics | Abbreviation |
| Esophagus | 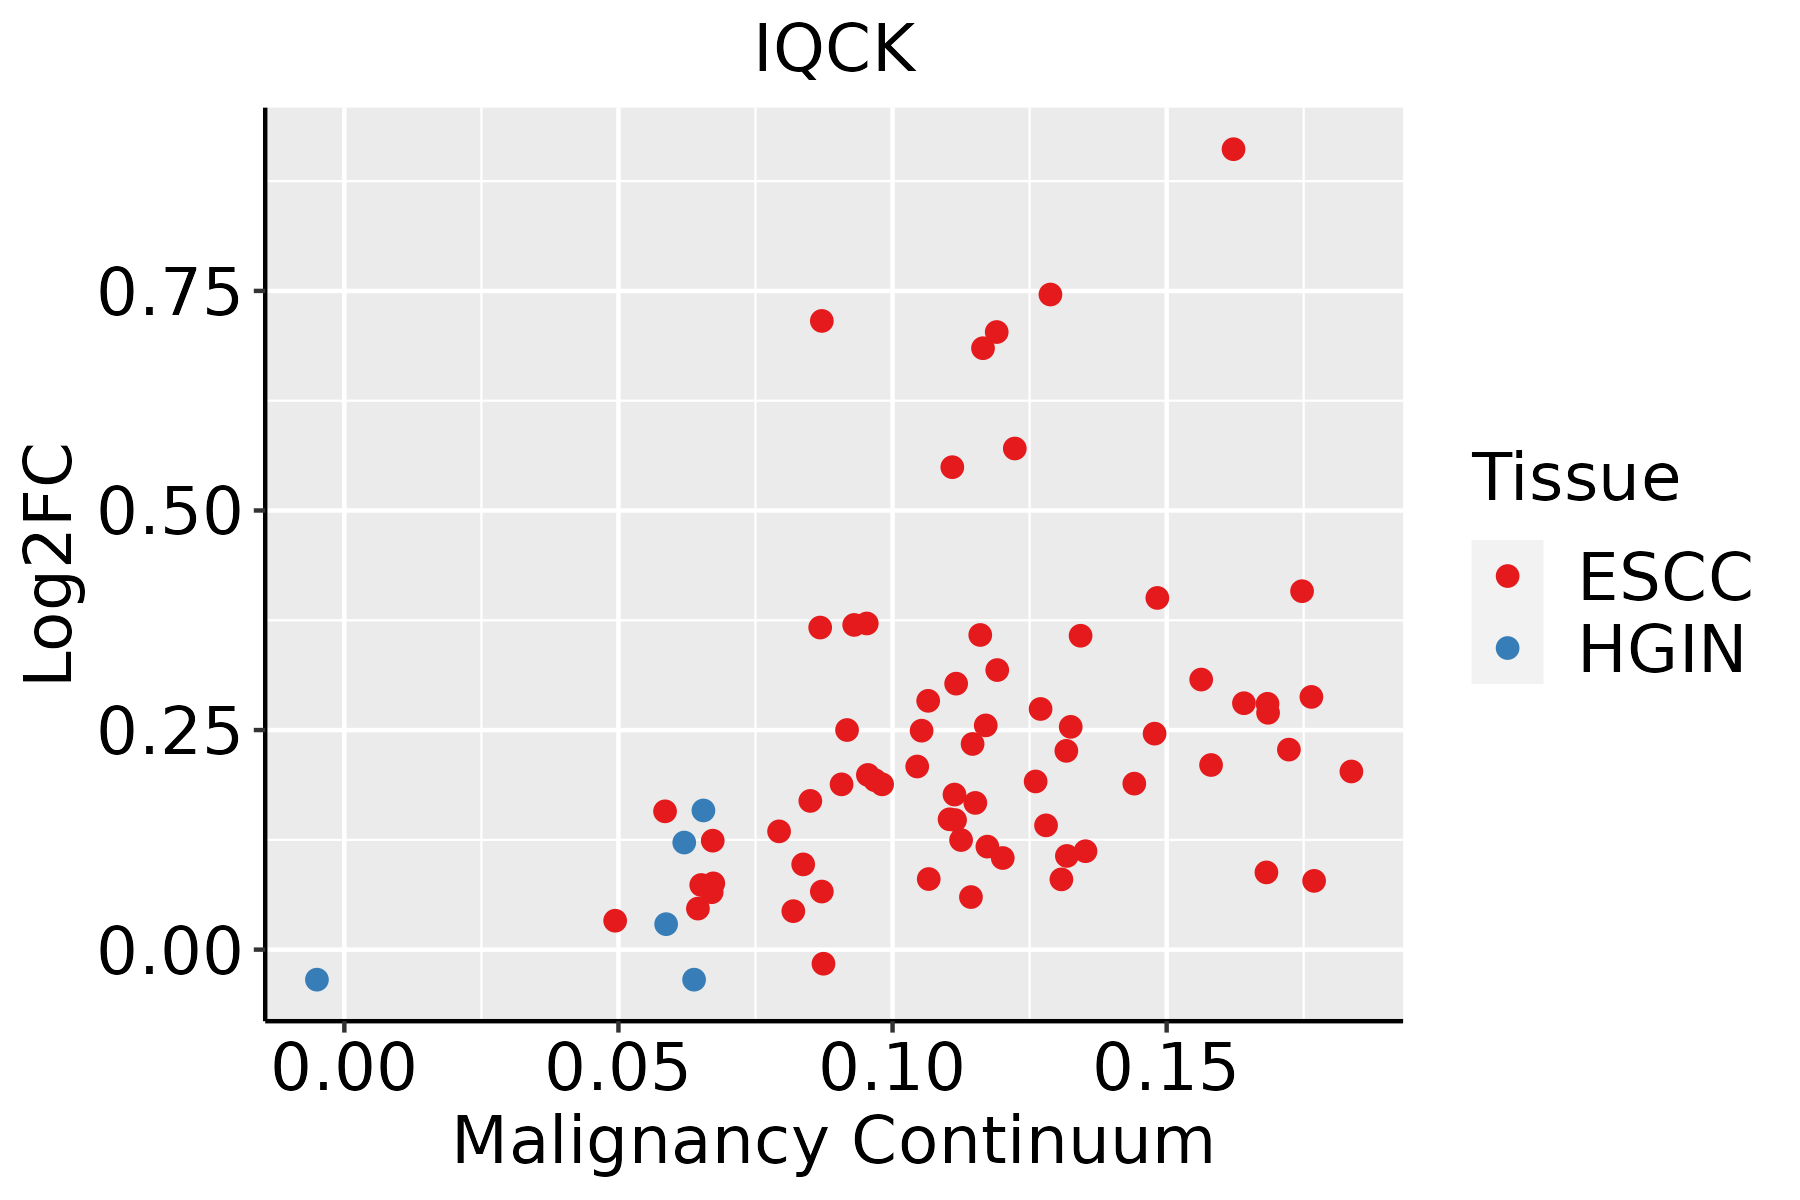 | ESCC: Esophageal squamous cell carcinoma |
| HGIN: High-grade intraepithelial neoplasias | ||
| LGIN: Low-grade intraepithelial neoplasias | ||
| Thyroid | 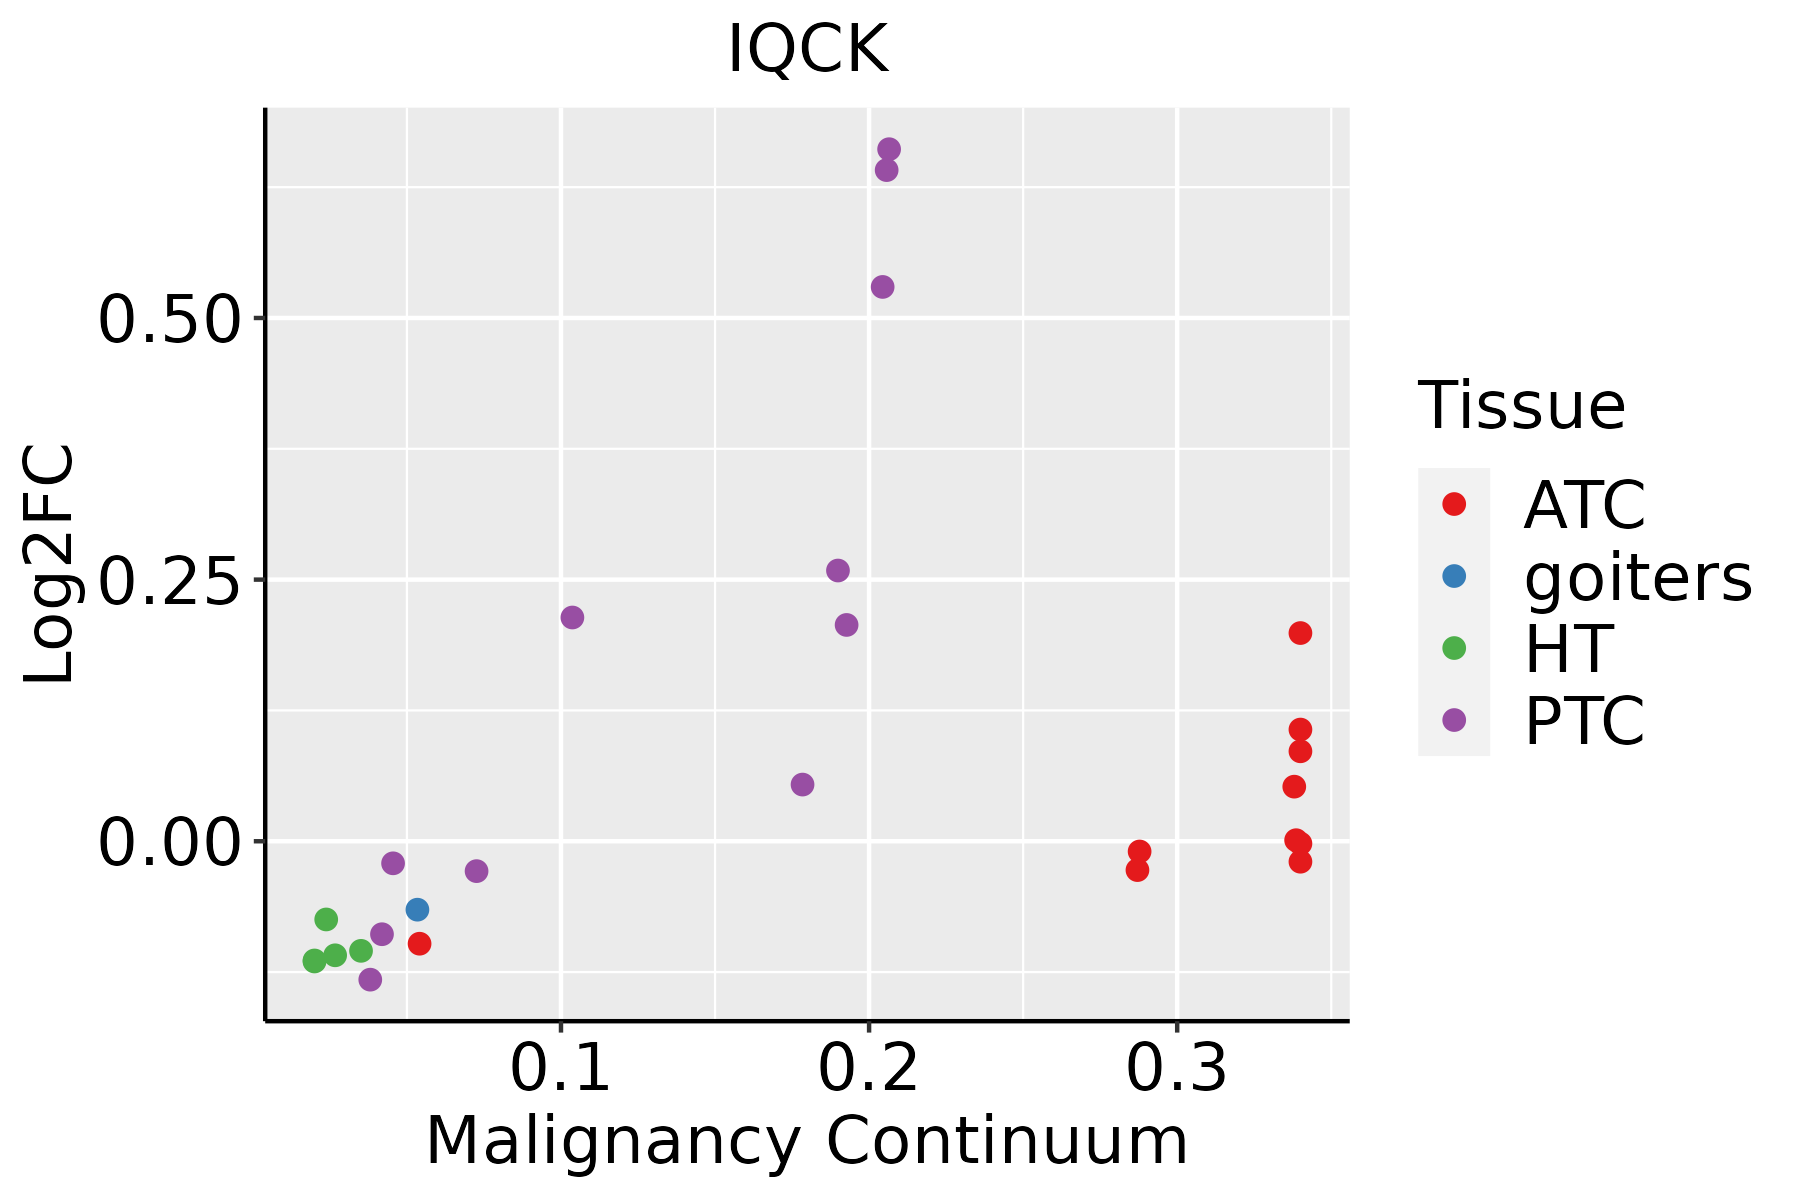 | ATC: Anaplastic thyroid cancer |
| HT: Hashimoto's thyroiditis | ||
| PTC: Papillary thyroid cancer |
| ∗log2FC in expression of this searched gene in stem-like cells from each diseased tissue sample relative to stem-like cells in normal samples in each tissue plotted against the malignancy continuum. Samples are colored based on if they are from different disease stage. |
Top |
Malignant transformation related pathway analysis |
| Find out the enriched GO biological processes and KEGG pathways involved in transition from healthy to precancer to cancer |
| Tissue | Disease Stage | Enriched GO biological Processes |
| Colorectum | AD |  |
| Colorectum | SER |  |
| Colorectum | MSS |  |
| Colorectum | MSI-H |  |
| Colorectum | FAP |  |
| ∗Top 15 enriched GO BP terms are showed in the bar plot of each disease state in each tissue. Each row represents a significant GO biological process which is colored according to the -log10(p.adjust). |
| Page: 1 2 3 4 5 6 7 8 9 |
| GO ID | Tissue | Disease Stage | Description | Gene Ratio | Bg Ratio | pvalue | p.adjust | Count |
| Page: 1 |
| Pathway ID | Tissue | Disease Stage | Description | Gene Ratio | Bg Ratio | pvalue | p.adjust | qvalue | Count |
| Page: 1 |
Top |
Cell-cell communication analysis |
| Identification of potential cell-cell interactions between two cell types and their ligand-receptor pairs for different disease states |
| Ligand | Receptor | LRpair | Pathway | Tissue | Disease Stage |
| Page: 1 |
Top |
Single-cell gene regulatory network inference analysis |
| Find out the significant the regulons (TFs) and the target genes of each regulon across cell types for different disease states |
| TF | Cell Type | Tissue | Disease Stage | Target Gene | RSS | Regulon Activity |
| ∗The dot plots of a searched regulon are shown for all cell subpopulations in each disease state of each tissue based on the regulon specific score inferred using pySCENIC and by calculating the average expression. |
| Page: 1 |
Top |
Somatic mutation of malignant transformation related genes |
| Annotation of somatic variants for genes involved in malignant transformation |
| Hugo Symbol | Variant Class | Variant Classification | dbSNP RS | HGVSc | HGVSp | HGVSp Short | SWISSPROT | BIOTYPE | SIFT | PolyPhen | Tumor Sample Barcode | Tissue | Histology | Sex | Age | Stage | Therapy Types | Drugs | Outcome |
| IQCK | SNV | Missense_Mutation | c.22C>A | p.Pro8Thr | p.P8T | Q8N0W5 | protein_coding | tolerated_low_confidence(0.84) | benign(0.058) | TCGA-BH-A0AZ-01 | Breast | breast invasive carcinoma | Female | <65 | III/IV | Chemotherapy | doxorubicin | CR | |
| IQCK | SNV | Missense_Mutation | novel | c.209N>A | p.Pro70Gln | p.P70Q | Q8N0W5 | protein_coding | deleterious(0.02) | probably_damaging(0.983) | TCGA-BH-A0HK-01 | Breast | breast invasive carcinoma | Female | >=65 | I/II | Hormone Therapy | arimidex | SD |
| IQCK | SNV | Missense_Mutation | c.167A>T | p.Glu56Val | p.E56V | Q8N0W5 | protein_coding | deleterious(0.03) | possibly_damaging(0.893) | TCGA-CK-4951-01 | Colorectum | colon adenocarcinoma | Female | >=65 | I/II | Unknown | Unknown | PD | |
| IQCK | SNV | Missense_Mutation | rs766973246 | c.722N>A | p.Arg241His | p.R241H | Q8N0W5 | protein_coding | deleterious(0) | probably_damaging(0.999) | TCGA-AG-A02X-01 | Colorectum | rectum adenocarcinoma | Male | >=65 | I/II | Unknown | Unknown | SD |
| IQCK | deletion | Frame_Shift_Del | c.748_752delNNNNN | p.Lys251HisfsTer59 | p.K251Hfs*59 | Q8N0W5 | protein_coding | TCGA-AG-A01N-01 | Colorectum | rectum adenocarcinoma | Female | >=65 | III/IV | Chemotherapy | capecitabine | SD | |||
| IQCK | SNV | Missense_Mutation | c.287C>T | p.Ala96Val | p.A96V | Q8N0W5 | protein_coding | tolerated(0.19) | benign(0.005) | TCGA-AP-A051-01 | Endometrium | uterine corpus endometrioid carcinoma | Female | >=65 | I/II | Unknown | Unknown | SD | |
| IQCK | SNV | Missense_Mutation | rs766973246 | c.722G>A | p.Arg241His | p.R241H | Q8N0W5 | protein_coding | deleterious(0) | probably_damaging(0.999) | TCGA-AP-A051-01 | Endometrium | uterine corpus endometrioid carcinoma | Female | >=65 | I/II | Unknown | Unknown | SD |
| IQCK | SNV | Missense_Mutation | rs763611697 | c.482N>T | p.Arg161Ile | p.R161I | Q8N0W5 | protein_coding | deleterious(0.04) | probably_damaging(0.956) | TCGA-AP-A0LM-01 | Endometrium | uterine corpus endometrioid carcinoma | Female | <65 | III/IV | Chemotherapy | cisplatin | SD |
| IQCK | SNV | Missense_Mutation | rs376359131 | c.742N>T | p.Arg248Cys | p.R248C | Q8N0W5 | protein_coding | deleterious(0) | possibly_damaging(0.897) | TCGA-AP-A0LM-01 | Endometrium | uterine corpus endometrioid carcinoma | Female | <65 | III/IV | Chemotherapy | cisplatin | SD |
| IQCK | SNV | Missense_Mutation | c.694N>A | p.Arg232Ser | p.R232S | Q8N0W5 | protein_coding | deleterious(0) | probably_damaging(0.999) | TCGA-AX-A05Z-01 | Endometrium | uterine corpus endometrioid carcinoma | Female | <65 | III/IV | Chemotherapy | adriamycin | SD |
| Page: 1 2 |
Top |
Related drugs of malignant transformation related genes |
| Identification of chemicals and drugs interact with genes involved in malignant transfromation |
| (DGIdb 4.0) |
| Entrez ID | Symbol | Category | Interaction Types | Drug Claim Name | Drug Name | PMIDs |
| Page: 1 |

Copyright 2023-Present -The University of Texas Health Science Center at Houston |