
|
|||||
|
 | |
| |
| |
| |
| |
| |
|
Gene: IQCJ-SCHIP1 |
Gene summary for IQCJ-SCHIP1 |
| Gene information | Species | Human | Gene symbol | IQCJ-SCHIP1 | Gene ID | 100505385 |
| Gene name | IQCJ-SCHIP1 readthrough | |
| Gene Alias | IQCJ-SCHIP1 | |
| Cytomap | 3q25.32-q25.33 | |
| Gene Type | protein-coding | GO ID | GO:0006996 | UniProtAcc | B3KU38 |
Top |
Malignant transformation analysis |
| Identification of the aberrant gene expression in precancerous and cancerous lesions by comparing the gene expression of stem-like cells in diseased tissues with normal stem cells |
| Entrez ID | Symbol | Replicates | Species | Organ | Tissue | Adj P-value | Log2FC | Malignancy |
| 100505385 | IQCJ-SCHIP1 | CCI_2 | Human | Cervix | CC | 2.27e-22 | 1.94e+00 | 0.5249 |
| 100505385 | IQCJ-SCHIP1 | CCI_3 | Human | Cervix | CC | 1.16e-14 | 7.81e-01 | 0.516 |
| 100505385 | IQCJ-SCHIP1 | LZE4T | Human | Esophagus | ESCC | 1.70e-03 | 1.52e-01 | 0.0811 |
| 100505385 | IQCJ-SCHIP1 | LZE22T | Human | Esophagus | ESCC | 1.57e-03 | 3.89e-01 | 0.068 |
| 100505385 | IQCJ-SCHIP1 | LZE24T | Human | Esophagus | ESCC | 1.89e-10 | 2.92e-01 | 0.0596 |
| 100505385 | IQCJ-SCHIP1 | LZE21T | Human | Esophagus | ESCC | 1.78e-08 | 4.29e-01 | 0.0655 |
| 100505385 | IQCJ-SCHIP1 | P1T-E | Human | Esophagus | ESCC | 2.44e-06 | 3.99e-01 | 0.0875 |
| 100505385 | IQCJ-SCHIP1 | P2T-E | Human | Esophagus | ESCC | 9.14e-50 | 9.04e-01 | 0.1177 |
| 100505385 | IQCJ-SCHIP1 | P4T-E | Human | Esophagus | ESCC | 4.05e-24 | 5.44e-01 | 0.1323 |
| 100505385 | IQCJ-SCHIP1 | P5T-E | Human | Esophagus | ESCC | 7.28e-26 | 5.45e-01 | 0.1327 |
| 100505385 | IQCJ-SCHIP1 | P8T-E | Human | Esophagus | ESCC | 1.30e-15 | 3.01e-01 | 0.0889 |
| 100505385 | IQCJ-SCHIP1 | P9T-E | Human | Esophagus | ESCC | 1.45e-25 | 5.52e-01 | 0.1131 |
| 100505385 | IQCJ-SCHIP1 | P10T-E | Human | Esophagus | ESCC | 6.31e-48 | 7.85e-01 | 0.116 |
| 100505385 | IQCJ-SCHIP1 | P11T-E | Human | Esophagus | ESCC | 2.94e-14 | 5.27e-01 | 0.1426 |
| 100505385 | IQCJ-SCHIP1 | P12T-E | Human | Esophagus | ESCC | 7.52e-23 | 4.18e-01 | 0.1122 |
| 100505385 | IQCJ-SCHIP1 | P15T-E | Human | Esophagus | ESCC | 4.29e-21 | 5.22e-01 | 0.1149 |
| 100505385 | IQCJ-SCHIP1 | P16T-E | Human | Esophagus | ESCC | 8.84e-05 | 1.41e-01 | 0.1153 |
| 100505385 | IQCJ-SCHIP1 | P17T-E | Human | Esophagus | ESCC | 2.60e-06 | 3.15e-01 | 0.1278 |
| 100505385 | IQCJ-SCHIP1 | P19T-E | Human | Esophagus | ESCC | 1.17e-11 | 5.98e-01 | 0.1662 |
| 100505385 | IQCJ-SCHIP1 | P20T-E | Human | Esophagus | ESCC | 1.09e-26 | 5.99e-01 | 0.1124 |
| Page: 1 2 3 4 |
| Tissue | Expression Dynamics | Abbreviation |
| Cervix | 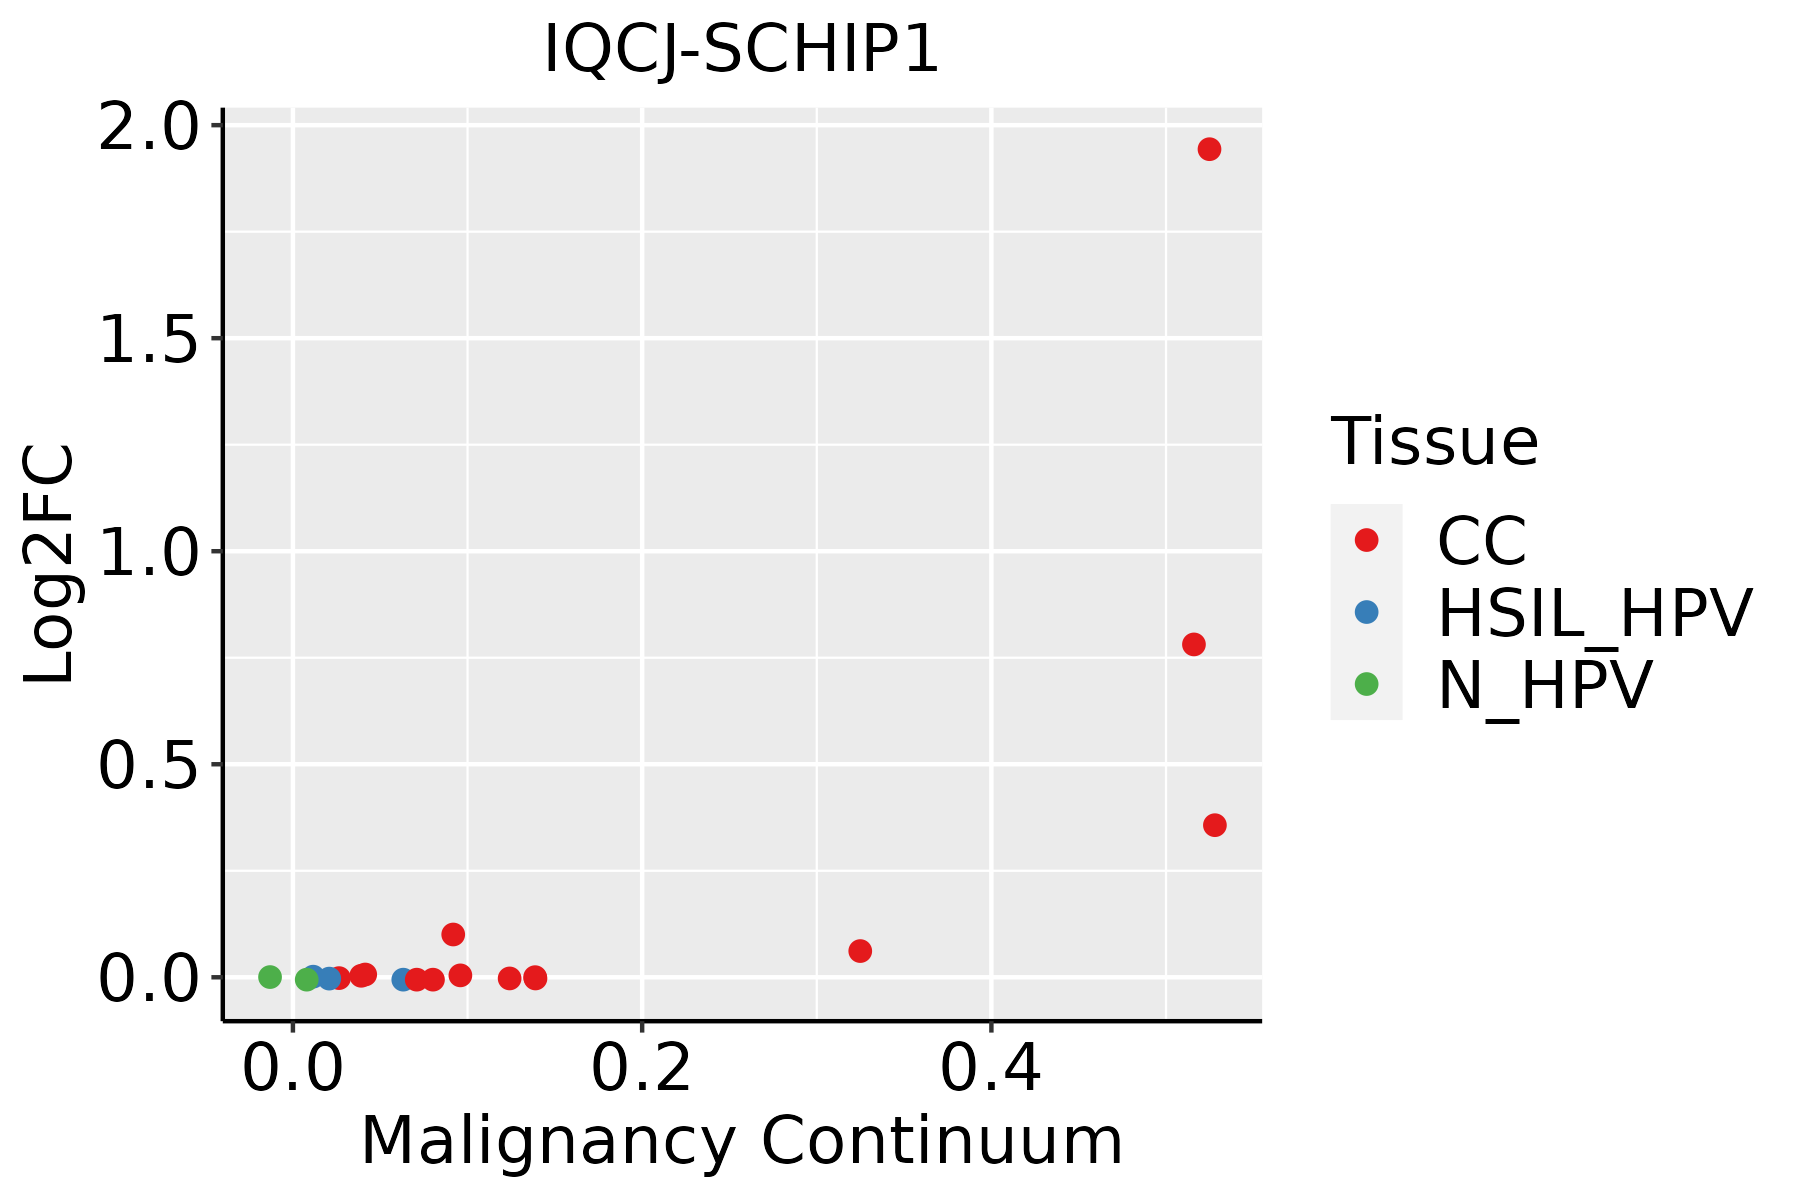 | CC: Cervix cancer |
| HSIL_HPV: HPV-infected high-grade squamous intraepithelial lesions | ||
| N_HPV: HPV-infected normal cervix | ||
| Esophagus |  | ESCC: Esophageal squamous cell carcinoma |
| HGIN: High-grade intraepithelial neoplasias | ||
| LGIN: Low-grade intraepithelial neoplasias | ||
| Lung | 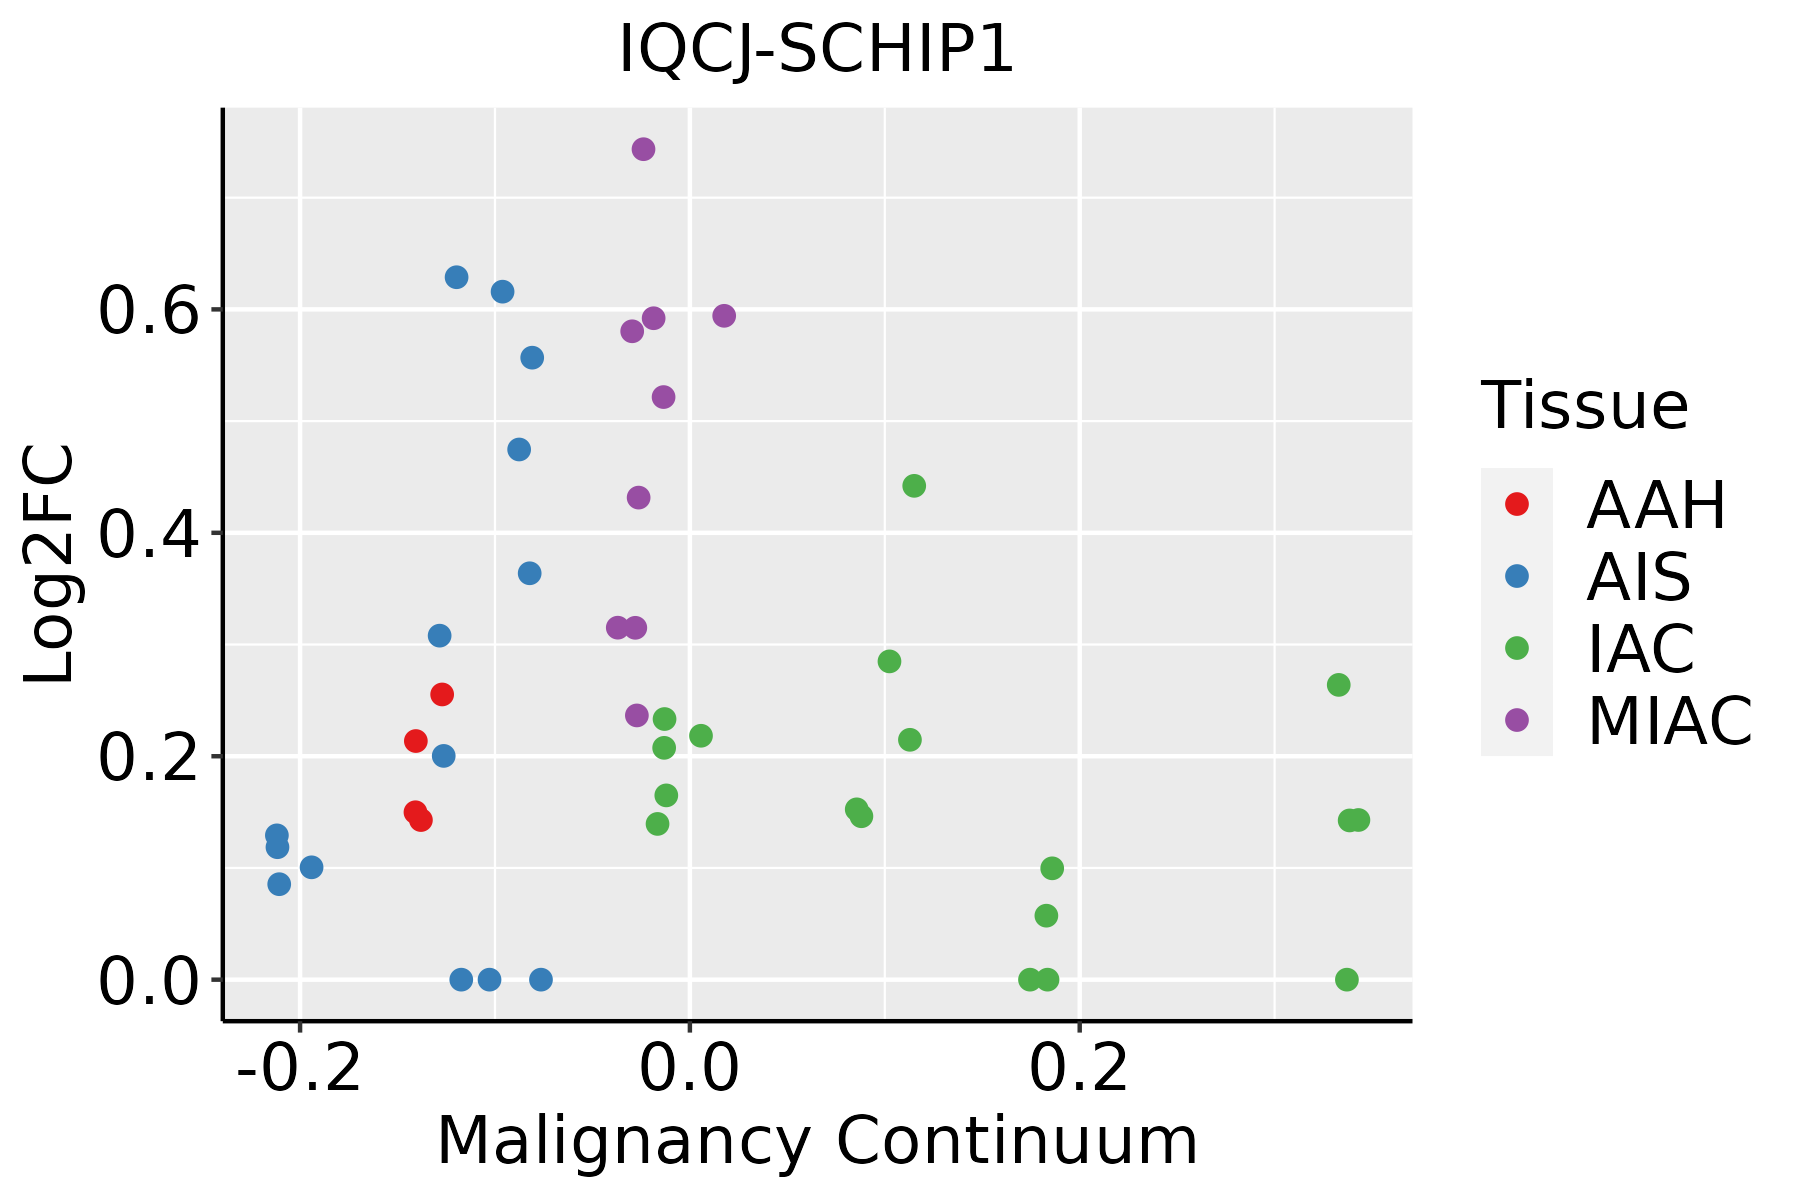 | AAH: Atypical adenomatous hyperplasia |
| AIS: Adenocarcinoma in situ | ||
| IAC: Invasive lung adenocarcinoma | ||
| MIA: Minimally invasive adenocarcinoma |
| ∗log2FC in expression of this searched gene in stem-like cells from each diseased tissue sample relative to stem-like cells in normal samples in each tissue plotted against the malignancy continuum. Samples are colored based on if they are from different disease stage. |
Top |
Malignant transformation related pathway analysis |
| Find out the enriched GO biological processes and KEGG pathways involved in transition from healthy to precancer to cancer |
| Tissue | Disease Stage | Enriched GO biological Processes |
| Colorectum | AD |  |
| Colorectum | SER |  |
| Colorectum | MSS |  |
| Colorectum | MSI-H |  |
| Colorectum | FAP |  |
| ∗Top 15 enriched GO BP terms are showed in the bar plot of each disease state in each tissue. Each row represents a significant GO biological process which is colored according to the -log10(p.adjust). |
| Page: 1 2 3 4 5 6 7 8 9 |
| GO ID | Tissue | Disease Stage | Description | Gene Ratio | Bg Ratio | pvalue | p.adjust | Count |
| GO:00106399 | Cervix | CC | negative regulation of organelle organization | 68/2311 | 348/18723 | 7.40e-05 | 1.03e-03 | 68 |
| GO:00514948 | Cervix | CC | negative regulation of cytoskeleton organization | 37/2311 | 163/18723 | 1.57e-04 | 1.88e-03 | 37 |
| GO:00353294 | Cervix | CC | hippo signaling | 12/2311 | 40/18723 | 2.44e-03 | 1.71e-02 | 12 |
| GO:00353301 | Cervix | CC | regulation of hippo signaling | 7/2311 | 21/18723 | 1.04e-02 | 4.97e-02 | 7 |
| GO:0010639110 | Esophagus | ESCC | negative regulation of organelle organization | 215/8552 | 348/18723 | 8.20e-10 | 2.01e-08 | 215 |
| GO:00353297 | Esophagus | ESCC | hippo signaling | 26/8552 | 40/18723 | 1.08e-02 | 3.66e-02 | 26 |
| GO:00106398 | Lung | IAC | negative regulation of organelle organization | 68/2061 | 348/18723 | 1.69e-06 | 8.24e-05 | 68 |
| GO:00514947 | Lung | IAC | negative regulation of cytoskeleton organization | 38/2061 | 163/18723 | 5.35e-06 | 2.08e-04 | 38 |
| GO:00353293 | Lung | IAC | hippo signaling | 11/2061 | 40/18723 | 3.13e-03 | 2.75e-02 | 11 |
| GO:0035330 | Lung | IAC | regulation of hippo signaling | 7/2061 | 21/18723 | 5.59e-03 | 4.12e-02 | 7 |
| GO:001063913 | Lung | AIS | negative regulation of organelle organization | 61/1849 | 348/18723 | 6.53e-06 | 2.92e-04 | 61 |
| GO:005149412 | Lung | AIS | negative regulation of cytoskeleton organization | 33/1849 | 163/18723 | 4.95e-05 | 1.43e-03 | 33 |
| GO:00353291 | Lung | AIS | hippo signaling | 10/1849 | 40/18723 | 4.59e-03 | 4.03e-02 | 10 |
| GO:001063922 | Lung | MIAC | negative regulation of organelle organization | 36/967 | 348/18723 | 5.99e-05 | 2.98e-03 | 36 |
| GO:005149431 | Lung | MIAC | negative regulation of cytoskeleton organization | 21/967 | 163/18723 | 1.03e-04 | 4.44e-03 | 21 |
| GO:00353292 | Lung | MIAC | hippo signaling | 8/967 | 40/18723 | 8.64e-04 | 1.86e-02 | 8 |
| Page: 1 |
| Pathway ID | Tissue | Disease Stage | Description | Gene Ratio | Bg Ratio | pvalue | p.adjust | qvalue | Count |
| Page: 1 |
Top |
Cell-cell communication analysis |
| Identification of potential cell-cell interactions between two cell types and their ligand-receptor pairs for different disease states |
| Ligand | Receptor | LRpair | Pathway | Tissue | Disease Stage |
| Page: 1 |
Top |
Single-cell gene regulatory network inference analysis |
| Find out the significant the regulons (TFs) and the target genes of each regulon across cell types for different disease states |
| TF | Cell Type | Tissue | Disease Stage | Target Gene | RSS | Regulon Activity |
| ∗The dot plots of a searched regulon are shown for all cell subpopulations in each disease state of each tissue based on the regulon specific score inferred using pySCENIC and by calculating the average expression. |
| Page: 1 |
Top |
Somatic mutation of malignant transformation related genes |
| Annotation of somatic variants for genes involved in malignant transformation |
| Hugo Symbol | Variant Class | Variant Classification | dbSNP RS | HGVSc | HGVSp | HGVSp Short | SWISSPROT | BIOTYPE | SIFT | PolyPhen | Tumor Sample Barcode | Tissue | Histology | Sex | Age | Stage | Therapy Types | Drugs | Outcome |
| IQCJ-SCHIP1 | SNV | Missense_Mutation | c.1327N>A | p.Glu443Lys | p.E443K | protein_coding | deleterious(0.01) | probably_damaging(0.994) | TCGA-BH-A1F8-01 | Breast | breast invasive carcinoma | Female | >=65 | III/IV | Unknown | Unknown | PD | ||
| IQCJ-SCHIP1 | SNV | Missense_Mutation | novel | c.1345G>T | p.Ala449Ser | p.A449S | protein_coding | tolerated(0.13) | probably_damaging(0.996) | TCGA-EW-A3E8-01 | Breast | breast invasive carcinoma | Female | <65 | I/II | Hormone Therapy | anastrozole | SD | |
| IQCJ-SCHIP1 | SNV | Missense_Mutation | rs757171954 | c.1669G>A | p.Ala557Thr | p.A557T | protein_coding | tolerated_low_confidence(0.06) | possibly_damaging(0.766) | TCGA-AA-3950-01 | Colorectum | colon adenocarcinoma | Female | >=65 | I/II | Unknown | Unknown | SD | |
| IQCJ-SCHIP1 | SNV | Missense_Mutation | c.903N>T | p.Glu301Asp | p.E301D | protein_coding | tolerated(0.3) | possibly_damaging(0.479) | TCGA-AD-6889-01 | Colorectum | colon adenocarcinoma | Male | >=65 | I/II | Chemotherapy | xeloda | PD | ||
| IQCJ-SCHIP1 | SNV | Missense_Mutation | rs143827102 | c.1411N>A | p.Val471Ile | p.V471I | protein_coding | tolerated(0.37) | probably_damaging(0.991) | TCGA-AM-5821-01 | Colorectum | colon adenocarcinoma | Female | >=65 | I/II | Unknown | Unknown | SD | |
| IQCJ-SCHIP1 | SNV | Missense_Mutation | c.523N>A | p.Glu175Lys | p.E175K | protein_coding | tolerated_low_confidence(0.14) | benign(0.219) | TCGA-AZ-4315-01 | Colorectum | colon adenocarcinoma | Male | <65 | I/II | Unknown | Unknown | SD | ||
| IQCJ-SCHIP1 | SNV | Missense_Mutation | c.1314N>T | p.Lys438Asn | p.K438N | protein_coding | deleterious(0.04) | possibly_damaging(0.856) | TCGA-AZ-4315-01 | Colorectum | colon adenocarcinoma | Male | <65 | I/II | Unknown | Unknown | SD | ||
| IQCJ-SCHIP1 | SNV | Missense_Mutation | novel | c.548G>A | p.Arg183His | p.R183H | protein_coding | tolerated_low_confidence(0.1) | benign(0.029) | TCGA-CK-4951-01 | Colorectum | colon adenocarcinoma | Female | >=65 | I/II | Unknown | Unknown | PD | |
| IQCJ-SCHIP1 | SNV | Missense_Mutation | c.1621N>A | p.Asp541Asn | p.D541N | protein_coding | deleterious(0.01) | probably_damaging(0.998) | TCGA-CM-5861-01 | Colorectum | colon adenocarcinoma | Female | <65 | I/II | Unknown | Unknown | PD | ||
| IQCJ-SCHIP1 | SNV | Missense_Mutation | c.428N>A | p.Ser143Asn | p.S143N | protein_coding | deleterious_low_confidence(0.01) | benign(0.154) | TCGA-QL-A97D-01 | Colorectum | colon adenocarcinoma | Female | >=65 | I/II | Unknown | Unknown | SD |
| Page: 1 2 3 4 5 |
Top |
Related drugs of malignant transformation related genes |
| Identification of chemicals and drugs interact with genes involved in malignant transfromation |
| (DGIdb 4.0) |
| Entrez ID | Symbol | Category | Interaction Types | Drug Claim Name | Drug Name | PMIDs |
| Page: 1 |

Copyright 2023-Present -The University of Texas Health Science Center at Houston |