
|
|||||
|
 | |
| |
| |
| |
| |
| |
|
Gene: IQCG |
Gene summary for IQCG |
| Gene information | Species | Human | Gene symbol | IQCG | Gene ID | 84223 |
| Gene name | IQ motif containing G | |
| Gene Alias | CFAP122 | |
| Cytomap | 3q29 | |
| Gene Type | protein-coding | GO ID | GO:0000003 | UniProtAcc | Q9H095 |
Top |
Malignant transformation analysis |
| Identification of the aberrant gene expression in precancerous and cancerous lesions by comparing the gene expression of stem-like cells in diseased tissues with normal stem cells |
| Entrez ID | Symbol | Replicates | Species | Organ | Tissue | Adj P-value | Log2FC | Malignancy |
| 84223 | IQCG | LZE7T | Human | Esophagus | ESCC | 5.58e-03 | 2.21e-01 | 0.0667 |
| 84223 | IQCG | LZE24T | Human | Esophagus | ESCC | 1.51e-05 | 3.13e-01 | 0.0596 |
| 84223 | IQCG | LZE21T | Human | Esophagus | ESCC | 4.27e-03 | 2.89e-01 | 0.0655 |
| 84223 | IQCG | LZE6T | Human | Esophagus | ESCC | 8.05e-03 | 1.77e-01 | 0.0845 |
| 84223 | IQCG | P1T-E | Human | Esophagus | ESCC | 6.76e-05 | 4.04e-01 | 0.0875 |
| 84223 | IQCG | P2T-E | Human | Esophagus | ESCC | 1.41e-30 | 5.94e-01 | 0.1177 |
| 84223 | IQCG | P4T-E | Human | Esophagus | ESCC | 2.53e-10 | 2.75e-01 | 0.1323 |
| 84223 | IQCG | P5T-E | Human | Esophagus | ESCC | 1.31e-23 | 5.27e-01 | 0.1327 |
| 84223 | IQCG | P8T-E | Human | Esophagus | ESCC | 2.10e-07 | 2.05e-01 | 0.0889 |
| 84223 | IQCG | P10T-E | Human | Esophagus | ESCC | 1.37e-09 | 1.90e-01 | 0.116 |
| 84223 | IQCG | P11T-E | Human | Esophagus | ESCC | 8.35e-17 | 7.77e-01 | 0.1426 |
| 84223 | IQCG | P12T-E | Human | Esophagus | ESCC | 1.31e-06 | 1.19e-01 | 0.1122 |
| 84223 | IQCG | P15T-E | Human | Esophagus | ESCC | 7.35e-05 | 1.64e-01 | 0.1149 |
| 84223 | IQCG | P16T-E | Human | Esophagus | ESCC | 1.24e-12 | 2.50e-01 | 0.1153 |
| 84223 | IQCG | P17T-E | Human | Esophagus | ESCC | 5.36e-04 | 3.90e-01 | 0.1278 |
| 84223 | IQCG | P19T-E | Human | Esophagus | ESCC | 1.08e-02 | 6.87e-01 | 0.1662 |
| 84223 | IQCG | P20T-E | Human | Esophagus | ESCC | 3.49e-10 | 2.33e-01 | 0.1124 |
| 84223 | IQCG | P21T-E | Human | Esophagus | ESCC | 4.28e-08 | 1.84e-01 | 0.1617 |
| 84223 | IQCG | P22T-E | Human | Esophagus | ESCC | 1.36e-05 | 1.67e-01 | 0.1236 |
| 84223 | IQCG | P23T-E | Human | Esophagus | ESCC | 2.37e-06 | 3.06e-01 | 0.108 |
| Page: 1 2 3 4 |
| Tissue | Expression Dynamics | Abbreviation |
| Esophagus | 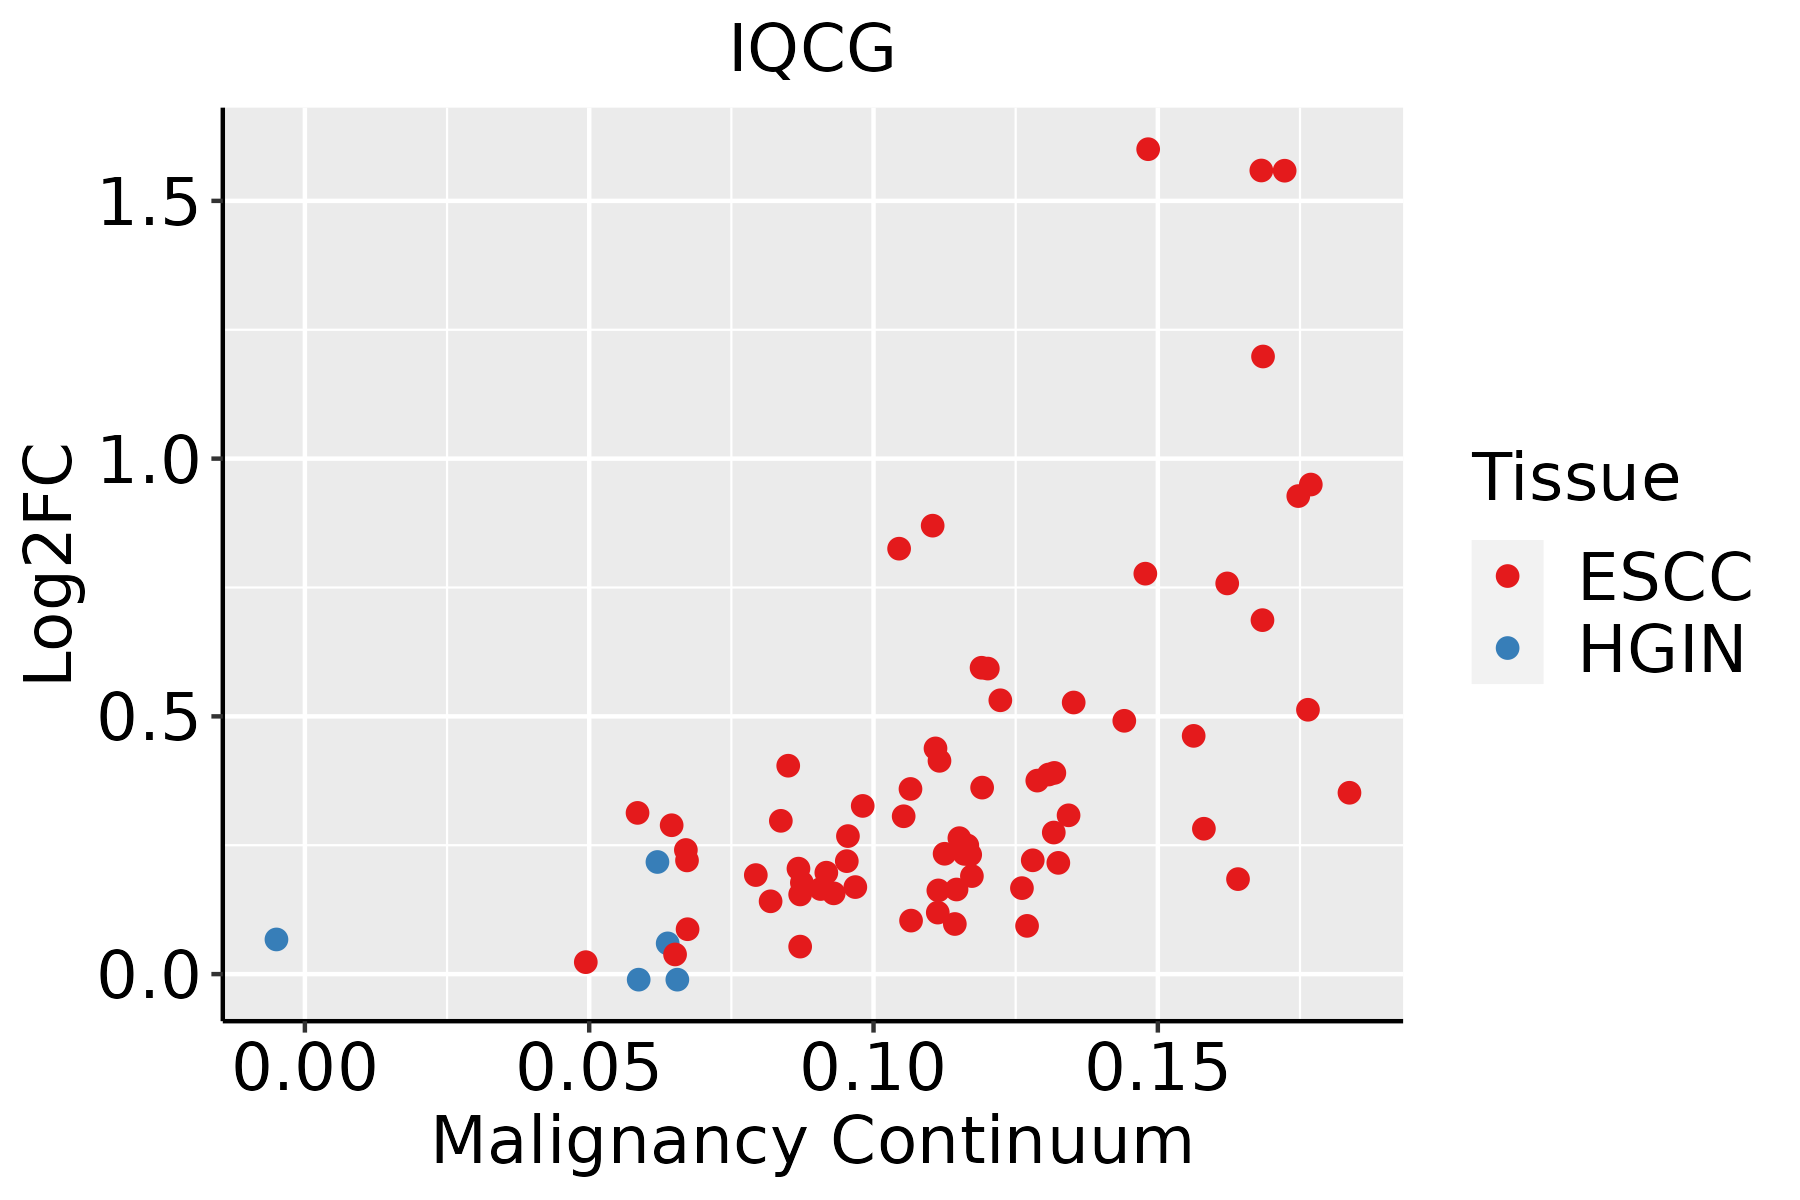 | ESCC: Esophageal squamous cell carcinoma |
| HGIN: High-grade intraepithelial neoplasias | ||
| LGIN: Low-grade intraepithelial neoplasias | ||
| Lung | 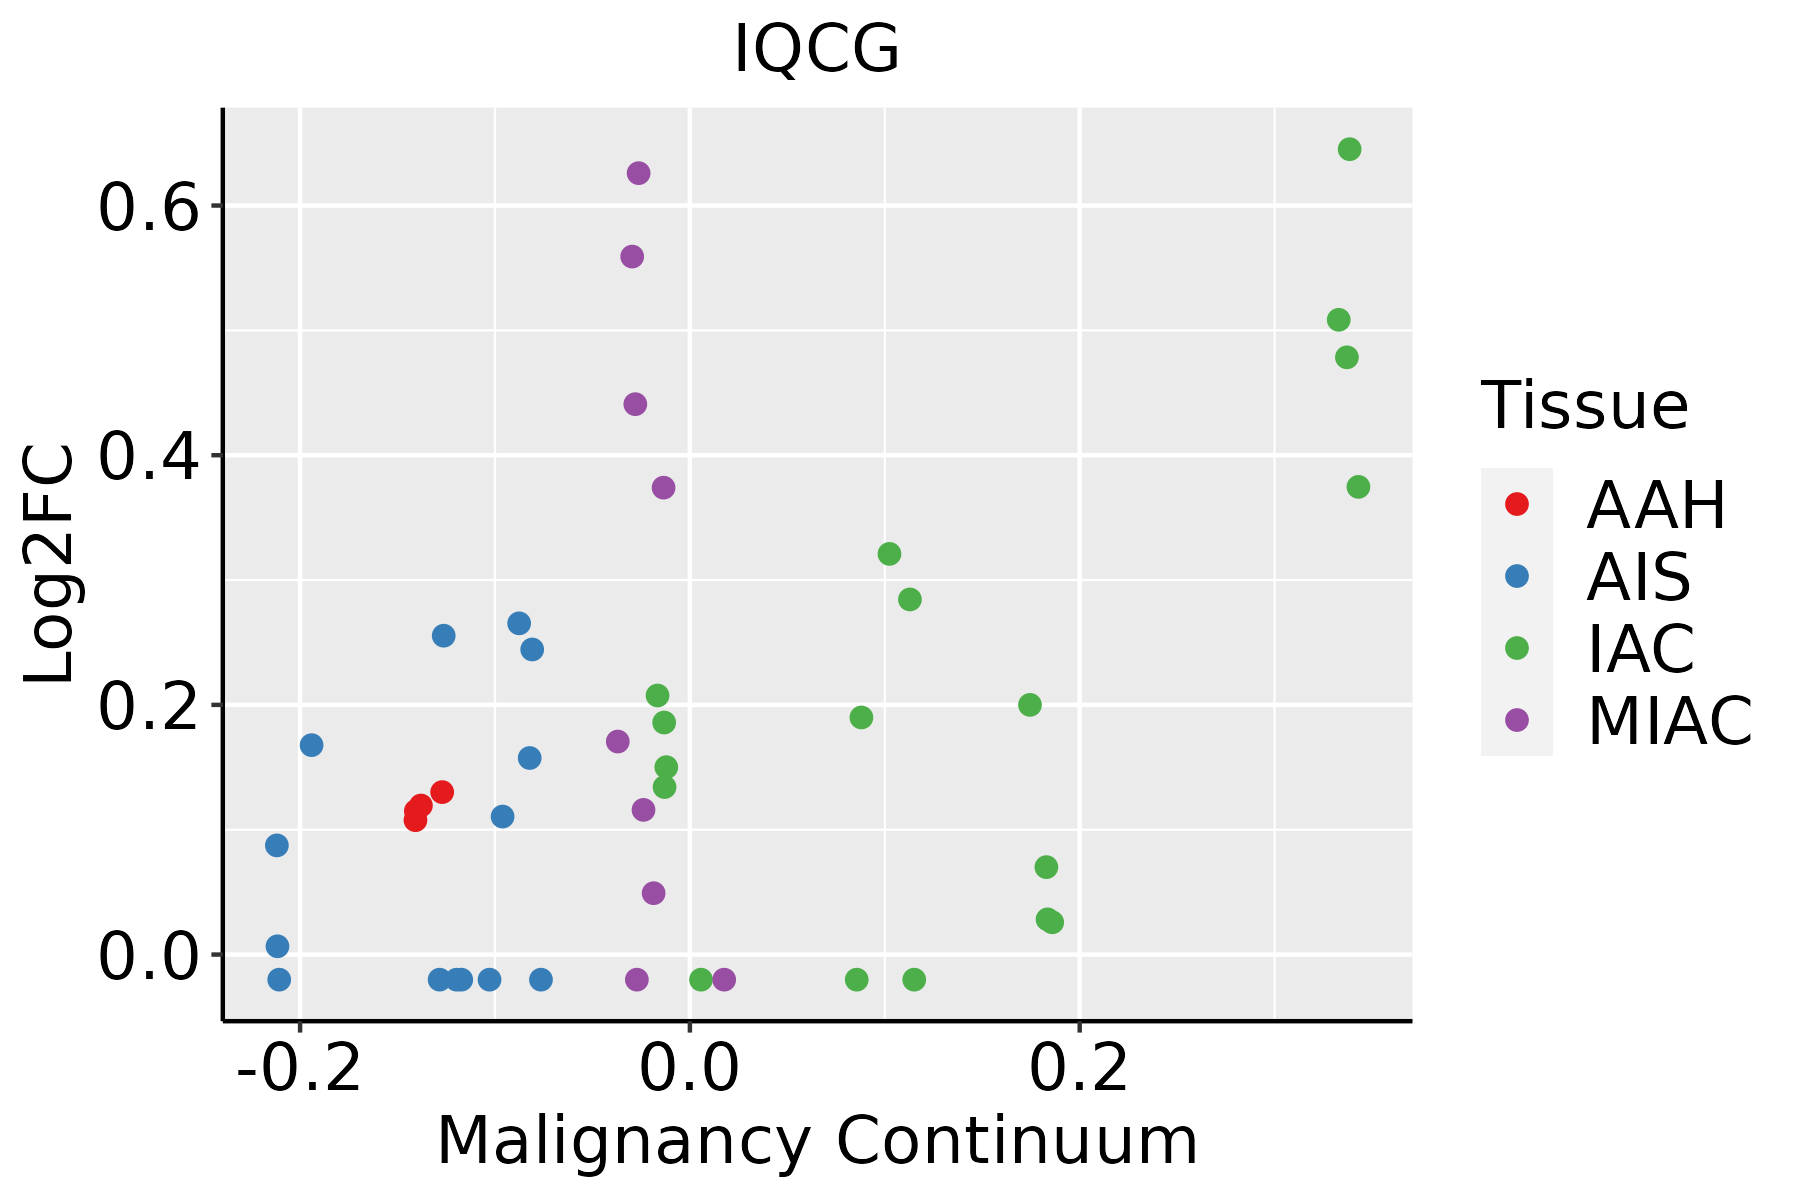 | AAH: Atypical adenomatous hyperplasia |
| AIS: Adenocarcinoma in situ | ||
| IAC: Invasive lung adenocarcinoma | ||
| MIA: Minimally invasive adenocarcinoma | ||
| Oral Cavity | 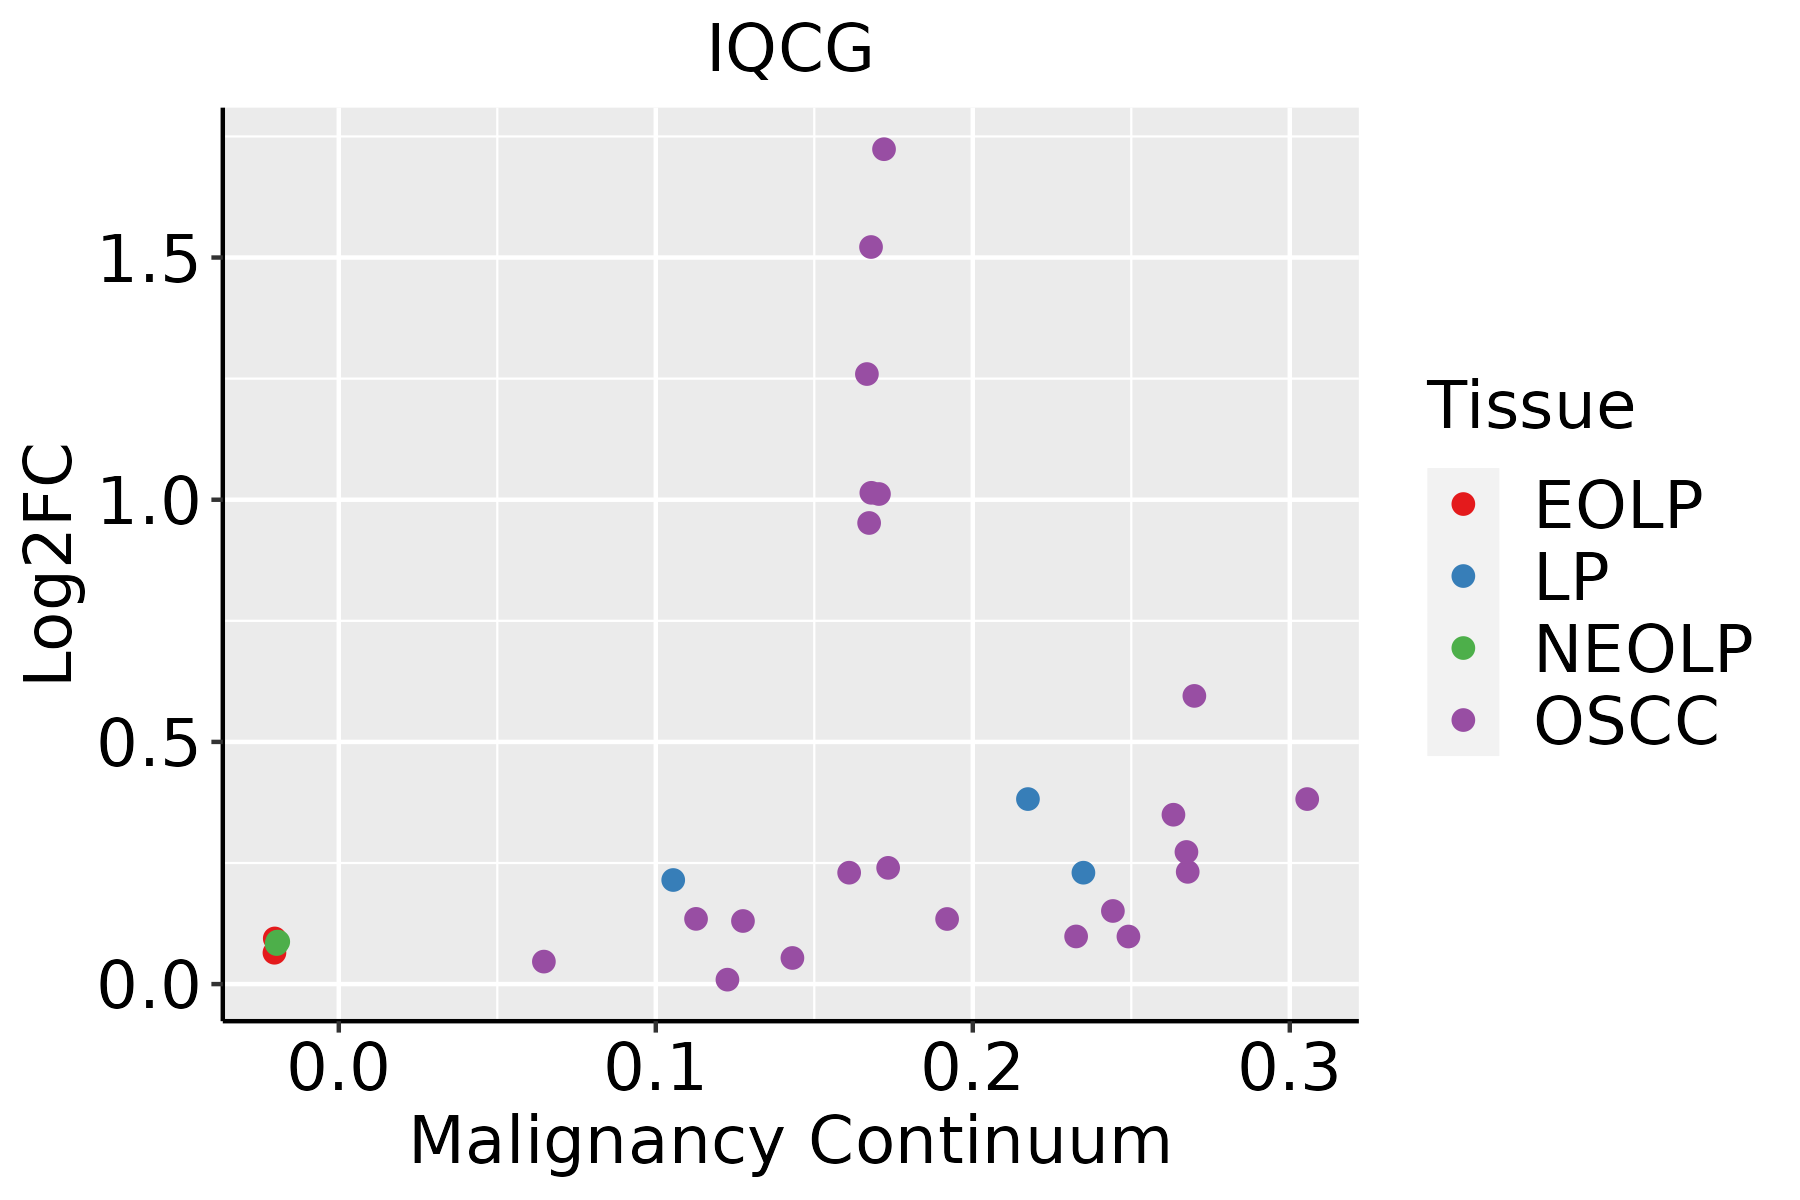 | EOLP: Erosive Oral lichen planus |
| LP: leukoplakia | ||
| NEOLP: Non-erosive oral lichen planus | ||
| OSCC: Oral squamous cell carcinoma |
| ∗log2FC in expression of this searched gene in stem-like cells from each diseased tissue sample relative to stem-like cells in normal samples in each tissue plotted against the malignancy continuum. Samples are colored based on if they are from different disease stage. |
Top |
Malignant transformation related pathway analysis |
| Find out the enriched GO biological processes and KEGG pathways involved in transition from healthy to precancer to cancer |
| Tissue | Disease Stage | Enriched GO biological Processes |
| Colorectum | AD |  |
| Colorectum | SER |  |
| Colorectum | MSS |  |
| Colorectum | MSI-H |  |
| Colorectum | FAP |  |
| ∗Top 15 enriched GO BP terms are showed in the bar plot of each disease state in each tissue. Each row represents a significant GO biological process which is colored according to the -log10(p.adjust). |
| Page: 1 2 3 4 5 6 7 8 9 |
| GO ID | Tissue | Disease Stage | Description | Gene Ratio | Bg Ratio | pvalue | p.adjust | Count |
| GO:0060271 | Lung | IAC | cilium assembly | 55/2061 | 337/18723 | 1.84e-03 | 1.88e-02 | 55 |
| GO:0044782 | Lung | IAC | cilium organization | 58/2061 | 368/18723 | 3.15e-03 | 2.75e-02 | 58 |
| Page: 1 |
| Pathway ID | Tissue | Disease Stage | Description | Gene Ratio | Bg Ratio | pvalue | p.adjust | qvalue | Count |
| Page: 1 |
Top |
Cell-cell communication analysis |
| Identification of potential cell-cell interactions between two cell types and their ligand-receptor pairs for different disease states |
| Ligand | Receptor | LRpair | Pathway | Tissue | Disease Stage |
| Page: 1 |
Top |
Single-cell gene regulatory network inference analysis |
| Find out the significant the regulons (TFs) and the target genes of each regulon across cell types for different disease states |
| TF | Cell Type | Tissue | Disease Stage | Target Gene | RSS | Regulon Activity |
| ∗The dot plots of a searched regulon are shown for all cell subpopulations in each disease state of each tissue based on the regulon specific score inferred using pySCENIC and by calculating the average expression. |
| Page: 1 |
Top |
Somatic mutation of malignant transformation related genes |
| Annotation of somatic variants for genes involved in malignant transformation |
| Hugo Symbol | Variant Class | Variant Classification | dbSNP RS | HGVSc | HGVSp | HGVSp Short | SWISSPROT | BIOTYPE | SIFT | PolyPhen | Tumor Sample Barcode | Tissue | Histology | Sex | Age | Stage | Therapy Types | Drugs | Outcome |
| IQCG | SNV | Missense_Mutation | rs374289605 | c.1121T>C | p.Ile374Thr | p.I374T | Q9H095 | protein_coding | tolerated(0.07) | benign(0.025) | TCGA-A2-A0CQ-01 | Breast | breast invasive carcinoma | Female | <65 | I/II | Chemotherapy | adriamycin | SD |
| IQCG | SNV | Missense_Mutation | novel | c.142N>A | p.Glu48Lys | p.E48K | Q9H095 | protein_coding | tolerated_low_confidence(0.08) | probably_damaging(0.994) | TCGA-A7-A5ZX-01 | Breast | breast invasive carcinoma | Female | <65 | III/IV | Chemotherapy | doxorubicin | CR |
| IQCG | SNV | Missense_Mutation | novel | c.1088N>T | p.Ala363Val | p.A363V | Q9H095 | protein_coding | deleterious(0.02) | possibly_damaging(0.625) | TCGA-AN-A046-01 | Breast | breast invasive carcinoma | Female | >=65 | I/II | Unknown | Unknown | SD |
| IQCG | SNV | Missense_Mutation | novel | c.100N>A | p.Glu34Lys | p.E34K | Q9H095 | protein_coding | tolerated_low_confidence(0.09) | benign(0.012) | TCGA-AR-A0U0-01 | Breast | breast invasive carcinoma | Female | >=65 | I/II | Unknown | Unknown | SD |
| IQCG | SNV | Missense_Mutation | novel | c.99N>C | p.Glu33Asp | p.E33D | Q9H095 | protein_coding | tolerated_low_confidence(0.09) | benign(0.107) | TCGA-AR-A0U0-01 | Breast | breast invasive carcinoma | Female | >=65 | I/II | Unknown | Unknown | SD |
| IQCG | SNV | Missense_Mutation | c.399N>G | p.Ile133Met | p.I133M | Q9H095 | protein_coding | tolerated(0.13) | benign(0.019) | TCGA-C5-A1BF-01 | Cervix | cervical & endocervical cancer | Female | <65 | I/II | Chemotherapy | cisplatin | PD | |
| IQCG | SNV | Missense_Mutation | novel | c.1020N>A | p.Met340Ile | p.M340I | Q9H095 | protein_coding | deleterious(0.05) | benign(0.152) | TCGA-UC-A7PG-06 | Cervix | cervical & endocervical cancer | Female | <65 | III/IV | Chemotherapy | cisplatin | PD |
| IQCG | SNV | Missense_Mutation | c.828G>C | p.Gln276His | p.Q276H | Q9H095 | protein_coding | deleterious(0.03) | benign(0.391) | TCGA-VS-A8EJ-01 | Cervix | cervical & endocervical cancer | Female | <65 | I/II | Chemotherapy | cisplatin | PD | |
| IQCG | SNV | Missense_Mutation | c.399N>G | p.Ile133Met | p.I133M | Q9H095 | protein_coding | tolerated(0.13) | benign(0.019) | TCGA-VS-A958-01 | Cervix | cervical & endocervical cancer | Female | <65 | I/II | Chemotherapy | cisplatin | CR | |
| IQCG | SNV | Missense_Mutation | c.1268N>G | p.Val423Gly | p.V423G | Q9H095 | protein_coding | tolerated(0.45) | benign(0.021) | TCGA-A6-6141-01 | Colorectum | colon adenocarcinoma | Male | <65 | I/II | Chemotherapy | 5-fu | SD |
| Page: 1 2 3 4 5 6 |
Top |
Related drugs of malignant transformation related genes |
| Identification of chemicals and drugs interact with genes involved in malignant transfromation |
| (DGIdb 4.0) |
| Entrez ID | Symbol | Category | Interaction Types | Drug Claim Name | Drug Name | PMIDs |
| Page: 1 |

Copyright 2023-Present -The University of Texas Health Science Center at Houston |