
|
|||||
|
 | |
| |
| |
| |
| |
| |
|
Gene: IQCB1 |
Gene summary for IQCB1 |
| Gene information | Species | Human | Gene symbol | IQCB1 | Gene ID | 9657 |
| Gene name | IQ motif containing B1 | |
| Gene Alias | NPHP5 | |
| Cytomap | 3q13.33 | |
| Gene Type | protein-coding | GO ID | GO:0001894 | UniProtAcc | Q15051 |
Top |
Malignant transformation analysis |
| Identification of the aberrant gene expression in precancerous and cancerous lesions by comparing the gene expression of stem-like cells in diseased tissues with normal stem cells |
| Entrez ID | Symbol | Replicates | Species | Organ | Tissue | Adj P-value | Log2FC | Malignancy |
| 9657 | IQCB1 | CCI_1 | Human | Cervix | CC | 1.29e-07 | 7.86e-01 | 0.528 |
| 9657 | IQCB1 | CCI_2 | Human | Cervix | CC | 1.70e-11 | 1.23e+00 | 0.5249 |
| 9657 | IQCB1 | CCI_3 | Human | Cervix | CC | 1.20e-22 | 1.37e+00 | 0.516 |
| 9657 | IQCB1 | LZE2T | Human | Esophagus | ESCC | 3.01e-03 | 3.92e-01 | 0.082 |
| 9657 | IQCB1 | LZE4T | Human | Esophagus | ESCC | 3.04e-14 | 4.25e-01 | 0.0811 |
| 9657 | IQCB1 | LZE7T | Human | Esophagus | ESCC | 1.47e-12 | 5.99e-01 | 0.0667 |
| 9657 | IQCB1 | LZE8T | Human | Esophagus | ESCC | 1.27e-05 | 1.92e-01 | 0.067 |
| 9657 | IQCB1 | LZE20T | Human | Esophagus | ESCC | 1.39e-10 | 1.98e-01 | 0.0662 |
| 9657 | IQCB1 | LZE22T | Human | Esophagus | ESCC | 3.63e-02 | 3.67e-01 | 0.068 |
| 9657 | IQCB1 | LZE24T | Human | Esophagus | ESCC | 1.58e-19 | 4.93e-01 | 0.0596 |
| 9657 | IQCB1 | P1T-E | Human | Esophagus | ESCC | 4.58e-12 | 4.82e-01 | 0.0875 |
| 9657 | IQCB1 | P2T-E | Human | Esophagus | ESCC | 4.12e-25 | 3.68e-01 | 0.1177 |
| 9657 | IQCB1 | P4T-E | Human | Esophagus | ESCC | 1.01e-21 | 3.64e-01 | 0.1323 |
| 9657 | IQCB1 | P5T-E | Human | Esophagus | ESCC | 7.51e-25 | 4.59e-01 | 0.1327 |
| 9657 | IQCB1 | P8T-E | Human | Esophagus | ESCC | 1.02e-35 | 7.04e-01 | 0.0889 |
| 9657 | IQCB1 | P9T-E | Human | Esophagus | ESCC | 7.37e-15 | 3.11e-01 | 0.1131 |
| 9657 | IQCB1 | P10T-E | Human | Esophagus | ESCC | 4.20e-29 | 6.16e-01 | 0.116 |
| 9657 | IQCB1 | P11T-E | Human | Esophagus | ESCC | 6.49e-18 | 5.68e-01 | 0.1426 |
| 9657 | IQCB1 | P12T-E | Human | Esophagus | ESCC | 2.69e-18 | 2.33e-01 | 0.1122 |
| 9657 | IQCB1 | P15T-E | Human | Esophagus | ESCC | 1.10e-27 | 5.09e-01 | 0.1149 |
| Page: 1 2 3 4 5 |
| Tissue | Expression Dynamics | Abbreviation |
| Cervix |  | CC: Cervix cancer |
| HSIL_HPV: HPV-infected high-grade squamous intraepithelial lesions | ||
| N_HPV: HPV-infected normal cervix | ||
| Esophagus | 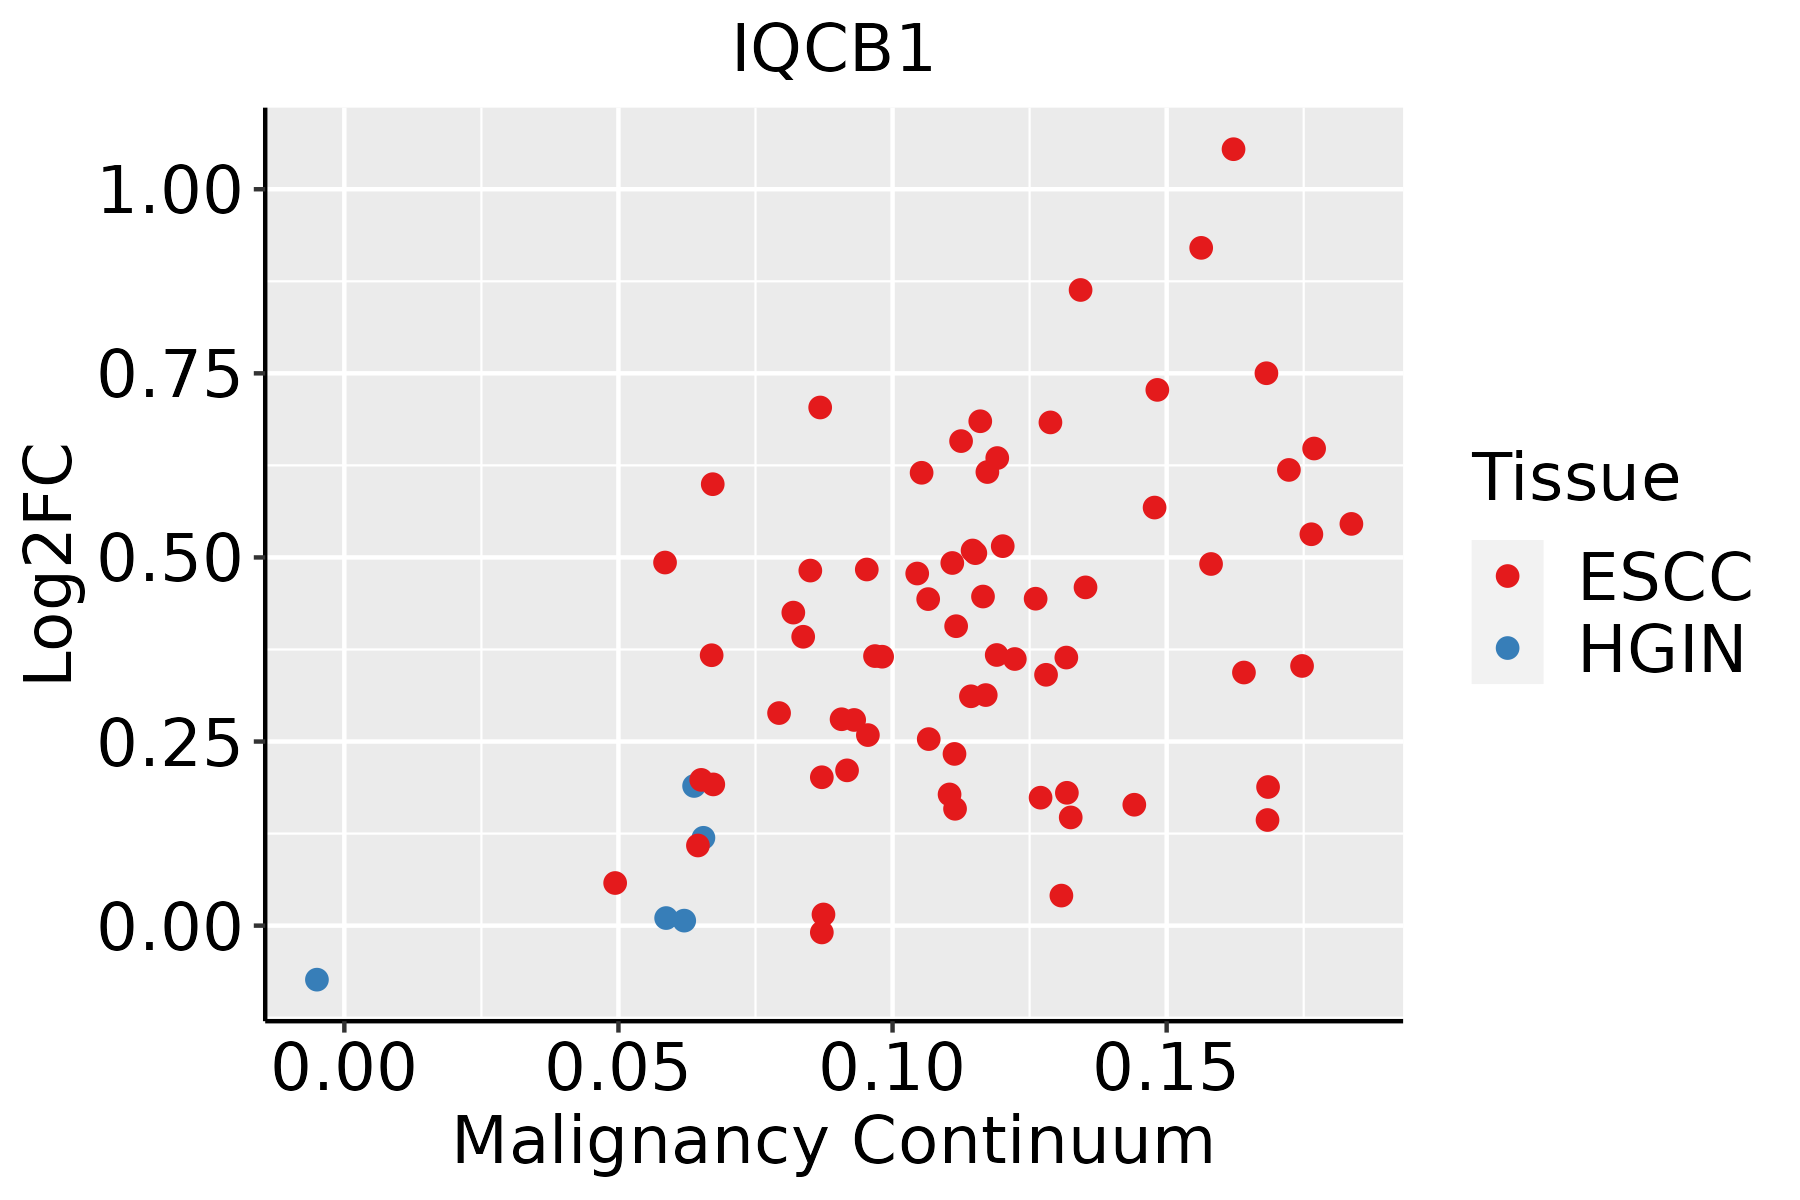 | ESCC: Esophageal squamous cell carcinoma |
| HGIN: High-grade intraepithelial neoplasias | ||
| LGIN: Low-grade intraepithelial neoplasias | ||
| Oral Cavity |  | EOLP: Erosive Oral lichen planus |
| LP: leukoplakia | ||
| NEOLP: Non-erosive oral lichen planus | ||
| OSCC: Oral squamous cell carcinoma |
| ∗log2FC in expression of this searched gene in stem-like cells from each diseased tissue sample relative to stem-like cells in normal samples in each tissue plotted against the malignancy continuum. Samples are colored based on if they are from different disease stage. |
Top |
Malignant transformation related pathway analysis |
| Find out the enriched GO biological processes and KEGG pathways involved in transition from healthy to precancer to cancer |
| Tissue | Disease Stage | Enriched GO biological Processes |
| Colorectum | AD |  |
| Colorectum | SER |  |
| Colorectum | MSS |  |
| Colorectum | MSI-H |  |
| Colorectum | FAP |  |
| ∗Top 15 enriched GO BP terms are showed in the bar plot of each disease state in each tissue. Each row represents a significant GO biological process which is colored according to the -log10(p.adjust). |
| Page: 1 2 3 4 5 6 7 8 9 |
| GO ID | Tissue | Disease Stage | Description | Gene Ratio | Bg Ratio | pvalue | p.adjust | Count |
| GO:00018949 | Cervix | CC | tissue homeostasis | 57/2311 | 268/18723 | 2.43e-05 | 4.21e-04 | 57 |
| GO:00602498 | Cervix | CC | anatomical structure homeostasis | 63/2311 | 314/18723 | 6.03e-05 | 8.68e-04 | 63 |
| GO:00018957 | Cervix | CC | retina homeostasis | 19/2311 | 79/18723 | 2.94e-03 | 1.94e-02 | 19 |
| Page: 1 |
| Pathway ID | Tissue | Disease Stage | Description | Gene Ratio | Bg Ratio | pvalue | p.adjust | qvalue | Count |
| Page: 1 |
Top |
Cell-cell communication analysis |
| Identification of potential cell-cell interactions between two cell types and their ligand-receptor pairs for different disease states |
| Ligand | Receptor | LRpair | Pathway | Tissue | Disease Stage |
| Page: 1 |
Top |
Single-cell gene regulatory network inference analysis |
| Find out the significant the regulons (TFs) and the target genes of each regulon across cell types for different disease states |
| TF | Cell Type | Tissue | Disease Stage | Target Gene | RSS | Regulon Activity |
| ∗The dot plots of a searched regulon are shown for all cell subpopulations in each disease state of each tissue based on the regulon specific score inferred using pySCENIC and by calculating the average expression. |
| Page: 1 |
Top |
Somatic mutation of malignant transformation related genes |
| Annotation of somatic variants for genes involved in malignant transformation |
| Hugo Symbol | Variant Class | Variant Classification | dbSNP RS | HGVSc | HGVSp | HGVSp Short | SWISSPROT | BIOTYPE | SIFT | PolyPhen | Tumor Sample Barcode | Tissue | Histology | Sex | Age | Stage | Therapy Types | Drugs | Outcome |
| IQCB1 | SNV | Missense_Mutation | rs375556381 | c.1270N>G | p.Gln424Glu | p.Q424E | Q15051 | protein_coding | deleterious(0) | benign(0.006) | TCGA-A2-A04R-01 | Breast | breast invasive carcinoma | Female | <65 | I/II | Chemotherapy | taxol | SD |
| IQCB1 | SNV | Missense_Mutation | rs112790935 | c.1108A>G | p.Met370Val | p.M370V | Q15051 | protein_coding | tolerated(0.06) | possibly_damaging(0.448) | TCGA-A2-A0D4-01 | Breast | breast invasive carcinoma | Female | <65 | I/II | Chemotherapy | adriamycin | SD |
| IQCB1 | SNV | Missense_Mutation | novel | c.402N>C | p.Glu134Asp | p.E134D | Q15051 | protein_coding | tolerated(0.14) | probably_damaging(0.931) | TCGA-AN-A046-01 | Breast | breast invasive carcinoma | Female | >=65 | I/II | Unknown | Unknown | SD |
| IQCB1 | SNV | Missense_Mutation | c.558N>T | p.Met186Ile | p.M186I | Q15051 | protein_coding | deleterious(0) | benign(0) | TCGA-B6-A0WZ-01 | Breast | breast invasive carcinoma | Female | <65 | I/II | Unknown | Unknown | PD | |
| IQCB1 | SNV | Missense_Mutation | rs774439677 | c.406N>C | p.Asp136His | p.D136H | Q15051 | protein_coding | tolerated(0.05) | probably_damaging(0.994) | TCGA-BH-A0HK-01 | Breast | breast invasive carcinoma | Female | >=65 | I/II | Hormone Therapy | arimidex | SD |
| IQCB1 | SNV | Missense_Mutation | c.1063C>G | p.Gln355Glu | p.Q355E | Q15051 | protein_coding | tolerated(0.12) | benign(0) | TCGA-EW-A3E8-01 | Breast | breast invasive carcinoma | Female | <65 | I/II | Hormone Therapy | anastrozole | SD | |
| IQCB1 | insertion | In_Frame_Ins | novel | c.1155_1156insGCTAAGTCTTATTGTTGTCAGCTC | p.Glu385_Met386insAlaLysSerTyrCysCysGlnLeu | p.E385_M386insAKSYCCQL | Q15051 | protein_coding | TCGA-A2-A0EM-01 | Breast | breast invasive carcinoma | Female | >=65 | I/II | Hormone Therapy | tamoxiphen | SD | ||
| IQCB1 | insertion | Nonsense_Mutation | novel | c.1142_1143insTCACAGCCTTGAACTCCTGGGCTAAAGTGATCCTCCTGC | p.Lys381delinsAsnHisSerLeuGluLeuLeuGlyTerSerAspProProAla | p.K381delinsNHSLELLG*SDPPA | Q15051 | protein_coding | TCGA-A8-A07J-01 | Breast | breast invasive carcinoma | Female | <65 | I/II | Chemotherapy | 5-fluorouracil | CR | ||
| IQCB1 | SNV | Missense_Mutation | rs778777318 | c.1466G>A | p.Arg489Gln | p.R489Q | Q15051 | protein_coding | tolerated(0.43) | benign(0.001) | TCGA-2W-A8YY-01 | Cervix | cervical & endocervical cancer | Female | <65 | I/II | Chemotherapy | cisplatin | CR |
| IQCB1 | SNV | Missense_Mutation | novel | c.1164G>T | p.Glu388Asp | p.E388D | Q15051 | protein_coding | tolerated(0.12) | benign(0.009) | TCGA-2W-A8YY-01 | Cervix | cervical & endocervical cancer | Female | <65 | I/II | Chemotherapy | cisplatin | CR |
| Page: 1 2 3 4 5 6 |
Top |
Related drugs of malignant transformation related genes |
| Identification of chemicals and drugs interact with genes involved in malignant transfromation |
| (DGIdb 4.0) |
| Entrez ID | Symbol | Category | Interaction Types | Drug Claim Name | Drug Name | PMIDs |
| Page: 1 |

Copyright 2023-Present -The University of Texas Health Science Center at Houston |